 Email
Email Print
Print


Ammonium Sulfate Market - By Application & Geography - Forecast(2024 - 2030)
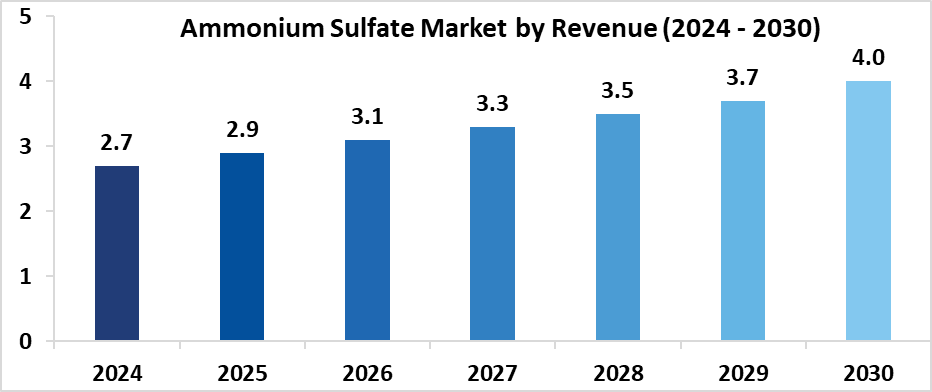
Ammonium Sulfate Market Overview
In this report, global Ammonium Sulfate market is further segmented based on the basis of end-use applications as follows:
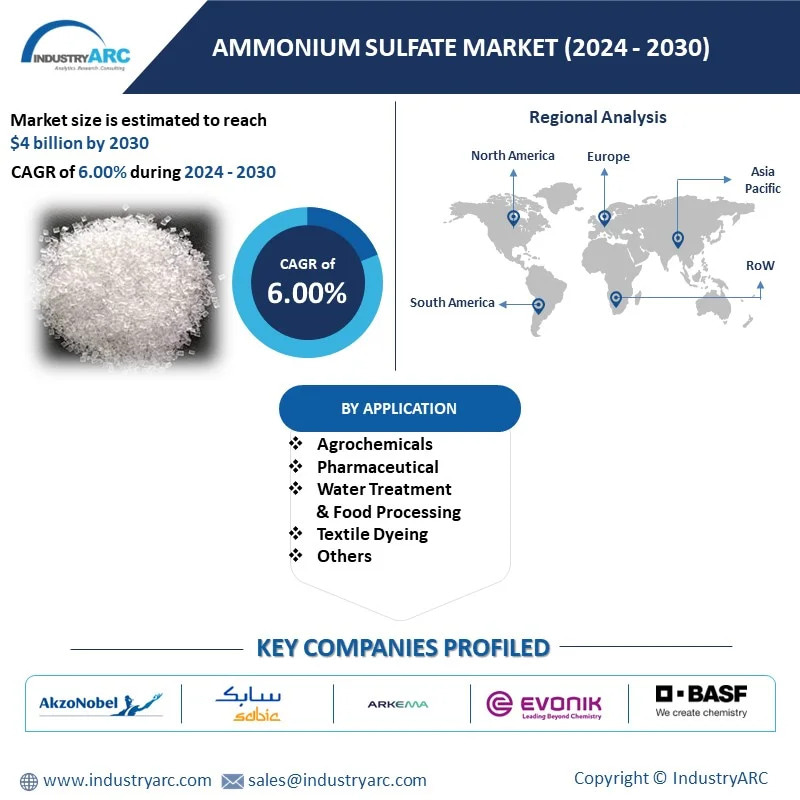
Ammonium Sulfate Market Segment Analysis - by Application
Ammonium Sulfate Market Segment Analysis - by Geography
Sample Companies Profiled in this Report are:
- Akzo Nobel N.V.
- SABIC
- Arkema
- BASF
- Evonik Industries
- Honeywell International Inc.
- Merck KGaA
- Sumitomo Chemical Co., Ltd.
- Lanxess
- Domo Chemicals
- 10+
Recent Developments
Key Market Players:
- Royal DSM
- Sumitomo Chemical
- Honeywell International
- Novus International
- Lanxess Corporation
List of Tables
Table 1 Ammonium Sulfate Market Overview 2023-2030
Table 2 Ammonium Sulfate Market Leader Analysis 2023-2030 (US$)
Table 3 Ammonium Sulfate MarketProduct Analysis 2023-2030 (US$)
Table 4 Ammonium Sulfate MarketEnd User Analysis 2023-2030 (US$)
Table 5 Ammonium Sulfate MarketPatent Analysis 2013-2023* (US$)
Table 6 Ammonium Sulfate MarketFinancial Analysis 2023-2030 (US$)
Table 7 Ammonium Sulfate Market Driver Analysis 2023-2030 (US$)
Table 8 Ammonium Sulfate MarketChallenges Analysis 2023-2030 (US$)
Table 9 Ammonium Sulfate MarketConstraint Analysis 2023-2030 (US$)
Table 10 Ammonium Sulfate Market Supplier Bargaining Power Analysis 2023-2030 (US$)
Table 11 Ammonium Sulfate Market Buyer Bargaining Power Analysis 2023-2030 (US$)
Table 12 Ammonium Sulfate Market Threat of Substitutes Analysis 2023-2030 (US$)
Table 13 Ammonium Sulfate Market Threat of New Entrants Analysis 2023-2030 (US$)
Table 14 Ammonium Sulfate Market Degree of Competition Analysis 2023-2030 (US$)
Table 15 Ammonium Sulfate MarketValue Chain Analysis 2023-2030 (US$)
Table 16 Ammonium Sulfate MarketPricing Analysis 2023-2030 (US$)
Table 17 Ammonium Sulfate MarketOpportunities Analysis 2023-2030 (US$)
Table 18 Ammonium Sulfate MarketProduct Life Cycle Analysis 2023-2030 (US$)
Table 19 Ammonium Sulfate MarketSupplier Analysis 2023-2030 (US$)
Table 20 Ammonium Sulfate MarketDistributor Analysis 2023-2030 (US$)
Table 21 Ammonium Sulfate Market Trend Analysis 2023-2030 (US$)
Table 22 Ammonium Sulfate Market Size 2023 (US$)
Table 23 Ammonium Sulfate Market Forecast Analysis 2023-2030 (US$)
Table 24 Ammonium Sulfate Market Sales Forecast Analysis 2023-2030 (Units)
Table 25 Ammonium Sulfate Market, Revenue & Volume,By Application, 2023-2030 ($)
Table 26 Ammonium Sulfate MarketBy Application, Revenue & Volume,By Agrochemicals, 2023-2030 ($)
Table 27 Ammonium Sulfate MarketBy Application, Revenue & Volume,By Pharmaceutical, 2023-2030 ($)
Table 28 Ammonium Sulfate MarketBy Application, Revenue & Volume,By Water Treatment & Food Processing, 2023-2030 ($)
Table 29 Ammonium Sulfate MarketBy Application, Revenue & Volume,By Textile Dyeing, 2023-2030 ($)
Table 30 North America Ammonium Sulfate Market, Revenue & Volume,By Application, 2023-2030 ($)
Table 31 South america Ammonium Sulfate Market, Revenue & Volume,By Application, 2023-2030 ($)
Table 32 Europe Ammonium Sulfate Market, Revenue & Volume,By Application, 2023-2030 ($)
Table 33 APAC Ammonium Sulfate Market, Revenue & Volume,By Application, 2023-2030 ($)
Table 34 Middle East & Africa Ammonium Sulfate Market, Revenue & Volume,By Application, 2023-2030 ($)
Table 35 Russia Ammonium Sulfate Market, Revenue & Volume,By Application, 2023-2030 ($)
Table 36 Israel Ammonium Sulfate Market, Revenue & Volume,By Application, 2023-2030 ($)
Table 37 Top Companies 2023 (US$)Ammonium Sulfate Market, Revenue & Volume,,
Table 38 Product Launch 2023-2030Ammonium Sulfate Market, Revenue & Volume,,
Table 39 Mergers & Acquistions 2023-2030Ammonium Sulfate Market, Revenue & Volume,,
List of Figures
Figure 1 Overview of Ammonium Sulfate Market 2023-2030
Figure 2 Market Share Analysis for Ammonium Sulfate Market 2023 (US$)
Figure 3 Product Comparison in Ammonium Sulfate Market 2023-2030 (US$)
Figure 4 End User Profile for Ammonium Sulfate Market 2023-2030 (US$)
Figure 5 Patent Application and Grant in Ammonium Sulfate Market 2013-2023* (US$)
Figure 6 Top 5 Companies Financial Analysis in Ammonium Sulfate Market 2023-2030 (US$)
Figure 7 Market Entry Strategy in Ammonium Sulfate Market 2023-2030
Figure 8 Ecosystem Analysis in Ammonium Sulfate Market2023
Figure 9 Average Selling Price in Ammonium Sulfate Market 2023-2030
Figure 10 Top Opportunites in Ammonium Sulfate Market 2023-2030
Figure 11 Market Life Cycle Analysis in Ammonium Sulfate Market
Figure 15 GlobalBy ApplicationAmmonium Sulfate Market Revenue, 2023-2030 ($)
Figure 17 Global Ammonium Sulfate Market - By Geography
Figure 18 Global Ammonium Sulfate Market Value & Volume, By Geography, 2023-2030 ($)
Figure 19 Global Ammonium Sulfate Market CAGR, By Geography, 2023-2030 (%)
Figure 20 North America Ammonium Sulfate Market Value & Volume, 2023-2030 ($)
Figure 21 US Ammonium Sulfate Market Value & Volume, 2023-2030 ($)
Figure 22 US GDP and Population, 2023-2030 ($)
Figure 23 US GDP – Composition of 2023, By Sector of Origin
Figure 24 US Export and Import Value & Volume, 2023-2030 ($)
Figure 25 Canada Ammonium Sulfate Market Value & Volume, 2023-2030 ($)
Figure 26 Canada GDP and Population, 2023-2030 ($)
Figure 27 Canada GDP – Composition of 2023, By Sector of Origin
Figure 28 Canada Export and Import Value & Volume, 2023-2030 ($)
Figure 29 Mexico Ammonium Sulfate Market Value & Volume, 2023-2030 ($)
Figure 30 Mexico GDP and Population, 2023-2030 ($)
Figure 31 Mexico GDP – Composition of 2023, By Sector of Origin
Figure 32 Mexico Export and Import Value & Volume, 2023-2030 ($)
Figure 33 South America Ammonium Sulfate MarketSouth America 3D Printing Market Value & Volume, 2023-2030 ($)
Figure 34 Brazil Ammonium Sulfate Market Value & Volume, 2023-2030 ($)
Figure 35 Brazil GDP and Population, 2023-2030 ($)
Figure 36 Brazil GDP – Composition of 2023, By Sector of Origin
Figure 37 Brazil Export and Import Value & Volume, 2023-2030 ($)
Figure 38 Venezuela Ammonium Sulfate Market Value & Volume, 2023-2030 ($)
Figure 39 Venezuela GDP and Population, 2023-2030 ($)
Figure 40 Venezuela GDP – Composition of 2023, By Sector of Origin
Figure 41 Venezuela Export and Import Value & Volume, 2023-2030 ($)
Figure 42 Argentina Ammonium Sulfate Market Value & Volume, 2023-2030 ($)
Figure 43 Argentina GDP and Population, 2023-2030 ($)
Figure 44 Argentina GDP – Composition of 2023, By Sector of Origin
Figure 45 Argentina Export and Import Value & Volume, 2023-2030 ($)
Figure 46 Ecuador Ammonium Sulfate Market Value & Volume, 2023-2030 ($)
Figure 47 Ecuador GDP and Population, 2023-2030 ($)
Figure 48 Ecuador GDP – Composition of 2023, By Sector of Origin
Figure 49 Ecuador Export and Import Value & Volume, 2023-2030 ($)
Figure 50 Peru Ammonium Sulfate Market Value & Volume, 2023-2030 ($)
Figure 51 Peru GDP and Population, 2023-2030 ($)
Figure 52 Peru GDP – Composition of 2023, By Sector of Origin
Figure 53 Peru Export and Import Value & Volume, 2023-2030 ($)
Figure 54 Colombia Ammonium Sulfate Market Value & Volume, 2023-2030 ($)
Figure 55 Colombia GDP and Population, 2023-2030 ($)
Figure 56 Colombia GDP – Composition of 2023, By Sector of Origin
Figure 57 Colombia Export and Import Value & Volume, 2023-2030 ($)
Figure 58 Costa Rica Ammonium Sulfate MarketCosta Rica 3D Printing Market Value & Volume, 2023-2030 ($)
Figure 59 Costa Rica GDP and Population, 2023-2030 ($)
Figure 60 Costa Rica GDP – Composition of 2023, By Sector of Origin
Figure 61 Costa Rica Export and Import Value & Volume, 2023-2030 ($)
Figure 62 Europe Ammonium Sulfate Market Value & Volume, 2023-2030 ($)
Figure 63 U.K Ammonium Sulfate Market Value & Volume, 2023-2030 ($)
Figure 64 U.K GDP and Population, 2023-2030 ($)
Figure 65 U.K GDP – Composition of 2023, By Sector of Origin
Figure 66 U.K Export and Import Value & Volume, 2023-2030 ($)
Figure 67 Germany Ammonium Sulfate Market Value & Volume, 2023-2030 ($)
Figure 68 Germany GDP and Population, 2023-2030 ($)
Figure 69 Germany GDP – Composition of 2023, By Sector of Origin
Figure 70 Germany Export and Import Value & Volume, 2023-2030 ($)
Figure 71 Italy Ammonium Sulfate Market Value & Volume, 2023-2030 ($)
Figure 72 Italy GDP and Population, 2023-2030 ($)
Figure 73 Italy GDP – Composition of 2023, By Sector of Origin
Figure 74 Italy Export and Import Value & Volume, 2023-2030 ($)
Figure 75 France Ammonium Sulfate Market Value & Volume, 2023-2030 ($)
Figure 76 France GDP and Population, 2023-2030 ($)
Figure 77 France GDP – Composition of 2023, By Sector of Origin
Figure 78 France Export and Import Value & Volume, 2023-2030 ($)
Figure 79 Netherlands Ammonium Sulfate Market Value & Volume, 2023-2030 ($)
Figure 80 Netherlands GDP and Population, 2023-2030 ($)
Figure 81 Netherlands GDP – Composition of 2023, By Sector of Origin
Figure 82 Netherlands Export and Import Value & Volume, 2023-2030 ($)
Figure 83 Belgium Ammonium Sulfate Market Value & Volume, 2023-2030 ($)
Figure 84 Belgium GDP and Population, 2023-2030 ($)
Figure 85 Belgium GDP – Composition of 2023, By Sector of Origin
Figure 86 Belgium Export and Import Value & Volume, 2023-2030 ($)
Figure 87 Spain Ammonium Sulfate Market Value & Volume, 2023-2030 ($)
Figure 88 Spain GDP and Population, 2023-2030 ($)
Figure 89 Spain GDP – Composition of 2023, By Sector of Origin
Figure 90 Spain Export and Import Value & Volume, 2023-2030 ($)
Figure 91 Denmark Ammonium Sulfate Market Value & Volume, 2023-2030 ($)
Figure 92 Denmark GDP and Population, 2023-2030 ($)
Figure 93 Denmark GDP – Composition of 2023, By Sector of Origin
Figure 94 Denmark Export and Import Value & Volume, 2023-2030 ($)
Figure 95 APAC Ammonium Sulfate Market Value & Volume, 2023-2030 ($)
Figure 96 China Ammonium Sulfate MarketValue & Volume, 2023-2030
Figure 97 China GDP and Population, 2023-2030 ($)
Figure 98 China GDP – Composition of 2023, By Sector of Origin
Figure 99 China Export and Import Value & Volume, 2023-2030 ($)Ammonium Sulfate MarketChina Export and Import Value & Volume, 2023-2030 ($)
Figure 100 Australia Ammonium Sulfate Market Value & Volume, 2023-2030 ($)
Figure 101 Australia GDP and Population, 2023-2030 ($)
Figure 102 Australia GDP – Composition of 2023, By Sector of Origin
Figure 103 Australia Export and Import Value & Volume, 2023-2030 ($)
Figure 104 South Korea Ammonium Sulfate Market Value & Volume, 2023-2030 ($)
Figure 105 South Korea GDP and Population, 2023-2030 ($)
Figure 106 South Korea GDP – Composition of 2023, By Sector of Origin
Figure 107 South Korea Export and Import Value & Volume, 2023-2030 ($)
Figure 108 India Ammonium Sulfate Market Value & Volume, 2023-2030 ($)
Figure 109 India GDP and Population, 2023-2030 ($)
Figure 110 India GDP – Composition of 2023, By Sector of Origin
Figure 111 India Export and Import Value & Volume, 2023-2030 ($)
Figure 112 Taiwan Ammonium Sulfate MarketTaiwan 3D Printing Market Value & Volume, 2023-2030 ($)
Figure 113 Taiwan GDP and Population, 2023-2030 ($)
Figure 114 Taiwan GDP – Composition of 2023, By Sector of Origin
Figure 115 Taiwan Export and Import Value & Volume, 2023-2030 ($)
Figure 116 Malaysia Ammonium Sulfate MarketMalaysia 3D Printing Market Value & Volume, 2023-2030 ($)
Figure 117 Malaysia GDP and Population, 2023-2030 ($)
Figure 118 Malaysia GDP – Composition of 2023, By Sector of Origin
Figure 119 Malaysia Export and Import Value & Volume, 2023-2030 ($)
Figure 120 Hong Kong Ammonium Sulfate MarketHong Kong 3D Printing Market Value & Volume, 2023-2030 ($)
Figure 121 Hong Kong GDP and Population, 2023-2030 ($)
Figure 122 Hong Kong GDP – Composition of 2023, By Sector of Origin
Figure 123 Hong Kong Export and Import Value & Volume, 2023-2030 ($)
Figure 124 Middle East & Africa Ammonium Sulfate MarketMiddle East & Africa 3D Printing Market Value & Volume, 2023-2030 ($)
Figure 125 Russia Ammonium Sulfate MarketRussia 3D Printing Market Value & Volume, 2023-2030 ($)
Figure 126 Russia GDP and Population, 2023-2030 ($)
Figure 127 Russia GDP – Composition of 2023, By Sector of Origin
Figure 128 Russia Export and Import Value & Volume, 2023-2030 ($)
Figure 129 Israel Ammonium Sulfate Market Value & Volume, 2023-2030 ($)
Figure 130 Israel GDP and Population, 2023-2030 ($)
Figure 131 Israel GDP – Composition of 2023, By Sector of Origin
Figure 132 Israel Export and Import Value & Volume, 2023-2030 ($)
Figure 133 Entropy Share, By Strategies, 2023-2030* (%)Ammonium Sulfate Market
Figure 134 Developments, 2023-2030*Ammonium Sulfate Market
Figure 135 Company 1 Ammonium Sulfate Market Net Revenue, By Years, 2023-2030* ($)
Figure 136 Company 1 Ammonium Sulfate Market Net Revenue Share, By Business segments, 2023 (%)
Figure 137 Company 1 Ammonium Sulfate Market Net Sales Share, By Geography, 2023 (%)
Figure 138 Company 2 Ammonium Sulfate Market Net Revenue, By Years, 2023-2030* ($)
Figure 139 Company 2 Ammonium Sulfate Market Net Revenue Share, By Business segments, 2023 (%)
Figure 140 Company 2 Ammonium Sulfate Market Net Sales Share, By Geography, 2023 (%)
Figure 141 Company 3Ammonium Sulfate Market Net Revenue, By Years, 2023-2030* ($)
Figure 142 Company 3Ammonium Sulfate Market Net Revenue Share, By Business segments, 2023 (%)
Figure 143 Company 3Ammonium Sulfate Market Net Sales Share, By Geography, 2023 (%)
Figure 144 Company 4 Ammonium Sulfate Market Net Revenue, By Years, 2023-2030* ($)
Figure 145 Company 4 Ammonium Sulfate Market Net Revenue Share, By Business segments, 2023 (%)
Figure 146 Company 4 Ammonium Sulfate Market Net Sales Share, By Geography, 2023 (%)
Figure 147 Company 5 Ammonium Sulfate Market Net Revenue, By Years, 2023-2030* ($)
Figure 148 Company 5 Ammonium Sulfate Market Net Revenue Share, By Business segments, 2023 (%)
Figure 149 Company 5 Ammonium Sulfate Market Net Sales Share, By Geography, 2023 (%)
Figure 150 Company 6 Ammonium Sulfate Market Net Revenue, By Years, 2023-2030* ($)
Figure 151 Company 6 Ammonium Sulfate Market Net Revenue Share, By Business segments, 2023 (%)
Figure 152 Company 6 Ammonium Sulfate Market Net Sales Share, By Geography, 2023 (%)
Figure 153 Company 7 Ammonium Sulfate Market Net Revenue, By Years, 2023-2030* ($)
Figure 154 Company 7 Ammonium Sulfate Market Net Revenue Share, By Business segments, 2023 (%)
Figure 155 Company 7 Ammonium Sulfate Market Net Sales Share, By Geography, 2023 (%)
Figure 156 Company 8 Ammonium Sulfate Market Net Revenue, By Years, 2023-2030* ($)
Figure 157 Company 8 Ammonium Sulfate Market Net Revenue Share, By Business segments, 2023 (%)
Figure 158 Company 8 Ammonium Sulfate Market Net Sales Share, By Geography, 2023 (%)
Figure 159 Company 9 Ammonium Sulfate Market Net Revenue, By Years, 2023-2030* ($)
Figure 160 Company 9 Ammonium Sulfate Market Net Revenue Share, By Business segments, 2023 (%)
Figure 161 Company 9 Ammonium Sulfate Market Net Sales Share, By Geography, 2023 (%)
Figure 162 Company 10 Ammonium Sulfate Market Net Revenue, By Years, 2023-2030* ($)
Figure 163 Company 10 Ammonium Sulfate Market Net Revenue Share, By Business segments, 2023 (%)
Figure 164 Company 10 Ammonium Sulfate Market Net Sales Share, By Geography, 2023 (%)
Figure 165 Company 11 Ammonium Sulfate Market Net Revenue, By Years, 2023-2030* ($)
Figure 166 Company 11 Ammonium Sulfate Market Net Revenue Share, By Business segments, 2023 (%)
Figure 167 Company 11 Ammonium Sulfate Market Net Sales Share, By Geography, 2023 (%)
Figure 168 Company 12 Ammonium Sulfate Market Net Revenue, By Years, 2023-2030* ($)
Figure 169 Company 12 Ammonium Sulfate Market Net Revenue Share, By Business segments, 2023 (%)
Figure 170 Company 12 Ammonium Sulfate Market Net Sales Share, By Geography, 2023 (%)
Figure 171 Company 13Ammonium Sulfate Market Net Revenue, By Years, 2023-2030* ($)
Figure 172 Company 13Ammonium Sulfate Market Net Revenue Share, By Business segments, 2023 (%)
Figure 173 Company 13Ammonium Sulfate Market Net Sales Share, By Geography, 2023 (%)
Figure 174 Company 14 Ammonium Sulfate Market Net Revenue, By Years, 2023-2030* ($)
Figure 175 Company 14 Ammonium Sulfate Market Net Revenue Share, By Business segments, 2023 (%)
Figure 176 Company 14 Ammonium Sulfate Market Net Sales Share, By Geography, 2023 (%)
Figure 177 Company 15 Ammonium Sulfate Market Net Revenue, By Years, 2023-2030* ($)
Figure 178 Company 15 Ammonium Sulfate Market Net Revenue Share, By Business segments, 2023 (%)
Figure 179 Company 15 Ammonium Sulfate Market Net Sales Share, By Geography, 2023 (%)