 Email
Email Print
Print


Insulated Gate Bipolar Transistor Market – By Type , By Power Rating , By Application , By Geography - Global Opportunity Analysis & Industry Forecast, 2024-2030
Insulated Gate Bipolar Transistor Market Overview:
Market Snapshot:
Insulated Gate Bipolar Transistor Market - Report Coverage:
| Attribute | Segment |
|---|---|
|
By Type |
|
|
By Power Rating |
|
By Application |
|
By Geography |
|
COVID-19 / Ukraine Crisis - Impact Analysis:
Key Takeaways:
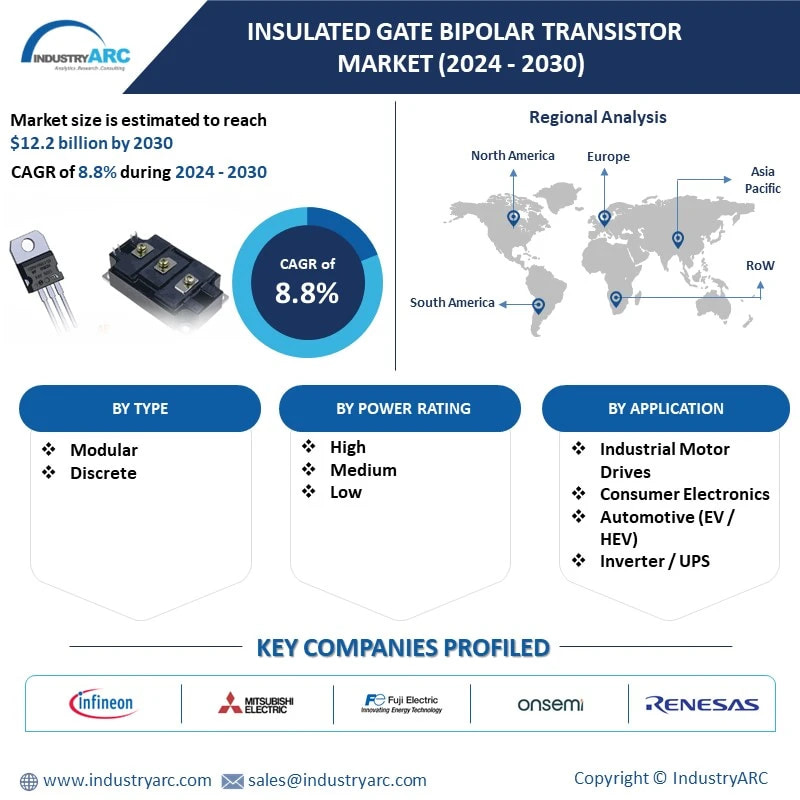
● Modular IGBT Dominated the Market
● Automotive is the fastest growing segment
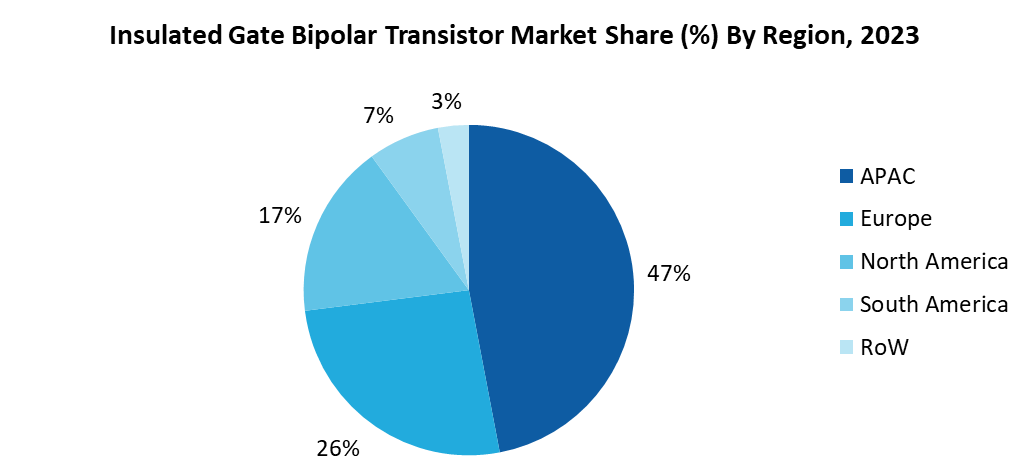
● APAC to Hold Largest Market Share
● Surge in Electric Vehicles (EVs) and Hybrid Electric Vehicles (HEVs)
● Rise of Renewable Energy Sources
● High Initial Investment
Key Market Players:
Scope of Report:
| Report Metric | Details |
|---|---|
|
Base Year Considered |
2023 |
|
Forecast Period |
2024–2030 |
|
CAGR |
8.8% |
|
Market Size in 2030 |
$12.2 billion |
|
Segments Covered |
Type, Power Rating, Application |
|
Geographies Covered |
North America (U.S., Canada and Mexico), Europe (Germany, France, UK, Italy, Spain, Netherlands and Rest of Europe), Asia-Pacific (China, Japan, South Korea, India, Australia & New Zealand and Rest of Asia-Pacific), South America (Brazil, Argentina, Colombia and Rest of South America), Rest of the World (Middle East and Africa). |
Key Market Players |
|
12.2 M&A’s, collaborations, JVs and partnerships
List of Tables
Table1 Insulated Gate Bipolar Transistor Market Overview 2023-2030
Table2 Insulated Gate Bipolar Transistor Market Leader Analysis 2023-2030 (US$)
Table3 Insulated Gate Bipolar Transistor MarketProduct Analysis 2023-2030 (US$)
Table4 Insulated Gate Bipolar Transistor MarketEnd User Analysis 2023-2030 (US$)
Table5 Insulated Gate Bipolar Transistor MarketPatent Analysis 2013-2023* (US$)
Table6 Insulated Gate Bipolar Transistor MarketFinancial Analysis 2023-2030 (US$)
Table7 Insulated Gate Bipolar Transistor Market Driver Analysis 2023-2030 (US$)
Table8 Insulated Gate Bipolar Transistor MarketChallenges Analysis 2023-2030 (US$)
Table9 Insulated Gate Bipolar Transistor MarketConstraint Analysis 2023-2030 (US$)
Table10 Insulated Gate Bipolar Transistor Market Supplier Bargaining Power Analysis 2023-2030 (US$)
Table11 Insulated Gate Bipolar Transistor Market Buyer Bargaining Power Analysis 2023-2030 (US$)
Table12 Insulated Gate Bipolar Transistor Market Threat of Substitutes Analysis 2023-2030 (US$)
Table13 Insulated Gate Bipolar Transistor Market Threat of New Entrants Analysis 2023-2030 (US$)
Table14 Insulated Gate Bipolar Transistor Market Degree of Competition Analysis 2023-2030 (US$)
Table15 Insulated Gate Bipolar Transistor MarketValue Chain Analysis 2023-2030 (US$)
Table16 Insulated Gate Bipolar Transistor MarketPricing Analysis 2023-2030 (US$)
Table17 Insulated Gate Bipolar Transistor MarketOpportunities Analysis 2023-2030 (US$)
Table18 Insulated Gate Bipolar Transistor MarketProduct Life Cycle Analysis 2023-2030 (US$)
Table19 Insulated Gate Bipolar Transistor MarketSupplier Analysis 2023-2030 (US$)
Table20 Insulated Gate Bipolar Transistor MarketDistributor Analysis 2023-2030 (US$)
Table21 Insulated Gate Bipolar Transistor Market Trend Analysis 2023-2030 (US$)
Table22 Insulated Gate Bipolar Transistor Market Size 2023 (US$)
Table23 Insulated Gate Bipolar Transistor Market Forecast Analysis 2023-2030 (US$)
Table24 Insulated Gate Bipolar Transistor Market Sales Forecast Analysis 2023-2030 (Units)
Table25 Insulated Gate Bipolar Transistor Market, Revenue & Volume,By End-Use Industry, 2023-2030 ($)
Table26 Insulated Gate Bipolar Transistor MarketBy End-Use Industry, Revenue & Volume,Consumer Electronics, 2023-2030 ($)
Table27 Insulated Gate Bipolar Transistor MarketBy End-Use Industry, Revenue & Volume,Industrial Motor drives, 2023-2030 ($)
Table28 Insulated Gate Bipolar Transistor MarketBy End-Use Industry, Revenue & Volume,Inverters & UPS, 2023-2030 ($)
Table29 Insulated Gate Bipolar Transistor MarketBy End-Use Industry, Revenue & Volume,Automotive (Electric & Hybrid Vehicles), 2023-2030 ($)
Table30 Insulated Gate Bipolar Transistor MarketBy End-Use Industry, Revenue & Volume,HVAC, 2023-2030 ($)
Table31 North America Insulated Gate Bipolar Transistor Market, Revenue & Volume,By End-Use Industry, 2023-2030 ($)
Table32 South america Insulated Gate Bipolar Transistor Market, Revenue & Volume,By End-Use Industry, 2023-2030 ($)
Table33 Europe Insulated Gate Bipolar Transistor Market, Revenue & Volume,By End-Use Industry, 2023-2030 ($)
Table34 APAC Insulated Gate Bipolar Transistor Market, Revenue & Volume,By End-Use Industry, 2023-2030 ($)
Table35 Middle East & Africa Insulated Gate Bipolar Transistor Market, Revenue & Volume,By End-Use Industry, 2023-2030 ($)
Table36 Russia Insulated Gate Bipolar Transistor Market, Revenue & Volume,By End-Use Industry, 2023-2030 ($)
Table37 Israel Insulated Gate Bipolar Transistor Market, Revenue & Volume,By End-Use Industry, 2023-2030 ($)
Table38 Top Companies 2023 (US$)Insulated Gate Bipolar Transistor Market, Revenue & Volume,,
Table39 Product Launch 2023-2030Insulated Gate Bipolar Transistor Market, Revenue & Volume,,
Table40 Mergers & Acquistions 2023-2030Insulated Gate Bipolar Transistor Market, Revenue & Volume,,
List of Figures
Figure 1 Overview of Insulated Gate Bipolar Transistor Market 2023-2030
Figure 2 Market Share Analysis for Insulated Gate Bipolar Transistor Market 2023 (US$)
Figure 3 Product Comparison in Insulated Gate Bipolar Transistor Market 2023-2030 (US$)
Figure 4 End User Profile for Insulated Gate Bipolar Transistor Market 2023-2030 (US$)
Figure 5 Patent Application and Grant in Insulated Gate Bipolar Transistor Market 2013-2023* (US$)
Figure 6 Top 5 Companies Financial Analysis in Insulated Gate Bipolar Transistor Market 2023-2030 (US$)
Figure 7 Market Entry Strategy in Insulated Gate Bipolar Transistor Market 2023-2030
Figure 8 Ecosystem Analysis in Insulated Gate Bipolar Transistor Market2023
Figure 9 Average Selling Price in Insulated Gate Bipolar Transistor Market 2023-2030
Figure 10 Top Opportunites in Insulated Gate Bipolar Transistor Market 2023-2030
Figure 11 Market Life Cycle Analysis in Insulated Gate Bipolar Transistor Market
Figure 12 GlobalBy End-Use IndustryInsulated Gate Bipolar Transistor Market Revenue, 2023-2030 ($)
Figure 13 Global Insulated Gate Bipolar Transistor Market - By Geography
Figure 14 Global Insulated Gate Bipolar Transistor Market Value & Volume, By Geography, 2023-2030 ($)
Figure 15 Global Insulated Gate Bipolar Transistor Market CAGR, By Geography, 2023-2030 (%)
Figure 16 North America Insulated Gate Bipolar Transistor Market Value & Volume, 2023-2030 ($)
Figure 17 US Insulated Gate Bipolar Transistor Market Value & Volume, 2023-2030 ($)
Figure 18 US GDP and Population, 2023-2030 ($)
Figure 19 US GDP – Composition of 2023, By Sector of Origin
Figure 20 US Export and Import Value & Volume, 2023-2030 ($)
Figure 21 Canada Insulated Gate Bipolar Transistor Market Value & Volume, 2023-2030 ($)
Figure 22 Canada GDP and Population, 2023-2030 ($)
Figure 23 Canada GDP – Composition of 2023, By Sector of Origin
Figure 24 Canada Export and Import Value & Volume, 2023-2030 ($)
Figure 25 Mexico Insulated Gate Bipolar Transistor Market Value & Volume, 2023-2030 ($)
Figure 26 Mexico GDP and Population, 2023-2030 ($)
Figure 27 Mexico GDP – Composition of 2023, By Sector of Origin
Figure 28 Mexico Export and Import Value & Volume, 2023-2030 ($)
Figure 29 South America Insulated Gate Bipolar Transistor MarketSouth America 3D Printing Market Value & Volume, 2023-2030 ($)
Figure 30 Brazil Insulated Gate Bipolar Transistor Market Value & Volume, 2023-2030 ($)
Figure 31 Brazil GDP and Population, 2023-2030 ($)
Figure 32 Brazil GDP – Composition of 2023, By Sector of Origin
Figure 33 Brazil Export and Import Value & Volume, 2023-2030 ($)
Figure 34 Venezuela Insulated Gate Bipolar Transistor Market Value & Volume, 2023-2030 ($)
Figure 35 Venezuela GDP and Population, 2023-2030 ($)
Figure 36 Venezuela GDP – Composition of 2023, By Sector of Origin
Figure 37 Venezuela Export and Import Value & Volume, 2023-2030 ($)
Figure 38 Argentina Insulated Gate Bipolar Transistor Market Value & Volume, 2023-2030 ($)
Figure 39 Argentina GDP and Population, 2023-2030 ($)
Figure 40 Argentina GDP – Composition of 2023, By Sector of Origin
Figure 41 Argentina Export and Import Value & Volume, 2023-2030 ($)
Figure 42 Ecuador Insulated Gate Bipolar Transistor Market Value & Volume, 2023-2030 ($)
Figure 43 Ecuador GDP and Population, 2023-2030 ($)
Figure 44 Ecuador GDP – Composition of 2023, By Sector of Origin
Figure 45 Ecuador Export and Import Value & Volume, 2023-2030 ($)
Figure 46 Peru Insulated Gate Bipolar Transistor Market Value & Volume, 2023-2030 ($)
Figure 47 Peru GDP and Population, 2023-2030 ($)
Figure 48 Peru GDP – Composition of 2023, By Sector of Origin
Figure 49 Peru Export and Import Value & Volume, 2023-2030 ($)
Figure 50 Colombia Insulated Gate Bipolar Transistor Market Value & Volume, 2023-2030 ($)
Figure 51 Colombia GDP and Population, 2023-2030 ($)
Figure 52 Colombia GDP – Composition of 2023, By Sector of Origin
Figure 53 Colombia Export and Import Value & Volume, 2023-2030 ($)
Figure 54 Costa Rica Insulated Gate Bipolar Transistor MarketCosta Rica 3D Printing Market Value & Volume, 2023-2030 ($)
Figure 55 Costa Rica GDP and Population, 2023-2030 ($)
Figure 56 Costa Rica GDP – Composition of 2023, By Sector of Origin
Figure 57 Costa Rica Export and Import Value & Volume, 2023-2030 ($)
Figure 58 Europe Insulated Gate Bipolar Transistor Market Value & Volume, 2023-2030 ($)
Figure 59 U.K Insulated Gate Bipolar Transistor Market Value & Volume, 2023-2030 ($)
Figure 60 U.K GDP and Population, 2023-2030 ($)
Figure 61 U.K GDP – Composition of 2023, By Sector of Origin
Figure 62 U.K Export and Import Value & Volume, 2023-2030 ($)
Figure 63 Germany Insulated Gate Bipolar Transistor Market Value & Volume, 2023-2030 ($)
Figure 64 Germany GDP and Population, 2023-2030 ($)
Figure 65 Germany GDP – Composition of 2023, By Sector of Origin
Figure 66 Germany Export and Import Value & Volume, 2023-2030 ($)
Figure 67 Italy Insulated Gate Bipolar Transistor Market Value & Volume, 2023-2030 ($)
Figure 68 Italy GDP and Population, 2023-2030 ($)
Figure 69 Italy GDP – Composition of 2023, By Sector of Origin
Figure 70 Italy Export and Import Value & Volume, 2023-2030 ($)
Figure 71 France Insulated Gate Bipolar Transistor Market Value & Volume, 2023-2030 ($)
Figure 72 France GDP and Population, 2023-2030 ($)
Figure 73 France GDP – Composition of 2023, By Sector of Origin
Figure 74 France Export and Import Value & Volume, 2023-2030 ($)
Figure 75 Netherlands Insulated Gate Bipolar Transistor Market Value & Volume, 2023-2030 ($)
Figure 76 Netherlands GDP and Population, 2023-2030 ($)
Figure 77 Netherlands GDP – Composition of 2023, By Sector of Origin
Figure 78 Netherlands Export and Import Value & Volume, 2023-2030 ($)
Figure 79 Belgium Insulated Gate Bipolar Transistor Market Value & Volume, 2023-2030 ($)
Figure 80 Belgium GDP and Population, 2023-2030 ($)
Figure 81 Belgium GDP – Composition of 2023, By Sector of Origin
Figure 82 Belgium Export and Import Value & Volume, 2023-2030 ($)
Figure 83 Spain Insulated Gate Bipolar Transistor Market Value & Volume, 2023-2030 ($)
Figure 84 Spain GDP and Population, 2023-2030 ($)
Figure 85 Spain GDP – Composition of 2023, By Sector of Origin
Figure 86 Spain Export and Import Value & Volume, 2023-2030 ($)
Figure 87 Denmark Insulated Gate Bipolar Transistor Market Value & Volume, 2023-2030 ($)
Figure 88 Denmark GDP and Population, 2023-2030 ($)
Figure 89 Denmark GDP – Composition of 2023, By Sector of Origin
Figure 90 Denmark Export and Import Value & Volume, 2023-2030 ($)
Figure 91 APAC Insulated Gate Bipolar Transistor Market Value & Volume, 2023-2030 ($)
Figure 92 China Insulated Gate Bipolar Transistor MarketValue & Volume, 2023-2030
Figure 93 China GDP and Population, 2023-2030 ($)
Figure 94 China GDP – Composition of 2023, By Sector of Origin
Figure 95 China Export and Import Value & Volume, 2023-2030 ($)Insulated Gate Bipolar Transistor MarketChina Export and Import Value & Volume, 2023-2030 ($)
Figure 96 Australia Insulated Gate Bipolar Transistor Market Value & Volume, 2023-2030 ($)
Figure 97 Australia GDP and Population, 2023-2030 ($)
Figure 98 Australia GDP – Composition of 2023, By Sector of Origin
Figure 99 Australia Export and Import Value & Volume, 2023-2030 ($)
Figure 100 South Korea Insulated Gate Bipolar Transistor Market Value & Volume, 2023-2030 ($)
Figure 101 South Korea GDP and Population, 2023-2030 ($)
Figure 102 South Korea GDP – Composition of 2023, By Sector of Origin
Figure 103 South Korea Export and Import Value & Volume, 2023-2030 ($)
Figure 104 India Insulated Gate Bipolar Transistor Market Value & Volume, 2023-2030 ($)
Figure 105 India GDP and Population, 2023-2030 ($)
Figure 106 India GDP – Composition of 2023, By Sector of Origin
Figure 107 India Export and Import Value & Volume, 2023-2030 ($)
Figure 108 Taiwan Insulated Gate Bipolar Transistor MarketTaiwan 3D Printing Market Value & Volume, 2023-2030 ($)
Figure 109 Taiwan GDP and Population, 2023-2030 ($)
Figure 110 Taiwan GDP – Composition of 2023, By Sector of Origin
Figure 111 Taiwan Export and Import Value & Volume, 2023-2030 ($)
Figure 112 Malaysia Insulated Gate Bipolar Transistor MarketMalaysia 3D Printing Market Value & Volume, 2023-2030 ($)
Figure 113 Malaysia GDP and Population, 2023-2030 ($)
Figure 114 Malaysia GDP – Composition of 2023, By Sector of Origin
Figure 115 Malaysia Export and Import Value & Volume, 2023-2030 ($)
Figure 116 Hong Kong Insulated Gate Bipolar Transistor MarketHong Kong 3D Printing Market Value & Volume, 2023-2030 ($)
Figure 117 Hong Kong GDP and Population, 2023-2030 ($)
Figure 118 Hong Kong GDP – Composition of 2023, By Sector of Origin
Figure 119 Hong Kong Export and Import Value & Volume, 2023-2030 ($)
Figure 120 Middle East & Africa Insulated Gate Bipolar Transistor MarketMiddle East & Africa 3D Printing Market Value & Volume, 2023-2030 ($)
Figure 121 Russia Insulated Gate Bipolar Transistor MarketRussia 3D Printing Market Value & Volume, 2023-2030 ($)
Figure 122 Russia GDP and Population, 2023-2030 ($)
Figure 123 Russia GDP – Composition of 2023, By Sector of Origin
Figure 124 Russia Export and Import Value & Volume, 2023-2030 ($)
Figure 125 Israel Insulated Gate Bipolar Transistor Market Value & Volume, 2023-2030 ($)
Figure 126 Israel GDP and Population, 2023-2030 ($)
Figure 127 Israel GDP – Composition of 2023, By Sector of Origin
Figure 128 Israel Export and Import Value & Volume, 2023-2030 ($)
Figure 129 Entropy Share, By Strategies, 2023-2030* (%)Insulated Gate Bipolar Transistor Market
Figure 130 Developments, 2023-2030*Insulated Gate Bipolar Transistor Market
Figure 131 Company 1 Insulated Gate Bipolar Transistor Market Net Revenue, By Years, 2023-2030* ($)
Figure 132 Company 1 Insulated Gate Bipolar Transistor Market Net Revenue Share, By Business segments, 2023 (%)
Figure 133 Company 1 Insulated Gate Bipolar Transistor Market Net Sales Share, By Geography, 2023 (%)
Figure 134 Company 2 Insulated Gate Bipolar Transistor Market Net Revenue, By Years, 2023-2030* ($)
Figure 135 Company 2 Insulated Gate Bipolar Transistor Market Net Revenue Share, By Business segments, 2023 (%)
Figure 136 Company 2 Insulated Gate Bipolar Transistor Market Net Sales Share, By Geography, 2023 (%)
Figure 137 Company 3Insulated Gate Bipolar Transistor Market Net Revenue, By Years, 2023-2030* ($)
Figure 138 Company 3Insulated Gate Bipolar Transistor Market Net Revenue Share, By Business segments, 2023 (%)
Figure 139 Company 3Insulated Gate Bipolar Transistor Market Net Sales Share, By Geography, 2023 (%)
Figure 140 Company 4 Insulated Gate Bipolar Transistor Market Net Revenue, By Years, 2023-2030* ($)
Figure 141 Company 4 Insulated Gate Bipolar Transistor Market Net Revenue Share, By Business segments, 2023 (%)
Figure 142 Company 4 Insulated Gate Bipolar Transistor Market Net Sales Share, By Geography, 2023 (%)
Figure 143 Company 5 Insulated Gate Bipolar Transistor Market Net Revenue, By Years, 2023-2030* ($)
Figure 144 Company 5 Insulated Gate Bipolar Transistor Market Net Revenue Share, By Business segments, 2023 (%)
Figure 145 Company 5 Insulated Gate Bipolar Transistor Market Net Sales Share, By Geography, 2023 (%)
Figure 146 Company 6 Insulated Gate Bipolar Transistor Market Net Revenue, By Years, 2023-2030* ($)
Figure 147 Company 6 Insulated Gate Bipolar Transistor Market Net Revenue Share, By Business segments, 2023 (%)
Figure 148 Company 6 Insulated Gate Bipolar Transistor Market Net Sales Share, By Geography, 2023 (%)
Figure 149 Company 7 Insulated Gate Bipolar Transistor Market Net Revenue, By Years, 2023-2030* ($)
Figure 150 Company 7 Insulated Gate Bipolar Transistor Market Net Revenue Share, By Business segments, 2023 (%)
Figure 151 Company 7 Insulated Gate Bipolar Transistor Market Net Sales Share, By Geography, 2023 (%)
Figure 152 Company 8 Insulated Gate Bipolar Transistor Market Net Revenue, By Years, 2023-2030* ($)
Figure 153 Company 8 Insulated Gate Bipolar Transistor Market Net Revenue Share, By Business segments, 2023 (%)
Figure 154 Company 8 Insulated Gate Bipolar Transistor Market Net Sales Share, By Geography, 2023 (%)
Figure 155 Company 9 Insulated Gate Bipolar Transistor Market Net Revenue, By Years, 2023-2030* ($)
Figure 156 Company 9 Insulated Gate Bipolar Transistor Market Net Revenue Share, By Business segments, 2023 (%)
Figure 157 Company 9 Insulated Gate Bipolar Transistor Market Net Sales Share, By Geography, 2023 (%)
Figure 158 Company 10 Insulated Gate Bipolar Transistor Market Net Revenue, By Years, 2023-2030* ($)
Figure 159 Company 10 Insulated Gate Bipolar Transistor Market Net Revenue Share, By Business segments, 2023 (%)
Figure 160 Company 10 Insulated Gate Bipolar Transistor Market Net Sales Share, By Geography, 2023 (%)
Figure 161 Company 11 Insulated Gate Bipolar Transistor Market Net Revenue, By Years, 2023-2030* ($)
Figure 162 Company 11 Insulated Gate Bipolar Transistor Market Net Revenue Share, By Business segments, 2023 (%)
Figure 163 Company 11 Insulated Gate Bipolar Transistor Market Net Sales Share, By Geography, 2023 (%)
Figure 164 Company 12 Insulated Gate Bipolar Transistor Market Net Revenue, By Years, 2023-2030* ($)
Figure 165 Company 12 Insulated Gate Bipolar Transistor Market Net Revenue Share, By Business segments, 2023 (%)
Figure 166 Company 12 Insulated Gate Bipolar Transistor Market Net Sales Share, By Geography, 2023 (%)
Figure 167 Company 13Insulated Gate Bipolar Transistor Market Net Revenue, By Years, 2023-2030* ($)
Figure 168 Company 13Insulated Gate Bipolar Transistor Market Net Revenue Share, By Business segments, 2023 (%)
Figure 169 Company 13Insulated Gate Bipolar Transistor Market Net Sales Share, By Geography, 2023 (%)
Figure 170 Company 14 Insulated Gate Bipolar Transistor Market Net Revenue, By Years, 2023-2030* ($)
Figure 171 Company 14 Insulated Gate Bipolar Transistor Market Net Revenue Share, By Business segments, 2023 (%)
Figure 172 Company 14 Insulated Gate Bipolar Transistor Market Net Sales Share, By Geography, 2023 (%)
Figure 173 Company 15 Insulated Gate Bipolar Transistor Market Net Revenue, By Years, 2023-2030* ($)
Figure 174 Company 15 Insulated Gate Bipolar Transistor Market Net Revenue Share, By Business segments, 2023 (%)
Figure 175 Company 15 Insulated Gate Bipolar Transistor Market Net Sales Share, By Geography, 2023 (%)
The Insulated Gate Bipolar Transistor Market is projected to grow at a CAGR of 8.8% during the forecast period 2024-2030.
Global Insulated Gate Bipolar Transistor Market size is estimated to be $6.8 billion in 2023 and is projected to reach $12.2 billion by 2030.
The leading players in the Insulated Gate Bipolar Transistor Market are Infineon Technologies AG, Mitsubishi Electric Corporation, Fuji Electric Co., Ltd., ON Semiconductor Corporation, Renesas Electronics Corporation, and Others.
Rapid market expansion and Technological advancements are the major trends in Insulated Gate Bipolar Transistor Market.
Surge of EVs & HEVs and Rise of renewable energy resources are expected to drive the growth of Insulated Gate Bipolar Transistor market. New applications and Demand for higher efficiency to create growth opportunities in the market.