 Email
Email Print
Print


Software Defined Radios Market - Forecast(2025 - 2031)
Software Defined Radio (SDR) is a type of radio communication system where software on embedded system or personal computer is used for communication instead of implementing hardware such as filters, amplifiers, mixers, detectors, demodulators and modulators, among others. In a SDR the data from a source is converted into digital format, the remaining activities are carried out with the help of software driven automated functions. Globally demand for software defined radios is being driven by military modernization programs of various countries and growing number of digital service users. However, integration of the various sub systems is a key for software defined radios market.
This report identifies the global software defined radios market size in for the year 2014-2016, and forecast of the same for year 2021. It also highlights the potential growth opportunities in the coming years, while also reviewing the market drivers, restraints, growth indicators, challenges, market dynamics, competitive landscape, and other key aspects with respect to software defined radios market.
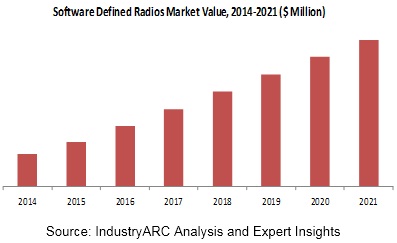
Geographically, North America dominated the global software defined radios market, and Asia Pacific is projected to have the fastest growth, owing to military modernization programs of various countries in this region. Defence had the largest market in 2015 among all application; it constitutes 80% of the software defined radios market.
This report segments global software defined ratio market on the basis of type, end-user and regional market as follows:
Sample companies profiled in this report are:
This report identifies the global software defined radios market size in for the year 2014-2016, and forecast of the same for year 2021. It also highlights the potential growth opportunities in the coming years, while also reviewing the market drivers, restraints, growth indicators, challenges, market dynamics, competitive landscape, and other key aspects with respect to software defined radios market.
Geographically, North America dominated the global software defined radios market, and Asia Pacific is projected to have the fastest growth, owing to military modernization programs of various countries in this region. Defence had the largest market in 2015 among all application; it constitutes 80% of the software defined radios market.
This report segments global software defined ratio market on the basis of type, end-user and regional market as follows:
- Global Software Defined Radios Market, By Type (2014-2021): Ideal Software Defined Radio, Baseband Software Defined Radio (BBSDR), and High Frequency Software Defined Radio (HFSDR)
- The report is also segmented on the basis of end-use industry in which software defined radios are being used as follow: Defence, Commercial, Homeland Security Segments, and Others
- This report has been further segmented into major regions, which includes detailed analysis of each region such as: North America, Europe, Asia-Pacific (APAC), and Rest of the World (RoW) covering all the major country level markets in each of the region
Sample companies profiled in this report are:
- BAE Systems Plc
- Datasoft Corporation
- ITT Corporation
- L3 Communications Corporation
- Elbit Systems Ltd
- 10+.
1. Software Defined Radios Market - Overview
1.1. Definitions and Scope
2. Software Defined Radios Market - Executive summary
2.1. Market Revenue, Market Size and Key Trends by Company
2.2. Key Trends by type of Application
2.3. Key Trends segmented by Geography
3. Software Defined Radios Market
3.1. Comparative analysis
3.1.1. Product Benchmarking - Top 10 companies
3.1.2. Top 5 Financials Analysis
3.1.3. Market Value split by Top 10 companies
3.1.4. Patent Analysis - Top 10 companies
3.1.5. Pricing Analysis
4. Software Defined Radios Market – Startup companies Scenario Premium
4.1. Top 10 startup company Analysis by
4.1.1. Investment
4.1.2. Revenue
4.1.3. Market Shares
4.1.4. Market Size and Application Analysis
4.1.5. Venture Capital and Funding Scenario
5. Software Defined Radios Market – Industry Market Entry Scenario Premium
5.1. Regulatory Framework Overview
5.2. New Business and Ease of Doing business index
5.3. Case studies of successful ventures
5.4. Customer Analysis – Top 10 companies
6. Software Defined Radios Market Forces
6.1. Drivers
6.2. Constraints
6.3. Challenges
6.4. Porters five force model
6.4.1. Bargaining power of suppliers
6.4.2. Bargaining powers of customers
6.4.3. Threat of new entrants
6.4.4. Rivalry among existing players
6.4.5. Threat of substitutes
7. Software Defined Radios Market -Strategic analysis
7.1. Value chain analysis
7.2. Opportunities analysis
7.3. Product life cycle
7.4. Suppliers and distributors Market Share
8. Software Defined Radios Market – By TX Vs RX (Market Size -$Million / $Billion)
8.1. Market Size and Market Share Analysis
8.2. Application Revenue and Trend Research
8.3. Product Segment Analysis
8.3.1. Transmitter
8.3.2. Receiver
9. Software Defined Radios Market – By Equipment (Market Size -$Million / $Billion)
9.1. Fixed
9.1.1. Infrastructure
9.2. Portable
9.3. Mobile / Handheld
9.4. Wearable
10. Software Defined Radios Market – By Protocols (Market Size -$Million / $Billion)
10.1. Bluetooth
10.2. CDMA
10.3. GSM
10.4. LTE
10.5. Wi-Fi
11. Software Defined Radios Market – By Frequency Range (Market Size -$Million / $Billion)
11.1. High Frequency
11.2. Ultra-High Frequency
11.3. Very High Frequency
11.4. Other Frequency Ranges
12. Software Defined Radios Market – Futuristic Applications (Market Size -$Million / $Billion)
12.1. Biological Weapon Detector
12.2. Chemical Detector
12.3. Nuclear Detector
12.4. Area Mapper
12.5. Situational Awareness
12.6. Others
13. Software Defined Radios– By End Use Industry(Market Size -$Million / $Billion)
13.1. Segment type Size and Market Share Analysis
13.2. Application Revenue and Trends by type of Application
13.3. Application Segment Analysis by Type
13.3.1. Commercial
13.3.2. Homeland Security
13.3.3. Cellular
13.3.3.1. Smart Phones
13.3.3.2. Feature Phones
13.3.3.3. Basic Phones
13.3.3.4. Laptop Cards
13.3.3.5. Others
13.3.4. Defense
13.3.4.1. Ground Vehicle
13.3.4.2. Rotary Wing Aircraft
13.3.4.3. UAV
13.3.4.4. Others
13.3.5. Automotive
13.3.5.1. Navigation
13.3.5.2. Hands-Free Phone Control
13.3.5.3. Telematics
13.3.5.4. Others
13.3.6. Aerospace
13.3.7. Public Sector
13.3.7.1. Police
13.3.7.2. Fire
13.3.7.3. Others
13.3.8. Others
14. Software Defined Radios - By Geography (Market Size -$Million / $Billion)
14.1. Software Defined Radios Market - North America Segment Research
14.2. North America Market Research (Million / $Billion)
14.2.1. Segment type Size and Market Size Analysis
14.2.2. Revenue and Trends
14.2.3. Application Revenue and Trends by type of Application
14.2.4. Company Revenue and Product Analysis
14.2.5. North America Product type and Application Market Size
14.2.5.1. U.S.
14.2.5.2. Canada
14.2.5.3. Mexico
14.2.5.4. Rest of North America
14.3. Software Defined Radios - South America Segment Research
14.4. South America Market Research (Market Size -$Million / $Billion)
14.4.1. Segment type Size and Market Size Analysis
14.4.2. Revenue and Trends
14.4.3. Application Revenue and Trends by type of Application
14.4.4. Company Revenue and Product Analysis
14.4.5. South America Product type and Application Market Size
14.4.5.1. Brazil
14.4.5.2. Venezuela
14.4.5.3. Argentina
14.4.5.4. Ecuador
14.4.5.5. Peru
14.4.5.6. Colombia
14.4.5.7. Costa Rica
14.4.5.8. Rest of South America
14.5. Software Defined Radios - Europe Segment Research
14.6. Europe Market Research (Market Size -$Million / $Billion)
14.6.1. Segment type Size and Market Size Analysis
14.6.2. Revenue and Trends
14.6.3. Application Revenue and Trends by type of Application
14.6.4. Company Revenue and Product Analysis
14.6.5. Europe Segment Product type and Application Market Size
14.6.5.1. U.K
14.6.5.2. Germany
14.6.5.3. Italy
14.6.5.4. France
14.6.5.5. Netherlands
14.6.5.6. Belgium
14.6.5.7. Spain
14.6.5.8. Denmark
14.6.5.9. Rest of Europe
14.7. Software Defined Radios – APAC Segment Research
14.8. APAC Market Research (Market Size -$Million / $Billion)
14.8.1. Segment type Size and Market Size Analysis
14.8.2. Revenue and Trends
14.8.3. Application Revenue and Trends by type of Application
14.8.4. Company Revenue and Product Analysis
14.8.5. APAC Segment – Product type and Application Market Size
14.8.5.1. China
14.8.5.2. Australia
14.8.5.3. Japan
14.8.5.4. South Korea
14.8.5.5. India
14.8.5.6. Taiwan
14.8.5.7. Malaysia
15. Software Defined Radios Market - Entropy
15.1. New product launches
15.2. M&A's, collaborations, JVs and partnerships
16. Software Defined Radios Market – Industry / Segment Competition landscape Premium
16.1. Market Share Analysis
16.1.1. Market Share by Country- Top companies
16.1.2. Market Share by Region- Top 10 companies
16.1.3. Market Share by type of Application – Top 10 companies
16.1.4. Market Share by type of Product / Product category- Top 10 companies
16.1.5. Market Share at global level- Top 10 companies
16.1.6. Best Practises for companies
17. Software Defined Radios Market – Key Company List by Country Premium
18. Software Defined Radios Market Company Analysis
18.1. Market Share, Company Revenue, Products, M&A, Developments
18.2. BAE Systems Plc
18.3. Datasoft Corporation
18.4. ITT Corporation
18.5. L3 Communications Corporation
18.6. Elbit Systems Ltd
18.7. Company 6
18.8. Company 7
18.9. Company 8
18.10. Company 9
18.11. Company 10 and more
"*Financials would be provided on a best efforts basis for private companies"
19. Software Defined Radios Market -Appendix
19.1. Abbreviations
19.2. Sources
20. Software Defined Radios Market -Methodology Premium
20.1. Research Methodology
20.1.1. Company Expert Interviews
20.1.2. Industry Databases
20.1.3. Associations
20.1.4. Company News
20.1.5. Company Annual Reports
20.1.6. Application Trends
20.1.7. New Products and Product database
20.1.8. Company Transcripts
20.1.9. R&D Trends
20.1.10. Key Opinion Leaders Interviews
20.1.11. Supply and Demand Trends
List of Tables
Table 1 Software Defined Radios Market Overview 2023-2030
Table 2 Software Defined Radios Market Leader Analysis 2023-2030 (US$)
Table 3 Software Defined Radios MarketProduct Analysis 2023-2030 (US$)
Table 4 Software Defined Radios MarketEnd User Analysis 2023-2030 (US$)
Table 5 Software Defined Radios MarketPatent Analysis 2013-2023* (US$)
Table 6 Software Defined Radios MarketFinancial Analysis 2023-2030 (US$)
Table 7 Software Defined Radios Market Driver Analysis 2023-2030 (US$)
Table 8 Software Defined Radios MarketChallenges Analysis 2023-2030 (US$)
Table 9 Software Defined Radios MarketConstraint Analysis 2023-2030 (US$)
Table 10 Software Defined Radios Market Supplier Bargaining Power Analysis 2023-2030 (US$)
Table 11 Software Defined Radios Market Buyer Bargaining Power Analysis 2023-2030 (US$)
Table 12 Software Defined Radios Market Threat of Substitutes Analysis 2023-2030 (US$)
Table 13 Software Defined Radios Market Threat of New Entrants Analysis 2023-2030 (US$)
Table 14 Software Defined Radios Market Degree of Competition Analysis 2023-2030 (US$)
Table 15 Software Defined Radios MarketValue Chain Analysis 2023-2030 (US$)
Table 16 Software Defined Radios MarketPricing Analysis 2023-2030 (US$)
Table 17 Software Defined Radios MarketOpportunities Analysis 2023-2030 (US$)
Table 18 Software Defined Radios MarketProduct Life Cycle Analysis 2023-2030 (US$)
Table 19 Software Defined Radios MarketSupplier Analysis 2023-2030 (US$)
Table 20 Software Defined Radios MarketDistributor Analysis 2023-2030 (US$)
Table 21 Software Defined Radios Market Trend Analysis 2023-2030 (US$)
Table 22 Software Defined Radios Market Size 2023 (US$)
Table 23 Software Defined Radios Market Forecast Analysis 2023-2030 (US$)
Table 24 Software Defined Radios Market Sales Forecast Analysis 2023-2030 (Units)
Table 25 Software Defined Radios Market, Revenue & Volume,By Type, 2023-2030 ($)
Table 26 Software Defined Radios MarketBy Type, Revenue & Volume,By Ideal Software Defined Radio, 2023-2030 ($)
Table 27 Software Defined Radios MarketBy Type, Revenue & Volume,By Baseband Software Defined Radio (BBSDR), 2023-2030 ($)
Table 28 Software Defined Radios MarketBy Type, Revenue & Volume,By High Frequency Software Defined Radio (HFSDR), 2023-2030 ($)
Table 29 Software Defined Radios Market, Revenue & Volume,By end –user Industry, 2023-2030 ($)
Table 30 Software Defined Radios MarketBy end –user Industry, Revenue & Volume,By Defence, 2023-2030 ($)
Table 31 Software Defined Radios MarketBy end –user Industry, Revenue & Volume,By Commercial, 2023-2030 ($)
Table 32 Software Defined Radios MarketBy end –user Industry, Revenue & Volume,By Homeland Security Segments, 2023-2030 ($)
Table 33 North America Software Defined Radios Market, Revenue & Volume,By Type, 2023-2030 ($)
Table 34 North America Software Defined Radios Market, Revenue & Volume,By end –user Industry, 2023-2030 ($)
Table 35 South america Software Defined Radios Market, Revenue & Volume,By Type, 2023-2030 ($)
Table 36 South america Software Defined Radios Market, Revenue & Volume,By end –user Industry, 2023-2030 ($)
Table 37 Europe Software Defined Radios Market, Revenue & Volume,By Type, 2023-2030 ($)
Table 38 Europe Software Defined Radios Market, Revenue & Volume,By end –user Industry, 2023-2030 ($)
Table 39 APAC Software Defined Radios Market, Revenue & Volume,By Type, 2023-2030 ($)
Table 40 APAC Software Defined Radios Market, Revenue & Volume,By end –user Industry, 2023-2030 ($)
Table 41 Middle East & Africa Software Defined Radios Market, Revenue & Volume,By Type, 2023-2030 ($)
Table 42 Middle East & Africa Software Defined Radios Market, Revenue & Volume,By end –user Industry, 2023-2030 ($)
Table 43 Russia Software Defined Radios Market, Revenue & Volume,By Type, 2023-2030 ($)
Table 44 Russia Software Defined Radios Market, Revenue & Volume,By end –user Industry, 2023-2030 ($)
Table 45 Israel Software Defined Radios Market, Revenue & Volume,By Type, 2023-2030 ($)
Table 46 Israel Software Defined Radios Market, Revenue & Volume,By end –user Industry, 2023-2030 ($)
Table 47 Top Companies 2023 (US$)Software Defined Radios Market, Revenue & Volume,,
Table 48 Product Launch 2023-2030Software Defined Radios Market, Revenue & Volume,,
Table 49 Mergers & Acquistions 2023-2030Software Defined Radios Market, Revenue & Volume,,
List of Figures
Figure 1 Overview of Software Defined Radios Market 2023-2030
Figure 2 Market Share Analysis for Software Defined Radios Market 2023 (US$)
Figure 3 Product Comparison in Software Defined Radios Market 2023-2030 (US$)
Figure 4 End User Profile for Software Defined Radios Market 2023-2030 (US$)
Figure 5 Patent Application and Grant in Software Defined Radios Market 2013-2023* (US$)
Figure 6 Top 5 Companies Financial Analysis in Software Defined Radios Market 2023-2030 (US$)
Figure 7 Market Entry Strategy in Software Defined Radios Market 2023-2030
Figure 8 Ecosystem Analysis in Software Defined Radios Market2023
Figure 9 Average Selling Price in Software Defined Radios Market 2023-2030
Figure 10 Top Opportunites in Software Defined Radios Market 2023-2030
Figure 11 Market Life Cycle Analysis in Software Defined Radios Market
Figure 12 GlobalBy TypeSoftware Defined Radios Market Revenue, 2023-2030 ($)
Figure 13 GlobalBy end –user IndustrySoftware Defined Radios Market Revenue, 2023-2030 ($)
Figure 14 Global Software Defined Radios Market - By Geography
Figure 15 Global Software Defined Radios Market Value & Volume, By Geography, 2023-2030 ($)
Figure 16 Global Software Defined Radios Market CAGR, By Geography, 2023-2030 (%)
Figure 17 North America Software Defined Radios Market Value & Volume, 2023-2030 ($)
Figure 18 US Software Defined Radios Market Value & Volume, 2023-2030 ($)
Figure 19 US GDP and Population, 2023-2030 ($)
Figure 20 US GDP – Composition of 2023, By Sector of Origin
Figure 21 US Export and Import Value & Volume, 2023-2030 ($)
Figure 22 Canada Software Defined Radios Market Value & Volume, 2023-2030 ($)
Figure 23 Canada GDP and Population, 2023-2030 ($)
Figure 24 Canada GDP – Composition of 2023, By Sector of Origin
Figure 25 Canada Export and Import Value & Volume, 2023-2030 ($)
Figure 26 Mexico Software Defined Radios Market Value & Volume, 2023-2030 ($)
Figure 27 Mexico GDP and Population, 2023-2030 ($)
Figure 28 Mexico GDP – Composition of 2023, By Sector of Origin
Figure 29 Mexico Export and Import Value & Volume, 2023-2030 ($)
Figure 30 South America Software Defined Radios MarketSouth America 3D Printing Market Value & Volume, 2023-2030 ($)
Figure 31 Brazil Software Defined Radios Market Value & Volume, 2023-2030 ($)
Figure 32 Brazil GDP and Population, 2023-2030 ($)
Figure 33 Brazil GDP – Composition of 2023, By Sector of Origin
Figure 34 Brazil Export and Import Value & Volume, 2023-2030 ($)
Figure 35 Venezuela Software Defined Radios Market Value & Volume, 2023-2030 ($)
Figure 36 Venezuela GDP and Population, 2023-2030 ($)
Figure 37 Venezuela GDP – Composition of 2023, By Sector of Origin
Figure 38 Venezuela Export and Import Value & Volume, 2023-2030 ($)
Figure 39 Argentina Software Defined Radios Market Value & Volume, 2023-2030 ($)
Figure 40 Argentina GDP and Population, 2023-2030 ($)
Figure 41 Argentina GDP – Composition of 2023, By Sector of Origin
Figure 42 Argentina Export and Import Value & Volume, 2023-2030 ($)
Figure 43 Ecuador Software Defined Radios Market Value & Volume, 2023-2030 ($)
Figure 44 Ecuador GDP and Population, 2023-2030 ($)
Figure 45 Ecuador GDP – Composition of 2023, By Sector of Origin
Figure 46 Ecuador Export and Import Value & Volume, 2023-2030 ($)
Figure 47 Peru Software Defined Radios Market Value & Volume, 2023-2030 ($)
Figure 48 Peru GDP and Population, 2023-2030 ($)
Figure 49 Peru GDP – Composition of 2023, By Sector of Origin
Figure 50 Peru Export and Import Value & Volume, 2023-2030 ($)
Figure 51 Colombia Software Defined Radios Market Value & Volume, 2023-2030 ($)
Figure 52 Colombia GDP and Population, 2023-2030 ($)
Figure 53 Colombia GDP – Composition of 2023, By Sector of Origin
Figure 54 Colombia Export and Import Value & Volume, 2023-2030 ($)
Figure 55 Costa Rica Software Defined Radios MarketCosta Rica 3D Printing Market Value & Volume, 2023-2030 ($)
Figure 56 Costa Rica GDP and Population, 2023-2030 ($)
Figure 57 Costa Rica GDP – Composition of 2023, By Sector of Origin
Figure 58 Costa Rica Export and Import Value & Volume, 2023-2030 ($)
Figure 59 Europe Software Defined Radios Market Value & Volume, 2023-2030 ($)
Figure 60 U.K Software Defined Radios Market Value & Volume, 2023-2030 ($)
Figure 61 U.K GDP and Population, 2023-2030 ($)
Figure 62 U.K GDP – Composition of 2023, By Sector of Origin
Figure 63 U.K Export and Import Value & Volume, 2023-2030 ($)
Figure 64 Germany Software Defined Radios Market Value & Volume, 2023-2030 ($)
Figure 65 Germany GDP and Population, 2023-2030 ($)
Figure 66 Germany GDP – Composition of 2023, By Sector of Origin
Figure 67 Germany Export and Import Value & Volume, 2023-2030 ($)
Figure 68 Italy Software Defined Radios Market Value & Volume, 2023-2030 ($)
Figure 69 Italy GDP and Population, 2023-2030 ($)
Figure 70 Italy GDP – Composition of 2023, By Sector of Origin
Figure 71 Italy Export and Import Value & Volume, 2023-2030 ($)
Figure 72 France Software Defined Radios Market Value & Volume, 2023-2030 ($)
Figure 73 France GDP and Population, 2023-2030 ($)
Figure 74 France GDP – Composition of 2023, By Sector of Origin
Figure 75 France Export and Import Value & Volume, 2023-2030 ($)
Figure 76 Netherlands Software Defined Radios Market Value & Volume, 2023-2030 ($)
Figure 77 Netherlands GDP and Population, 2023-2030 ($)
Figure 78 Netherlands GDP – Composition of 2023, By Sector of Origin
Figure 79 Netherlands Export and Import Value & Volume, 2023-2030 ($)
Figure 80 Belgium Software Defined Radios Market Value & Volume, 2023-2030 ($)
Figure 81 Belgium GDP and Population, 2023-2030 ($)
Figure 82 Belgium GDP – Composition of 2023, By Sector of Origin
Figure 83 Belgium Export and Import Value & Volume, 2023-2030 ($)
Figure 84 Spain Software Defined Radios Market Value & Volume, 2023-2030 ($)
Figure 85 Spain GDP and Population, 2023-2030 ($)
Figure 86 Spain GDP – Composition of 2023, By Sector of Origin
Figure 87 Spain Export and Import Value & Volume, 2023-2030 ($)
Figure 88 Denmark Software Defined Radios Market Value & Volume, 2023-2030 ($)
Figure 89 Denmark GDP and Population, 2023-2030 ($)
Figure 90 Denmark GDP – Composition of 2023, By Sector of Origin
Figure 91 Denmark Export and Import Value & Volume, 2023-2030 ($)
Figure 92 APAC Software Defined Radios Market Value & Volume, 2023-2030 ($)
Figure 93 China Software Defined Radios MarketValue & Volume, 2023-2030
Figure 94 China GDP and Population, 2023-2030 ($)
Figure 95 China GDP – Composition of 2023, By Sector of Origin
Figure 96 China Export and Import Value & Volume, 2023-2030 ($)Software Defined Radios MarketChina Export and Import Value & Volume, 2023-2030 ($)
Figure 97 Australia Software Defined Radios Market Value & Volume, 2023-2030 ($)
Figure 98 Australia GDP and Population, 2023-2030 ($)
Figure 99 Australia GDP – Composition of 2023, By Sector of Origin
Figure 100 Australia Export and Import Value & Volume, 2023-2030 ($)
Figure 101 South Korea Software Defined Radios Market Value & Volume, 2023-2030 ($)
Figure 102 South Korea GDP and Population, 2023-2030 ($)
Figure 103 South Korea GDP – Composition of 2023, By Sector of Origin
Figure 104 South Korea Export and Import Value & Volume, 2023-2030 ($)
Figure 105 India Software Defined Radios Market Value & Volume, 2023-2030 ($)
Figure 106 India GDP and Population, 2023-2030 ($)
Figure 107 India GDP – Composition of 2023, By Sector of Origin
Figure 108 India Export and Import Value & Volume, 2023-2030 ($)
Figure 109 Taiwan Software Defined Radios MarketTaiwan 3D Printing Market Value & Volume, 2023-2030 ($)
Figure 110 Taiwan GDP and Population, 2023-2030 ($)
Figure 111 Taiwan GDP – Composition of 2023, By Sector of Origin
Figure 112 Taiwan Export and Import Value & Volume, 2023-2030 ($)
Figure 113 Malaysia Software Defined Radios MarketMalaysia 3D Printing Market Value & Volume, 2023-2030 ($)
Figure 114 Malaysia GDP and Population, 2023-2030 ($)
Figure 115 Malaysia GDP – Composition of 2023, By Sector of Origin
Figure 116 Malaysia Export and Import Value & Volume, 2023-2030 ($)
Figure 117 Hong Kong Software Defined Radios MarketHong Kong 3D Printing Market Value & Volume, 2023-2030 ($)
Figure 118 Hong Kong GDP and Population, 2023-2030 ($)
Figure 119 Hong Kong GDP – Composition of 2023, By Sector of Origin
Figure 120 Hong Kong Export and Import Value & Volume, 2023-2030 ($)
Figure 121 Middle East & Africa Software Defined Radios MarketMiddle East & Africa 3D Printing Market Value & Volume, 2023-2030 ($)
Figure 122 Russia Software Defined Radios MarketRussia 3D Printing Market Value & Volume, 2023-2030 ($)
Figure 123 Russia GDP and Population, 2023-2030 ($)
Figure 124 Russia GDP – Composition of 2023, By Sector of Origin
Figure 125 Russia Export and Import Value & Volume, 2023-2030 ($)
Figure 126 Israel Software Defined Radios Market Value & Volume, 2023-2030 ($)
Figure 127 Israel GDP and Population, 2023-2030 ($)
Figure 128 Israel GDP – Composition of 2023, By Sector of Origin
Figure 129 Israel Export and Import Value & Volume, 2023-2030 ($)
Figure 130 Entropy Share, By Strategies, 2023-2030* (%)Software Defined Radios Market
Figure 131 Developments, 2023-2030*Software Defined Radios Market
Figure 132 Company 1 Software Defined Radios Market Net Revenue, By Years, 2023-2030* ($)
Figure 133 Company 1 Software Defined Radios Market Net Revenue Share, By Business segments, 2023 (%)
Figure 134 Company 1 Software Defined Radios Market Net Sales Share, By Geography, 2023 (%)
Figure 135 Company 2 Software Defined Radios Market Net Revenue, By Years, 2023-2030* ($)
Figure 136 Company 2 Software Defined Radios Market Net Revenue Share, By Business segments, 2023 (%)
Figure 137 Company 2 Software Defined Radios Market Net Sales Share, By Geography, 2023 (%)
Figure 138 Company 3Software Defined Radios Market Net Revenue, By Years, 2023-2030* ($)
Figure 139 Company 3Software Defined Radios Market Net Revenue Share, By Business segments, 2023 (%)
Figure 140 Company 3Software Defined Radios Market Net Sales Share, By Geography, 2023 (%)
Figure 141 Company 4 Software Defined Radios Market Net Revenue, By Years, 2023-2030* ($)
Figure 142 Company 4 Software Defined Radios Market Net Revenue Share, By Business segments, 2023 (%)
Figure 143 Company 4 Software Defined Radios Market Net Sales Share, By Geography, 2023 (%)
Figure 144 Company 5 Software Defined Radios Market Net Revenue, By Years, 2023-2030* ($)
Figure 145 Company 5 Software Defined Radios Market Net Revenue Share, By Business segments, 2023 (%)
Figure 146 Company 5 Software Defined Radios Market Net Sales Share, By Geography, 2023 (%)
Figure 147 Company 6 Software Defined Radios Market Net Revenue, By Years, 2023-2030* ($)
Figure 148 Company 6 Software Defined Radios Market Net Revenue Share, By Business segments, 2023 (%)
Figure 149 Company 6 Software Defined Radios Market Net Sales Share, By Geography, 2023 (%)
Figure 150 Company 7 Software Defined Radios Market Net Revenue, By Years, 2023-2030* ($)
Figure 151 Company 7 Software Defined Radios Market Net Revenue Share, By Business segments, 2023 (%)
Figure 152 Company 7 Software Defined Radios Market Net Sales Share, By Geography, 2023 (%)
Figure 153 Company 8 Software Defined Radios Market Net Revenue, By Years, 2023-2030* ($)
Figure 154 Company 8 Software Defined Radios Market Net Revenue Share, By Business segments, 2023 (%)
Figure 155 Company 8 Software Defined Radios Market Net Sales Share, By Geography, 2023 (%)
Figure 156 Company 9 Software Defined Radios Market Net Revenue, By Years, 2023-2030* ($)
Figure 157 Company 9 Software Defined Radios Market Net Revenue Share, By Business segments, 2023 (%)
Figure 158 Company 9 Software Defined Radios Market Net Sales Share, By Geography, 2023 (%)
Figure 159 Company 10 Software Defined Radios Market Net Revenue, By Years, 2023-2030* ($)
Figure 160 Company 10 Software Defined Radios Market Net Revenue Share, By Business segments, 2023 (%)
Figure 161 Company 10 Software Defined Radios Market Net Sales Share, By Geography, 2023 (%)
Figure 162 Company 11 Software Defined Radios Market Net Revenue, By Years, 2023-2030* ($)
Figure 163 Company 11 Software Defined Radios Market Net Revenue Share, By Business segments, 2023 (%)
Figure 164 Company 11 Software Defined Radios Market Net Sales Share, By Geography, 2023 (%)
Figure 165 Company 12 Software Defined Radios Market Net Revenue, By Years, 2023-2030* ($)
Figure 166 Company 12 Software Defined Radios Market Net Revenue Share, By Business segments, 2023 (%)
Figure 167 Company 12 Software Defined Radios Market Net Sales Share, By Geography, 2023 (%)
Figure 168 Company 13Software Defined Radios Market Net Revenue, By Years, 2023-2030* ($)
Figure 169 Company 13Software Defined Radios Market Net Revenue Share, By Business segments, 2023 (%)
Figure 170 Company 13Software Defined Radios Market Net Sales Share, By Geography, 2023 (%)
Figure 171 Company 14 Software Defined Radios Market Net Revenue, By Years, 2023-2030* ($)
Figure 172 Company 14 Software Defined Radios Market Net Revenue Share, By Business segments, 2023 (%)
Figure 173 Company 14 Software Defined Radios Market Net Sales Share, By Geography, 2023 (%)
Figure 174 Company 15 Software Defined Radios Market Net Revenue, By Years, 2023-2030* ($)
Figure 175 Company 15 Software Defined Radios Market Net Revenue Share, By Business segments, 2023 (%)
Figure 176 Company 15 Software Defined Radios Market Net Sales Share, By Geography, 2023 (%)