 Email
Email Print
Print


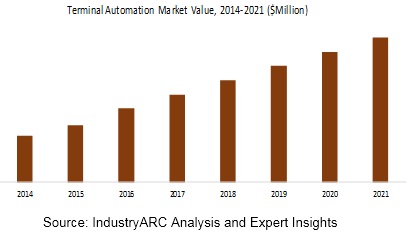
Terminal automation is the process of automating various control systems for operating machinery and equipment in a manufacturing facility without human intervention. Terminal control basically relies on the accurate and reliable process measurements such as level and flow. These systems increase the accuracy while providing data from the start point to the end; along with increasing asset utilization and productivity for minimizing the loss along with meeting the environmental needs.
With the recent inclinations of the government bodies for environmental concerns and the shift towards efficiently optimizing non-renewable resources have amplified the terminal automation market; also, increasing labor cost and enhanced operational efficacy are further fueling terminal automation growth across the globe. The market for terminal automation is set to escalate at a CAGR of 8% during the forecast period 2018-2023
The terminal automation market is scrutinized by segments including by product, by mode, by end user industry, by type and geography. By product the market is segregated into control system and integrated safety system. Control systems are further segmented into DCS, PLCs, Scada, HMI. Integrated safety systems are divided into Process Safety System (PSS), Automatic Tank Gauging (ATG), Preset/Blend Controller and Security System. By mode includes truck, pipeline and marine. By end user industry market is classified as cement, oil & gas chemical and petrochemical. Under the segmentation done by type the market is divided into software, services and hardware. The report also comprises of the region wise study of the global market including Americas, Europe, Asia-Pacific and Rest of the World.
Integrated safety system is forecasted to dominate the market during the forecast period 2018-2023. However, control system product market is estimated to showcase a prominent growth at a CAGR of 5.9% during the same period. Rising need of quality transportation of crude oil products coupled with high volume production in various industries have led the growth of the terminal automation market.
Sample Companies profiled in this report are:
- Intech Process Automation Inc. (U.S.),
- Schneider Electric SE (France),
- ABB Limited (Switzerland),
- Emerson Electric Co. (U.S.),
- Endress+Hauser AG (Switzerland),
- 10+.
1. Terminal Automation Market - Overview
1.1. Introduction
1.2. Market Scope
1.3. Stakeholders
2. Terminal Automation Market - Executive Summary
3. Terminal Automation Market - Landscape
3.1. Market Share Analysis
3.1.1. Market Share Analysis
3.1.1.1. Software
3.1.1.2. Services
3.2. Comparative Analysis
3.2.1. Competitor Benchmarking
3.2.2. Competitor Financial Analysis
3.2.3. Patent Analysis
3.2.4. End-User Profiling
4. Terminal Automation Market - Forces
4.1. Market Drivers
4.1.1. Rising labor cost and aging workforce enhance the growth for automation of terminals
4.1.2. Government regulations and mandates advent of wireless technologies
4.1.3. Increasing investments for brownfield terminals automation
4.1.4. Increase in demand for natural gas and crude oil and expansion of oil terminals
4.2. Market Constraints
4.3. Market Challenges
4.3.1. Low capital expenditure for terminal automation projects
4.3.2. Reduction in crude oil prices impacts the oil and gas terminal automation
4.4. Attractiveness of the Terminal Automation Market
4.4.1. Power of Suppliers
4.4.2. Power of Customers
4.4.3. Threat of New entrants
4.4.4. Threat of Substitution
4.4.5. Degree of Competition
5. Terminal Automation Market- Strategic Analysis
5.1. Value Chain Analysis
5.2. Pricing Analysis
5.2.1. Influence Factor Analysis
5.2.2. Forecast of Prices
5.3. Opportunities Analysis
5.3.1. Cloud & IoT ushers in the future of terminal automation
5.4. Life Cycle Analysis
5.5. Suppliers & Distributers
6. Terminal Automation Market - By Product
6.1. Control System
6.1.1. DCS
6.1.2. PLCs
6.1.3. Scada
6.1.4. HMI
6.2. Integrated Safety System
6.2.1. Process Safety System (PSS)
6.2.2. Automatic Tank Gauging (ATG)
6.2.3. Preset/Blend Controller
6.2.4. Security System
7. Terminal Automation Market - By Mode
7.1. Introduction
7.2. Truck
7.3. Pipeline
7.4. Marine
8. Terminal Automation Market - By End User Industry
8.1. Introduction
8.2. Cement
8.3. Oil & Gas
8.4. Chemical and Petrochemical
9. Terminal Automation Market - By Type
9.1. Software
9.1.1. Terminal Management
9.1.2. Business System Integration
9.1.3. Inventory Management
9.1.4. Transaction Management
9.1.5. SCADA/HMI
9.1.6. Reporting
9.2. Service
9.2.1. Operations
9.2.2. Project Management
9.2.3. Consulting
9.2.4. Commissioning & Checkout
9.2.5. Training
9.3. Hardware
10. Terminal Automation Market - By Geography
10.1. Introduction
10.2. North America
10.2.1. U.S.
10.2.2. Canada
10.2.3. Mexico
10.3. Europe
10.3.1. U.K.
10.3.2. Germany
10.3.3. France
10.3.4. Italy
10.3.5. Spain
10.3.6. Russia
10.3.7. Rest of Europe
10.4. Asia-Pacific
10.4.1. China
10.4.2. India
10.4.3. Japan
10.4.4. South Korea
10.4.5. Rest of APAC
10.5. RoW
10.5.1. Middle East
10.5.2. Africa
10.5.3. South America
11. Terminal Automation Market Entropy
11.1. Introduction
11.2. Most Dominant Strategy
11.3. Mergers, Agreements & Partnerships
11.4. Acquisitions and Others
12. Company Profiles
12.1. Company 1
12.2. Company 2
12.3. Company 3
12.4. Company 4
12.5. Company 5
12.6. Company 6
12.7. Company 7
12.8. Company 8
12.9. Company 9
12.10. Company 10
*More than 10 Companies are profiled in this Research Report*
"*Financials would be provided on a best efforts basis for private companies"
13. Appendix
13.1. Abbreviations
13.2. Sources
13.3. Research Methodology
13.4. Bibliography
13.5. Compilation of Experts
13.6. Disclaimer
List of Tables
Table 1: Terminal Automation Market Overview 2023-2030
Table 2: Terminal Automation Market Leader Analysis 2023-2030 (US$)
Table 3: Terminal Automation Market Product Analysis 2023-2030 (US$)
Table 4: Terminal Automation Market End User Analysis 2023-2030 (US$)
Table 5: Terminal Automation Market Patent Analysis 2013-2023* (US$)
Table 6: Terminal Automation Market Financial Analysis 2023-2030 (US$)
Table 7: Terminal Automation Market Driver Analysis 2023-2030 (US$)
Table 8: Terminal Automation Market Challenges Analysis 2023-2030 (US$)
Table 9: Terminal Automation Market Constraint Analysis 2023-2030 (US$)
Table 10: Terminal Automation Market Supplier Bargaining Power Analysis 2023-2030 (US$)
Table 11: Terminal Automation Market Buyer Bargaining Power Analysis 2023-2030 (US$)
Table 12: Terminal Automation Market Threat of Substitutes Analysis 2023-2030 (US$)
Table 13: Terminal Automation Market Threat of New Entrants Analysis 2023-2030 (US$)
Table 14: Terminal Automation Market Degree of Competition Analysis 2023-2030 (US$)
Table 15: Terminal Automation Market Value Chain Analysis 2023-2030 (US$)
Table 16: Terminal Automation Market Pricing Analysis 2023-2030 (US$)
Table 17: Terminal Automation Market Opportunities Analysis 2023-2030 (US$)
Table 18: Terminal Automation Market Product Life Cycle Analysis 2023-2030 (US$)
Table 19: Terminal Automation Market Supplier Analysis 2023-2030 (US$)
Table 20: Terminal Automation Market Distributor Analysis 2023-2030 (US$)
Table 21: Terminal Automation Market Trend Analysis 2023-2030 (US$)
Table 22: Terminal Automation Market Size 2023 (US$)
Table 23: Terminal Automation Market Forecast Analysis 2023-2030 (US$)
Table 24: Terminal Automation Market Sales Forecast Analysis 2023-2030 (Units)
Table 25: Terminal Automation Market, Revenue & Volume, By Type, 2023-2030 ($)
Table 26: Terminal Automation Market By Type, Revenue & Volume, By Software, 2023-2030 ($)
Table 27: Terminal Automation Market By Type, Revenue & Volume, By Service, 2023-2030 ($)
Table 28: Terminal Automation Market By Type, Revenue & Volume, By Hardware, 2023-2030 ($)
Table 29: Terminal Automation Market, Revenue & Volume, By Product, 2023-2030 ($)
Table 30: Terminal Automation Market By Product, Revenue & Volume, By Control System, 2023-2030 ($)
Table 31: Terminal Automation Market By Product, Revenue & Volume, By Integrated Safety System, 2023-2030 ($)
Table 32: Terminal Automation Market, Revenue & Volume, By Mode, 2023-2030 ($)
Table 33: Terminal Automation Market By Mode, Revenue & Volume, By Truck, 2023-2030 ($)
Table 34: Terminal Automation Market By Mode, Revenue & Volume, By Pipeline, 2023-2030 ($)
Table 35: Terminal Automation Market By Mode, Revenue & Volume, By Marine, 2023-2030 ($)
Table 36: Terminal Automation Market, Revenue & Volume, By End User Industry, 2023-2030 ($)
Table 37: Terminal Automation Market By End User Industry, Revenue & Volume, By Cement, 2023-2030 ($)
Table 38: Terminal Automation Market By End User Industry, Revenue & Volume, By Oil & Gas, 2023-2030 ($)
Table 39: Terminal Automation Market By End User Industry, Revenue & Volume, By Chemical and Petrochemical, 2023-2030 ($)
Table 40: North America Terminal Automation Market, Revenue & Volume, By Type, 2023-2030 ($)
Table 41: North America Terminal Automation Market, Revenue & Volume, By Product, 2023-2030 ($)
Table 42: North America Terminal Automation Market, Revenue & Volume, By Mode, 2023-2030 ($)
Table 43: North America Terminal Automation Market, Revenue & Volume, By End User Industry, 2023-2030 ($)
Table 44: South america Terminal Automation Market, Revenue & Volume, By Type, 2023-2030 ($)
Table 45: South america Terminal Automation Market, Revenue & Volume, By Product, 2023-2030 ($)
Table 46: South america Terminal Automation Market, Revenue & Volume, By Mode, 2023-2030 ($)
Table 47: South america Terminal Automation Market, Revenue & Volume, By End User Industry, 2023-2030 ($)
Table 48: Europe Terminal Automation Market, Revenue & Volume, By Type, 2023-2030 ($)
Table 49: Europe Terminal Automation Market, Revenue & Volume, By Product, 2023-2030 ($)
Table 50: Europe Terminal Automation Market, Revenue & Volume, By Mode, 2023-2030 ($)
Table 51: Europe Terminal Automation Market, Revenue & Volume, By End User Industry, 2023-2030 ($)
Table 52: APAC Terminal Automation Market, Revenue & Volume, By Type, 2023-2030 ($)
Table 53: APAC Terminal Automation Market, Revenue & Volume, By Product, 2023-2030 ($)
Table 54: APAC Terminal Automation Market, Revenue & Volume, By Mode, 2023-2030 ($)
Table 55: APAC Terminal Automation Market, Revenue & Volume, By End User Industry, 2023-2030 ($)
Table 56: Middle East & Africa Terminal Automation Market, Revenue & Volume, By Type, 2023-2030 ($)
Table 57: Middle East & Africa Terminal Automation Market, Revenue & Volume, By Product, 2023-2030 ($)
Table 58: Middle East & Africa Terminal Automation Market, Revenue & Volume, By Mode, 2023-2030 ($)
Table 59: Middle East & Africa Terminal Automation Market, Revenue & Volume, By End User Industry, 2023-2030 ($)
Table 60: Russia Terminal Automation Market, Revenue & Volume, By Type, 2023-2030 ($)
Table 61: Russia Terminal Automation Market, Revenue & Volume, By Product, 2023-2030 ($)
Table 62: Russia Terminal Automation Market, Revenue & Volume, By Mode, 2023-2030 ($)
Table 63: Russia Terminal Automation Market, Revenue & Volume, By End User Industry, 2023-2030 ($)
Table 64: Israel Terminal Automation Market, Revenue & Volume, By Type, 2023-2030 ($)
Table 65: Israel Terminal Automation Market, Revenue & Volume, By Product, 2023-2030 ($)
Table 66: Israel Terminal Automation Market, Revenue & Volume, By Mode, 2023-2030 ($)
Table 67: Israel Terminal Automation Market, Revenue & Volume, By End User Industry, 2023-2030 ($)
Table 68: Top Companies 2023 (US$)Terminal Automation Market, Revenue & Volume
Table 69: Product Launch 2023-2030Terminal Automation Market, Revenue & Volume
Table 70: Mergers & Acquistions 2023-2030Terminal Automation Market, Revenue & Volume
List of Figures
Figure 1: Overview of Terminal Automation Market 2023-2030
Figure 2: Market Share Analysis for Terminal Automation Market 2023 (US$)
Figure 3: Product Comparison in Terminal Automation Market 2023-2030 (US$)
Figure 4: End User Profile for Terminal Automation Market 2023-2030 (US$)
Figure 5: Patent Application and Grant in Terminal Automation Market 2013-2023* (US$)
Figure 6: Top 5 Companies Financial Analysis in Terminal Automation Market 2023-2030 (US$)
Figure 7: Market Entry Strategy in Terminal Automation Market 2023-2030
Figure 8: Ecosystem Analysis in Terminal Automation Market 2023
Figure 9: Average Selling Price in Terminal Automation Market 2023-2030
Figure 10: Top Opportunites in Terminal Automation Market 2023-2030
Figure 11: Market Life Cycle Analysis in Terminal Automation Market
Figure 12: GlobalBy TypeTerminal Automation Market Revenue, 2023-2030 ($)
Figure 13: GlobalBy ProductTerminal Automation Market Revenue, 2023-2030 ($)
Figure 14: GlobalBy ModeTerminal Automation Market Revenue, 2023-2030 ($)
Figure 15: GlobalBy End User IndustryTerminal Automation Market Revenue, 2023-2030 ($)
Figure 16: Global Terminal Automation Market - By Geography
Figure 17: Global Terminal Automation Market Value & Volume, By Geography, 2023-2030 ($)
Figure 18: Global Terminal Automation Market CAGR, By Geography, 2023-2030 (%)
Figure 19: North America Terminal Automation Market Value & Volume, 2023-2030 ($)
Figure 20: US Terminal Automation Market Value & Volume, 2023-2030 ($)
Figure 21: US GDP and Population, 2023-2030 ($)
Figure 22: US GDP – Composition of 2023, By Sector of Origin
Figure 23: US Export and Import Value & Volume, 2023-2030 ($)
Figure 24: Canada Terminal Automation Market Value & Volume, 2023-2030 ($)
Figure 25: Canada GDP and Population, 2023-2030 ($)
Figure 26: Canada GDP – Composition of 2023, By Sector of Origin
Figure 27: Canada Export and Import Value & Volume, 2023-2030 ($)
Figure 28: Mexico Terminal Automation Market Value & Volume, 2023-2030 ($)
Figure 29: Mexico GDP and Population, 2023-2030 ($)
Figure 30: Mexico GDP – Composition of 2023, By Sector of Origin
Figure 31: Mexico Export and Import Value & Volume, 2023-2030 ($)
Figure 32: South America Terminal Automation Market Value & Volume, 2023-2030 ($)
Figure 33: Brazil Terminal Automation Market Value & Volume, 2023-2030 ($)
Figure 34: Brazil GDP and Population, 2023-2030 ($)
Figure 35: Brazil GDP – Composition of 2023, By Sector of Origin
Figure 36: Brazil Export and Import Value & Volume, 2023-2030 ($)
Figure 37: Venezuela Terminal Automation Market Value & Volume, 2023-2030 ($)
Figure 38: Venezuela GDP and Population, 2023-2030 ($)
Figure 39: Venezuela GDP – Composition of 2023, By Sector of Origin
Figure 40: Venezuela Export and Import Value & Volume, 2023-2030 ($)
Figure 41: Argentina Terminal Automation Market Value & Volume, 2023-2030 ($)
Figure 42: Argentina GDP and Population, 2023-2030 ($)
Figure 43: Argentina GDP – Composition of 2023, By Sector of Origin
Figure 44: Argentina Export and Import Value & Volume, 2023-2030 ($)
Figure 45: Ecuador Terminal Automation Market Value & Volume, 2023-2030 ($)
Figure 46: Ecuador GDP and Population, 2023-2030 ($)
Figure 47: Ecuador GDP – Composition of 2023, By Sector of Origin
Figure 48: Ecuador Export and Import Value & Volume, 2023-2030 ($)
Figure 49: Peru Terminal Automation Market Value & Volume, 2023-2030 ($)
Figure 50: Peru GDP and Population, 2023-2030 ($)
Figure 51: Peru GDP – Composition of 2023, By Sector of Origin
Figure 52: Peru Export and Import Value & Volume, 2023-2030 ($)
Figure 53: Colombia Terminal Automation Market Value & Volume, 2023-2030 ($)
Figure 54: Colombia GDP and Population, 2023-2030 ($)
Figure 55: Colombia GDP – Composition of 2023, By Sector of Origin
Figure 56: Colombia Export and Import Value & Volume, 2023-2030 ($)
Figure 57: Costa Rica Terminal Automation Market Value & Volume, 2023-2030 ($)
Figure 58: Costa Rica GDP and Population, 2023-2030 ($)
Figure 59: Costa Rica GDP – Composition of 2023, By Sector of Origin
Figure 60: Costa Rica Export and Import Value & Volume, 2023-2030 ($)
Figure 61: Europe Terminal Automation Market Value & Volume, 2023-2030 ($)
Figure 62: U.K Terminal Automation Market Value & Volume, 2023-2030 ($)
Figure 63: U.K GDP and Population, 2023-2030 ($)
Figure 64: U.K GDP – Composition of 2023, By Sector of Origin
Figure 65: U.K Export and Import Value & Volume, 2023-2030 ($)
Figure 66: Germany Terminal Automation Market Value & Volume, 2023-2030 ($)
Figure 67: Germany GDP and Population, 2023-2030 ($)
Figure 68: Germany GDP – Composition of 2023, By Sector of Origin
Figure 69: Germany Export and Import Value & Volume, 2023-2030 ($)
Figure 70: Italy Terminal Automation Market Value & Volume, 2023-2030 ($)
Figure 71: Italy GDP and Population, 2023-2030 ($)
Figure 72: Italy GDP – Composition of 2023, By Sector of Origin
Figure 73: Italy Export and Import Value & Volume, 2023-2030 ($)
Figure 74: France Terminal Automation Market Value & Volume, 2023-2030 ($)
Figure 75: France GDP and Population, 2023-2030 ($)
Figure 76: France GDP – Composition of 2023, By Sector of Origin
Figure 77: France Export and Import Value & Volume, 2023-2030 ($)
Figure 78: Netherlands Terminal Automation Market Value & Volume, 2023-2030 ($)
Figure 79: Netherlands GDP and Population, 2023-2030 ($)
Figure 80: Netherlands GDP – Composition of 2023, By Sector of Origin
Figure 81: Netherlands Export and Import Value & Volume, 2023-2030 ($)
Figure 82: Belgium Terminal Automation Market Value & Volume, 2023-2030 ($)
Figure 83: Belgium GDP and Population, 2023-2030 ($)
Figure 84: Belgium GDP – Composition of 2023, By Sector of Origin
Figure 85: Belgium Export and Import Value & Volume, 2023-2030 ($)
Figure 86: Spain Terminal Automation Market Value & Volume, 2023-2030 ($)
Figure 87: Spain GDP and Population, 2023-2030 ($)
Figure 88: Spain GDP – Composition of 2023, By Sector of Origin
Figure 89: Spain Export and Import Value & Volume, 2023-2030 ($)
Figure 90: Denmark Terminal Automation Market Value & Volume, 2023-2030 ($)
Figure 91: Denmark GDP and Population, 2023-2030 ($)
Figure 92: Denmark GDP – Composition of 2023, By Sector of Origin
Figure 93: Denmark Export and Import Value & Volume, 2023-2030 ($)
Figure 94: APAC Terminal Automation Market Value & Volume, 2023-2030 ($)
Figure 95: China Terminal Automation Market Value & Volume, 2023-2030
Figure 96: China GDP and Population, 2023-2030 ($)
Figure 97: China GDP – Composition of 2023, By Sector of Origin
Figure 98: China Export and Import Value & Volume, 2023-2030 ($)Terminal Automation Market China Export and Import Value & Volume, 2023-2030 ($)
Figure 99: Australia Terminal Automation Market Value & Volume, 2023-2030 ($)
Figure 100: Australia GDP and Population, 2023-2030 ($)
Figure 101: Australia GDP – Composition of 2023, By Sector of Origin
Figure 102: Australia Export and Import Value & Volume, 2023-2030 ($)
Figure 103: South Korea Terminal Automation Market Value & Volume, 2023-2030 ($)
Figure 104: South Korea GDP and Population, 2023-2030 ($)
Figure 105: South Korea GDP – Composition of 2023, By Sector of Origin
Figure 106: South Korea Export and Import Value & Volume, 2023-2030 ($)
Figure 107: India Terminal Automation Market Value & Volume, 2023-2030 ($)
Figure 108: India GDP and Population, 2023-2030 ($)
Figure 109: India GDP – Composition of 2023, By Sector of Origin
Figure 110: India Export and Import Value & Volume, 2023-2030 ($)
Figure 111: Taiwan Terminal Automation Market Value & Volume, 2023-2030 ($)
Figure 112: Taiwan GDP and Population, 2023-2030 ($)
Figure 113: Taiwan GDP – Composition of 2023, By Sector of Origin
Figure 114: Taiwan Export and Import Value & Volume, 2023-2030 ($)
Figure 115: Malaysia Terminal Automation Market Value & Volume, 2023-2030 ($)
Figure 116: Malaysia GDP and Population, 2023-2030 ($)
Figure 117: Malaysia GDP – Composition of 2023, By Sector of Origin
Figure 118: Malaysia Export and Import Value & Volume, 2023-2030 ($)
Figure 119: Hong Kong Terminal Automation Market Value & Volume, 2023-2030 ($)
Figure 120: Hong Kong GDP and Population, 2023-2030 ($)
Figure 121: Hong Kong GDP – Composition of 2023, By Sector of Origin
Figure 122: Hong Kong Export and Import Value & Volume, 2023-2030 ($)
Figure 123: Middle East & Africa Terminal Automation Market Middle East & Africa 3D Printing Market Value & Volume, 2023-2030 ($)
Figure 124: Russia Terminal Automation Market Value & Volume, 2023-2030 ($)
Figure 125: Russia GDP and Population, 2023-2030 ($)
Figure 126: Russia GDP – Composition of 2023, By Sector of Origin
Figure 127: Russia Export and Import Value & Volume, 2023-2030 ($)
Figure 128: Israel Terminal Automation Market Value & Volume, 2023-2030 ($)
Figure 129: Israel GDP and Population, 2023-2030 ($)
Figure 130: Israel GDP – Composition of 2023, By Sector of Origin
Figure 131: Israel Export and Import Value & Volume, 2023-2030 ($)
Figure 132: Entropy Share, By Strategies, 2023-2030* (%)Terminal Automation Market
Figure 133: Developments, 2023-2030*Terminal Automation Market
Figure 134: Company 1 Terminal Automation Market Net Revenue, By Years, 2023-2030* ($)
Figure 135: Company 1 Terminal Automation Market Net Revenue Share, By Business segments, 2023 (%)
Figure 136: Company 1 Terminal Automation Market Net Sales Share, By Geography, 2023 (%)
Figure 137: Company 2 Terminal Automation Market Net Revenue, By Years, 2023-2030* ($)
Figure 138: Company 2 Terminal Automation Market Net Revenue Share, By Business segments, 2023 (%)
Figure 139: Company 2 Terminal Automation Market Net Sales Share, By Geography, 2023 (%)
Figure 140: Company 3 Terminal Automation Market Net Revenue, By Years, 2023-2030* ($)
Figure 141: Company 3 Terminal Automation Market Net Revenue Share, By Business segments, 2023 (%)
Figure 142: Company 3 Terminal Automation Market Net Sales Share, By Geography, 2023 (%)
Figure 143: Company 4 Terminal Automation Market Net Revenue, By Years, 2023-2030* ($)
Figure 144: Company 4 Terminal Automation Market Net Revenue Share, By Business segments, 2023 (%)
Figure 145: Company 4 Terminal Automation Market Net Sales Share, By Geography, 2023 (%)
Figure 146: Company 5 Terminal Automation Market Net Revenue, By Years, 2023-2030* ($)
Figure 147: Company 5 Terminal Automation Market Net Revenue Share, By Business segments, 2023 (%)
Figure 148: Company 5 Terminal Automation Market Net Sales Share, By Geography, 2023 (%)
Figure 149: Company 6 Terminal Automation Market Net Revenue, By Years, 2023-2030* ($)
Figure 150: Company 6 Terminal Automation Market Net Revenue Share, By Business segments, 2023 (%)
Figure 151: Company 6 Terminal Automation Market Net Sales Share, By Geography, 2023 (%)
Figure 152: Company 7 Terminal Automation Market Net Revenue, By Years, 2023-2030* ($)
Figure 153: Company 7 Terminal Automation Market Net Revenue Share, By Business segments, 2023 (%)
Figure 154: Company 7 Terminal Automation Market Net Sales Share, By Geography, 2023 (%)
Figure 155: Company 8 Terminal Automation Market Net Revenue, By Years, 2023-2030* ($)
Figure 156: Company 8 Terminal Automation Market Net Revenue Share, By Business segments, 2023 (%)
Figure 157: Company 8 Terminal Automation Market Net Sales Share, By Geography, 2023 (%)
Figure 158: Company 9 Terminal Automation Market Net Revenue, By Years, 2023-2030* ($)
Figure 159: Company 9 Terminal Automation Market Net Revenue Share, By Business segments, 2023 (%)
Figure 160: Company 9 Terminal Automation Market Net Sales Share, By Geography, 2023 (%)
Figure 161: Company 10 Terminal Automation Market Net Revenue, By Years, 2023-2030* ($)
Figure 162: Company 10 Terminal Automation Market Net Revenue Share, By Business segments, 2023 (%)
Figure 163: Company 10 Terminal Automation Market Net Sales Share, By Geography, 2023 (%)
Figure 164: Company 11 Terminal Automation Market Net Revenue, By Years, 2023-2030* ($)
Figure 165: Company 11 Terminal Automation Market Net Revenue Share, By Business segments, 2023 (%)
Figure 166: Company 11 Terminal Automation Market Net Sales Share, By Geography, 2023 (%)
Figure 167: Company 12 Terminal Automation Market Net Revenue, By Years, 2023-2030* ($)
Figure 168: Company 12 Terminal Automation Market Net Revenue Share, By Business segments, 2023 (%)
Figure 169: Company 12 Terminal Automation Market Net Sales Share, By Geography, 2023 (%)
Figure 170: Company 13 Terminal Automation Market Net Revenue, By Years, 2023-2030* ($)
Figure 171: Company 13 Terminal Automation Market Net Revenue Share, By Business segments, 2023 (%)
Figure 172: Company 13 Terminal Automation Market Net Sales Share, By Geography, 2023 (%)
Figure 173: Company 14 Terminal Automation Market Net Revenue, By Years, 2023-2030* ($)
Figure 174: Company 14 Terminal Automation Market Net Revenue Share, By Business segments, 2023 (%)
Figure 175: Company 14 Terminal Automation Market Net Sales Share, By Geography, 2023 (%)
Figure 176: Company 15 Terminal Automation Market Net Revenue, By Years, 2023-2030* ($)
Figure 177: Company 15 Terminal Automation Market Net Revenue Share, By Business segments, 2023 (%)
Figure 178: Company 15 Terminal Automation Market Net Sales Share, By Geography, 2023 (%)