 Email
Email Print
Print


Big Data Analytics in Agriculture Market - Forecast(2025 - 2031)
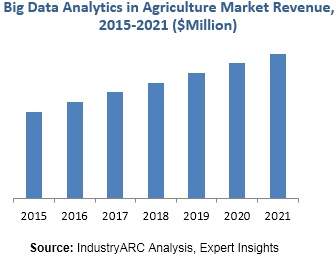
Agriculture industry is undergoing policy reforms in almost every part of the world. Hence, new initiatives of production systems are being attempted in the form of contract farming or corporate farming. Big data analytics and processing is the collection of large and intricate data series which are generally difficult to process using common database management tools. Big data in agriculture is becoming a crucial aspect and accounts for nearly 5% of the market share of the entire big data industry. Big data analytics in the agriculture sector, in the near future, is anticipated to turn out to be the fifth largest industry in terms of market share. This market is projected to reach $XX billion by 2021 from $XX billion in 2015, growing at a CAGR of XX% during the forecast period.
The big data in agriculture market has been analyzed with respect to different parameters such as operation on data, end-user and type of solutions. This market has been categorized by end-user and application. On the basis of end-users the market is segmented into farmers, agriculture regulatory bodies, weather forecast, agrochemical and farm equipment industries.
The overall market is also presented from the perspective of different geographic regions and the key countries in each region. North America held the major share in the big data in agriculture market in 2015 due to large number of companies applying big data results to predict the perfect conditions for the perfect crop. Market players are focusing on new technology and working on introducing new parameters so as to gain maximum efficiency to entice the agricultural sector. Asia Pacific is estimated to be the fastest growing region during 2016-2021. China and India holds the major share in the big data in agriculture market in APAC region due to rapid growth in the big data sector and its application on various parameters of the farming industry.
Sample Companies Profiled in this Report are:
- IBM Corporation (U.S.)
- Oracle Corporation (U.S.)
- Hewlett Packard Enterprise Development LP (U.S.)
- International Centre for Tropical Agriculture (Colombia)
- NTT Data Corporation (Japan)
- 10+.
1. Big Data Analytics in Agriculture Market - Overview
1.1. Definitions and Scope
2. Big Data Analytics in Agriculture Market - Executive summary
2.1. Market Revenue, Market Size and Key Trends by Company
2.2. Key Trends by type of Application
2.3. Key Trends segmented by Geography
3. Big Data Analytics in Agriculture Market
3.1. Comparative analysis
3.1.1. Product Benchmarking - Top 10 companies
3.1.2. Top 5 Financials Analysis
3.1.3. Market Value split by Top 10 companies
3.1.4. Patent Analysis - Top 10 companies
3.1.5. Pricing Analysis
4. Big Data Analytics in Agriculture Market – Startup companies Scenario Premium
4.1. Top 10 startup company Analysis by
4.1.1. Investment
4.1.2. Revenue
4.1.3. Market Shares
4.1.4. Market Size and Application Analysis
4.1.5. Venture Capital and Funding Scenario
5. Big Data Analytics in Agriculture Market – Industry Market Entry Scenario Premium
5.1. Regulatory Framework Overview
5.2. New Business and Ease of Doing business index
5.3. Case studies of successful ventures
5.4. Customer Analysis – Top 10 companies
6. Big Data Analytics in Agriculture Market Forces
6.1. Drivers
6.2. Constraints
6.3. Challenges
6.4. Porters five force model
6.4.1. Bargaining power of suppliers
6.4.2. Bargaining powers of customers
6.4.3. Threat of new entrants
6.4.4. Rivalry among existing players
6.4.5. Threat of substitutes
7. Big Data Analytics in Agriculture Market -Strategic analysis
7.1. Value chain analysis
7.2. Opportunities analysis
7.3. Product life cycle
7.4. Suppliers and distributors Market Share
8. Big Data Analytics in Agriculture Market – By Type of Analysis (Market Size -$Million / $Billion)
8.1. Market Size and Market Share Analysis
8.2. Application Revenue and Trend Research
8.3. Product Segment Analysis
8.3.1. Introduction
8.3.2. Retrospective Analytics
8.3.3. Predictive Analytics
8.3.4. Prescriptive Analytics
9. Big Data Analytics in Agriculture Market – By Solution (Market Size -$Million / $Billion)
9.1. Introduction
9.2. Hardware
9.3. Software
9.4. Services
9.4.1. Support Services
9.4.2. Business Services
9.4.3. Others
10. Big Data Analytics in Agriculture Market – By Operation on Data (Market Size -$Million / $Billion)
10.1. Capturing Data
10.2. Storing Data
10.3. Sharing Data
10.4. Analyzing Data
10.5. Others
11. Big Data Analytics in Agriculture Market – By Application (Market Size -$Million / $Billion)
11.1. Chemical Analytics
11.2. Weather Analytics
11.3. Financial Analytics
11.4. Administrative Analytics
11.5. Crop Production Analytics
11.6. Social Analytics
11.7. Farm Land/ Equipment Analytics
11.8. Others
12. Big Data Analytics in Agriculture – By End Use Industry(Market Size -$Million / $Billion)
12.1. Segment type Size and Market Share Analysis
12.2. Application Revenue and Trends by type of Application
12.3. Application Segment Analysis by Type
12.3.1. Farmers
12.3.2. Agriculture Regulatory Bodies
12.3.3. Weather Forecast
12.3.4. Agrochemical Industry
12.3.5. Farm Equipment Industry
12.3.6. Others
13. Big Data Analytics in Agriculture - By Geography (Market Size -$Million / $Billion)
13.1. Big Data Analytics in Agriculture Market - North America Segment Research
13.2. North America Market Research (Million / $Billion)
13.2.1. Segment type Size and Market Size Analysis
13.2.2. Revenue and Trends
13.2.3. Application Revenue and Trends by type of Application
13.2.4. Company Revenue and Product Analysis
13.2.5. North America Product type and Application Market Size
13.2.5.1. U.S.
13.2.5.2. Canada
13.2.5.3. Mexico
13.2.5.4. Rest of North America
13.3. Big Data Analytics in Agriculture - South America Segment Research
13.4. South America Market Research (Market Size -$Million / $Billion)
13.4.1. Segment type Size and Market Size Analysis
13.4.2. Revenue and Trends
13.4.3. Application Revenue and Trends by type of Application
13.4.4. Company Revenue and Product Analysis
13.4.5. South America Product type and Application Market Size
13.4.5.1. Brazil
13.4.5.2. Venezuela
13.4.5.3. Argentina
13.4.5.4. Ecuador
13.4.5.5. Peru
13.4.5.6. Colombia
13.4.5.7. Costa Rica
13.4.5.8. Rest of South America
13.5. Big Data Analytics in Agriculture - Europe Segment Research
13.6. Europe Market Research (Market Size -$Million / $Billion)
13.6.1. Segment type Size and Market Size Analysis
13.6.2. Revenue and Trends
13.6.3. Application Revenue and Trends by type of Application
13.6.4. Company Revenue and Product Analysis
13.6.5. Europe Segment Product type and Application Market Size
13.6.5.1. U.K
13.6.5.2. Germany
13.6.5.3. Italy
13.6.5.4. France
13.6.5.5. Netherlands
13.6.5.6. Belgium
13.6.5.7. Spain
13.6.5.8. Denmark
13.6.5.9. Rest of Europe
13.7. Big Data Analytics in Agriculture – APAC Segment Research
13.8. APAC Market Research (Market Size -$Million / $Billion)
13.8.1. Segment type Size and Market Size Analysis
13.8.2. Revenue and Trends
13.8.3. Application Revenue and Trends by type of Application
13.8.4. Company Revenue and Product Analysis
13.8.5. APAC Segment – Product type and Application Market Size
13.8.5.1. China
13.8.5.2. Australia
13.8.5.3. Japan
13.8.5.4. South Korea
13.8.5.5. India
13.8.5.6. Taiwan
13.8.5.7. Malaysia
14. Big Data Analytics in Agriculture Market - Entropy
14.1. New product launches
14.2. M&A's, collaborations, JVs and partnerships
15. Big Data Analytics in Agriculture Market – Industry / Segment Competition landscape Premium
15.1. Market Share Analysis
15.1.1. Market Share by Country- Top companies
15.1.2. Market Share by Region- Top 10 companies
15.1.3. Market Share by type of Application – Top 10 companies
15.1.4. Market Share by type of Product / Product category- Top 10 companies
15.1.5. Market Share at global level- Top 10 companies
15.1.6. Best Practises for companies
14. Big Data Analytics in Agriculture Market – Key Company List by Country Premium
17. Big Data Analytics in Agriculture Market Company Analysis
17.1. Market Share, Company Revenue, Products, M&A, Developments
17.2. Company 1
17.3. Company 2
17.4. Company 3
17.5. Company 4
17.6. Company 5
17.7. Company 6
17.8. Company 7
17.9. Company 8
17.10. Company 9
17.11. Company 10 and more
"*Financials would be provided on a best efforts basis for private companies"
18. Big Data Analytics in Agriculture Market -Appendix
18.1. Abbreviations
18.2. Sources
19. Big Data Analytics in Agriculture Market -Methodology Premium
19.1. Research Methodology
19.1.1. Company Expert Interviews
19.1.2. Industry Databases
19.1.3. Associations
19.1.4. Company News
19.1.5. Company Annual Reports
19.1.6. Application Trends
19.1.7. New Products and Product database
19.1.8. Company Transcripts
19.1.9. R&D Trends
19.1.10. Key Opinion Leaders Interviews
19.1.11. Supply and Demand Trends
List of Tables:
Table 1: Big Data Analytics in Agriculture Overview 2023-2030
Table 2: Big Data Analytics in Agriculture Leader Analysis 2023-2030 (US$)
Table 3: Big Data Analytics in Agriculture Product Analysis 2023-2030 (US$)
Table 4: Big Data Analytics in Agriculture End User Analysis 2023-2030 (US$)
Table 5: Big Data Analytics in Agriculture Patent Analysis 2013-2023* (US$)
Table 6: Big Data Analytics in Agriculture Financial Analysis 2023-2030 (US$)
Table 7: Big Data Analytics in Agriculture Driver Analysis 2023-2030 (US$)
Table 8: Big Data Analytics in Agriculture Challenges Analysis 2023-2030 (US$)
Table 9: Big Data Analytics in Agriculture Constraint Analysis 2023-2030 (US$)
Table 10: Big Data Analytics in Agriculture Supplier Bargaining Power Analysis 2023-2030 (US$)
Table 11: Big Data Analytics in Agriculture Buyer Bargaining Power Analysis 2023-2030 (US$)
Table 12: Big Data Analytics in Agriculture Threat of Substitutes Analysis 2023-2030 (US$)
Table 13: Big Data Analytics in Agriculture Threat of New Entrants Analysis 2023-2030 (US$)
Table 14: Big Data Analytics in Agriculture Degree of Competition Analysis 2023-2030 (US$)
Table 15: Big Data Analytics in Agriculture Value Chain Analysis 2023-2030 (US$)
Table 16: Big Data Analytics in Agriculture Pricing Analysis 2023-2030 (US$)
Table 17: Big Data Analytics in Agriculture Opportunities Analysis 2023-2030 (US$)
Table 18: Big Data Analytics in Agriculture Product Life Cycle Analysis 2023-2030 (US$)
Table 19: Big Data Analytics in Agriculture Supplier Analysis 2023-2030 (US$)
Table 20: Big Data Analytics in Agriculture Distributor Analysis 2023-2030 (US$)
Table 21: Big Data Analytics in Agriculture Trend Analysis 2023-2030 (US$)
Table 22: Big Data Analytics in Agriculture Size 2023 (US$)
Table 23: Big Data Analytics in Agriculture Forecast Analysis 2023-2030 (US$)
Table 24: Big Data Analytics in Agriculture Sales Forecast Analysis 2023-2030 (Units)
Table 25: Big Data Analytics in Agriculture, Revenue & Volume,By Type of Analysis, 2023-2030 ($)
Table 26: Big Data Analytics in Agriculture By Type of Analysis, Revenue & Volume,By Retrospective Analytics, 2023-2030 ($)
Table 27: Big Data Analytics in Agriculture By Type of Analysis, Revenue & Volume,By Predictive Analytics, 2023-2030 ($)
Table 28: Big Data Analytics in Agriculture By Type of Analysis, Revenue & Volume,By Prescriptive Analytics, 2023-2030 ($)
Table 29: Big Data Analytics in Agriculture, Revenue & Volume,By Solution, 2023-2030 ($)
Table 30: Big Data Analytics in AgricultureBy Solution, Revenue & Volume,By Hardware, 2023-2030 ($)
Table 31: Big Data Analytics in AgricultureBy Solution, Revenue & Volume,By Software, 2023-2030 ($)
Table 32: Big Data Analytics in AgricultureBy Solution, Revenue & Volume,By Services, 2023-2030 ($)
Table 33: Big Data Analytics in Agriculture, Revenue & Volume,By Operation on Data, 2023-2030 ($)
Table 34: Big Data Analytics in AgricultureBy Operation on Data, Revenue & Volume,By Capturing Data, 2023-2030 ($)
Table 35: Big Data Analytics in AgricultureBy Operation on Data, Revenue & Volume,By Storing Data, 2023-2030 ($)
Table 36: Big Data Analytics in AgricultureBy Operation on Data, Revenue & Volume,By Sharing Data, 2023-2030 ($)
Table 37: Big Data Analytics in AgricultureBy Operation on Data, Revenue & Volume,By Analyzing Data, 2023-2030 ($)
Table 38: Big Data Analytics in Agriculture, Revenue & Volume,By Application, 2023-2030 ($)
Table 39: Big Data Analytics in AgricultureBy Application, Revenue & Volume,By Chemical Analytics, 2023-2030 ($)
Table 40: Big Data Analytics in AgricultureBy Application, Revenue & Volume,By Weather Analytics, 2023-2030 ($)
Table 41: Big Data Analytics in AgricultureBy Application, Revenue & Volume,By Financial Analytics, 2023-2030 ($)
Table 42: Big Data Analytics in AgricultureBy Application, Revenue & Volume,By Administrative Analytics, 2023-2030 ($)
Table 43: Big Data Analytics in AgricultureBy Application, Revenue & Volume,By Crop Production Analytics, 2023-2030 ($)
Table 44: Big Data Analytics in Agriculture, Revenue & Volume,By End-User, 2023-2030 ($)
Table 45: Big Data Analytics in AgricultureBy End-User, Revenue & Volume,By Farmers, 2023-2030 ($)
Table 46: Big Data Analytics in AgricultureBy End-User, Revenue & Volume,By Agriculture Regulatory Bodies, 2023-2030 ($)
Table 47: Big Data Analytics in AgricultureBy End-User, Revenue & Volume,By Weather Forecast, 2023-2030 ($)
Table 48: Big Data Analytics in AgricultureBy End-User, Revenue & Volume,By Agrochemical Industry, 2023-2030 ($)
Table 49: Big Data Analytics in AgricultureBy End-User, Revenue & Volume,By Farm Equipment Industry, 2023-2030 ($)
Table 50: North America Big Data Analytics in Agriculture, Revenue & Volume,By Type of Analysis, 2023-2030 ($)
Table 51: North America Big Data Analytics in Agriculture, Revenue & Volume,By Solution, 2023-2030 ($)
Table 52: North America Big Data Analytics in Agriculture, Revenue & Volume,By Operation on Data, 2023-2030 ($)
Table 53: North America Big Data Analytics in Agriculture, Revenue & Volume,By Application, 2023-2030 ($)
Table 54: North America Big Data Analytics in Agriculture, Revenue & Volume,By End-User, 2023-2030 ($)
Table 55: South america Big Data Analytics in Agriculture, Revenue & Volume,By Type of Analysis, 2023-2030 ($)
Table 56: South america Big Data Analytics in Agriculture, Revenue & Volume,By Solution, 2023-2030 ($)
Table 57: South america Big Data Analytics in Agriculture, Revenue & Volume,By Operation on Data, 2023-2030 ($)
Table 58: South america Big Data Analytics in Agriculture, Revenue & Volume,By Application, 2023-2030 ($)
Table 59: South america Big Data Analytics in Agriculture, Revenue & Volume,By End-User, 2023-2030 ($)
Table 60: Europe Big Data Analytics in Agriculture, Revenue & Volume,By Type of Analysis, 2023-2030 ($)
Table 61: Europe Big Data Analytics in Agriculture, Revenue & Volume,By Solution, 2023-2030 ($)
Table 62: Europe Big Data Analytics in Agriculture, Revenue & Volume,By Operation on Data, 2023-2030 ($)
Table 63: Europe Big Data Analytics in Agriculture, Revenue & Volume,By Application, 2023-2030 ($)
Table 64: Europe Big Data Analytics in Agriculture, Revenue & Volume,By End-User, 2023-2030 ($)
Table 65: APAC Big Data Analytics in Agriculture, Revenue & Volume,By Type of Analysis, 2023-2030 ($)
Table 66: APAC Big Data Analytics in Agriculture, Revenue & Volume,By Solution, 2023-2030 ($)
Table 67: APAC Big Data Analytics in Agriculture, Revenue & Volume,By Operation on Data, 2023-2030 ($)
Table 68: APAC Big Data Analytics in Agriculture, Revenue & Volume,By Application, 2023-2030 ($)
Table 69: APAC Big Data Analytics in Agriculture, Revenue & Volume,By End-User, 2023-2030 ($)
Table 70: Middle East & Africa Big Data Analytics in Agriculture, Revenue & Volume,By Type of Analysis, 2023-2030 ($)
Table 71: Middle East & Africa Big Data Analytics in Agriculture, Revenue & Volume,By Solution, 2023-2030 ($)
Table 72: Middle East & Africa Big Data Analytics in Agriculture, Revenue & Volume,By Operation on Data, 2023-2030 ($)
Table 73: Middle East & Africa Big Data Analytics in Agriculture, Revenue & Volume,By Application, 2023-2030 ($)
Table 74: Middle East & Africa Big Data Analytics in Agriculture, Revenue & Volume,By End-User, 2023-2030 ($)
Table 75: Russia Big Data Analytics in Agriculture, Revenue & Volume,By Type of Analysis, 2023-2030 ($)
Table 76: Russia Big Data Analytics in Agriculture, Revenue & Volume,By Solution, 2023-2030 ($)
Table 77: Russia Big Data Analytics in Agriculture, Revenue & Volume,By Operation on Data, 2023-2030 ($)
Table 78: Russia Big Data Analytics in Agriculture, Revenue & Volume,By Application, 2023-2030 ($)
Table 79: Russia Big Data Analytics in Agriculture, Revenue & Volume,By End-User, 2023-2030 ($)
Table 80: Israel Big Data Analytics in Agriculture, Revenue & Volume,By Type of Analysis, 2023-2030 ($)
Table 81: Israel Big Data Analytics in Agriculture, Revenue & Volume,By Solution, 2023-2030 ($)
Table 82: Israel Big Data Analytics in Agriculture, Revenue & Volume,By Operation on Data, 2023-2030 ($)
Table 83: Israel Big Data Analytics in Agriculture, Revenue & Volume,By Application, 2023-2030 ($)
Table 84: Israel Big Data Analytics in Agriculture, Revenue & Volume,By End-User, 2023-2030 ($)
Table 85: Top Companies 2023 (US$) Big Data Analytics in Agriculture, Revenue & Volume,,
Table 86: Product Launch 2023-2030 Big Data Analytics in Agriculture, Revenue & Volume,,
Table 87: Mergers & Acquistions 2023-2030 Big Data Analytics in Agriculture, Revenue & Volume,,
List of Figures:
Figure 1: Overview of Big Data Analytics in Agriculture 2023-2030
Figure 2: Market Share Analysis for Big Data Analytics in Agriculture 2023 (US$)
Figure 3: Product Comparison in Big Data Analytics in Agriculture 2023-2030 (US$)
Figure 4: End User Profile for Big Data Analytics in Agriculture 2023-2030 (US$)
Figure 5: Patent Application and Grant in Big Data Analytics in Agriculture 2013-2023* (US$)
Figure 6: Top 5 Companies Financial Analysis in Big Data Analytics in Agriculture 2023-2030 (US$)
Figure 7: Market Entry Strategy in Big Data Analytics in Agriculture 2023-2030
Figure 8: Ecosystem Analysis in Big Data Analytics in Agriculture2023
Figure 9: Average Selling Price in Big Data Analytics in Agriculture 2023-2030
Figure 10: Top Opportunites in Big Data Analytics in Agriculture 2023-2030
Figure 11: Market Life Cycle Analysis in Big Data Analytics in Agriculture
Figure 12: GlobalBy Type of AnalysisBig Data Analytics in Agriculture Revenue, 2023-2030 ($)
Figure 13: GlobalBy SolutionBig Data Analytics in Agriculture Revenue, 2023-2030 ($)
Figure 14: GlobalBy Operation on DataBig Data Analytics in Agriculture Revenue, 2023-2030 ($)
Figure 15: GlobalBy ApplicationBig Data Analytics in Agriculture Revenue, 2023-2030 ($)
Figure 16: GlobalBy End-UserBig Data Analytics in Agriculture Revenue, 2023-2030 ($)
Figure 17: Global Big Data Analytics in Agriculture - By Geography
Figure 18: Global Big Data Analytics in Agriculture Value & Volume, By Geography, 2023-2030 ($)
Figure 19: Global Big Data Analytics in Agriculture CAGR, By Geography, 2023-2030 (%)
Figure 20: North America Big Data Analytics in Agriculture Value & Volume, 2023-2030 ($)
Figure 21: US Big Data Analytics in Agriculture Value & Volume, 2023-2030 ($)
Figure 22: US GDP and Population, 2023-2030 ($)
Figure 23: US GDP – Composition of 2023, By Sector of Origin
Figure 24: US Export and Import Value & Volume, 2023-2030 ($)
Figure 25: Canada Big Data Analytics in Agriculture Value & Volume, 2023-2030 ($)
Figure 26: Canada GDP and Population, 2023-2030 ($)
Figure 27: Canada GDP – Composition of 2023, By Sector of Origin
Figure 28: Canada Export and Import Value & Volume, 2023-2030 ($)
Figure 29: Mexico Big Data Analytics in Agriculture Value & Volume, 2023-2030 ($)
Figure 30: Mexico GDP and Population, 2023-2030 ($)
Figure 31: Mexico GDP – Composition of 2023, By Sector of Origin
Figure 32: Mexico Export and Import Value & Volume, 2023-2030 ($)
Figure 33: South America Big Data Analytics in AgricultureSouth America 3D Printing Market Value & Volume, 2023-2030 ($)
Figure 34: Brazil Big Data Analytics in Agriculture Value & Volume, 2023-2030 ($)
Figure 35: Brazil GDP and Population, 2023-2030 ($)
Figure 36: Brazil GDP – Composition of 2023, By Sector of Origin
Figure 37: Brazil Export and Import Value & Volume, 2023-2030 ($)
Figure 38: Venezuela Big Data Analytics in Agriculture Value & Volume, 2023-2030 ($)
Figure 39: Venezuela GDP and Population, 2023-2030 ($)
Figure 40: Venezuela GDP – Composition of 2023, By Sector of Origin
Figure 41: Venezuela Export and Import Value & Volume, 2023-2030 ($)
Figure 42: Argentina Big Data Analytics in Agriculture Value & Volume, 2023-2030 ($)
Figure 43: Argentina GDP and Population, 2023-2030 ($)
Figure 44: Argentina GDP – Composition of 2023, By Sector of Origin
Figure 45: Argentina Export and Import Value & Volume, 2023-2030 ($)
Figure 46: Ecuador Big Data Analytics in Agriculture Value & Volume, 2023-2030 ($)
Figure 47: Ecuador GDP and Population, 2023-2030 ($)
Figure 48: Ecuador GDP – Composition of 2023, By Sector of Origin
Figure 49: Ecuador Export and Import Value & Volume, 2023-2030 ($)
Figure 50: Peru Big Data Analytics in Agriculture Value & Volume, 2023-2030 ($)
Figure 51: Peru GDP and Population, 2023-2030 ($)
Figure 52: Peru GDP – Composition of 2023, By Sector of Origin
Figure 53: Peru Export and Import Value & Volume, 2023-2030 ($)
Figure 54: Colombia Big Data Analytics in Agriculture Value & Volume, 2023-2030 ($)
Figure 55: Colombia GDP and Population, 2023-2030 ($)
Figure 56: Colombia GDP – Composition of 2023, By Sector of Origin
Figure 57: Colombia Export and Import Value & Volume, 2023-2030 ($)
Figure 58: Costa Rica Big Data Analytics in AgricultureCosta Rica 3D Printing Market Value & Volume, 2023-2030 ($)
Figure 59: Costa Rica GDP and Population, 2023-2030 ($)
Figure 60: Costa Rica GDP – Composition of 2023, By Sector of Origin
Figure 61: Costa Rica Export and Import Value & Volume, 2023-2030 ($)
Figure 62: Europe Big Data Analytics in Agriculture Value & Volume, 2023-2030 ($)
Figure 63: U.K Big Data Analytics in Agriculture Value & Volume, 2023-2030 ($)
Figure 64: U.K GDP and Population, 2023-2030 ($)
Figure 65: U.K GDP – Composition of 2023, By Sector of Origin
Figure 66: U.K Export and Import Value & Volume, 2023-2030 ($)
Figure 67: Germany Big Data Analytics in Agriculture Value & Volume, 2023-2030 ($)
Figure 68: Germany GDP and Population, 2023-2030 ($)
Figure 69: Germany GDP – Composition of 2023, By Sector of Origin
Figure 70: Germany Export and Import Value & Volume, 2023-2030 ($)
Figure 71: Italy Big Data Analytics in Agriculture Value & Volume, 2023-2030 ($)
Figure 72: Italy GDP and Population, 2023-2030 ($)
Figure 73: Italy GDP – Composition of 2023, By Sector of Origin
Figure 74: Italy Export and Import Value & Volume, 2023-2030 ($)
Figure 75: France Big Data Analytics in Agriculture Value & Volume, 2023-2030 ($)
Figure 76: France GDP and Population, 2023-2030 ($)
Figure 77: France GDP – Composition of 2023, By Sector of Origin
Figure 78: France Export and Import Value & Volume, 2023-2030 ($)
Figure 79: Netherlands Big Data Analytics in Agriculture Value & Volume, 2023-2030 ($)
Figure 80: Netherlands GDP and Population, 2023-2030 ($)
Figure 81: Netherlands GDP – Composition of 2023, By Sector of Origin
Figure 82: Netherlands Export and Import Value & Volume, 2023-2030 ($)
Figure 83: Belgium Big Data Analytics in Agriculture Value & Volume, 2023-2030 ($)
Figure 84: Belgium GDP and Population, 2023-2030 ($)
Figure 85: Belgium GDP – Composition of 2023, By Sector of Origin
Figure 86: Belgium Export and Import Value & Volume, 2023-2030 ($)
Figure 87: Spain Big Data Analytics in Agriculture Value & Volume, 2023-2030 ($)
Figure 88: Spain GDP and Population, 2023-2030 ($)
Figure 89: Spain GDP – Composition of 2023, By Sector of Origin
Figure 90: Spain Export and Import Value & Volume, 2023-2030 ($)
Figure 91: Denmark Big Data Analytics in Agriculture Value & Volume, 2023-2030 ($)
Figure 92: Denmark GDP and Population, 2023-2030 ($)
Figure 93: Denmark GDP – Composition of 2023, By Sector of Origin
Figure 94: Denmark Export and Import Value & Volume, 2023-2030 ($)
Figure 95: APAC Big Data Analytics in Agriculture Value & Volume, 2023-2030 ($)
Figure 96: China Big Data Analytics in AgricultureValue & Volume, 2023-2030
Figure 97: China GDP and Population, 2023-2030 ($)
Figure 98: China GDP – Composition of 2023, By Sector of Origin
Figure 99: China Export and Import Value & Volume, 2023-2030 ($)Big Data Analytics in AgricultureChina Export and Import Value & Volume, 2023-2030 ($)
Figure 100: Australia Big Data Analytics in Agriculture Value & Volume, 2023-2030 ($)
Figure 101: Australia GDP and Population, 2023-2030 ($)
Figure 102: Australia GDP – Composition of 2023, By Sector of Origin
Figure 103: Australia Export and Import Value & Volume, 2023-2030 ($)
Figure 104: South Korea Big Data Analytics in Agriculture Value & Volume, 2023-2030 ($)
Figure 105: South Korea GDP and Population, 2023-2030 ($)
Figure 106: South Korea GDP – Composition of 2023, By Sector of Origin
Figure 107: South Korea Export and Import Value & Volume, 2023-2030 ($)
Figure 108: India Big Data Analytics in Agriculture Value & Volume, 2023-2030 ($)
Figure 109: India GDP and Population, 2023-2030 ($)
Figure 110: India GDP – Composition of 2023, By Sector of Origin
Figure 111: India Export and Import Value & Volume, 2023-2030 ($)
Figure 112: Taiwan Big Data Analytics in Agriculture Taiwan 3D Printing Market Value & Volume, 2023-2030 ($)
Figure 113: Taiwan GDP and Population, 2023-2030 ($)
Figure 114: Taiwan GDP – Composition of 2023, By Sector of Origin
Figure 115: Taiwan Export and Import Value & Volume, 2023-2030 ($)
Figure 116: Malaysia Big Data Analytics in Agriculture Malaysia 3D Printing Market Value & Volume, 2023-2030 ($)
Figure 117: Malaysia GDP and Population, 2023-2030 ($)
Figure 118: Malaysia GDP – Composition of 2023, By Sector of Origin
Figure 119: Malaysia Export and Import Value & Volume, 2023-2030 ($)
Figure 120: Hong Kong Big Data Analytics in Agriculture Hong Kong 3D Printing Market Value & Volume, 2023-2030 ($)
Figure 121: Hong Kong GDP and Population, 2023-2030 ($)
Figure 122: Hong Kong GDP – Composition of 2023, By Sector of Origin
Figure 123: Hong Kong Export and Import Value & Volume, 2023-2030 ($)
Figure 124: Middle East & Africa Big Data Analytics in Agriculture Middle East & Africa 3D Printing Market Value & Volume, 2023-2030 ($)
Figure 125: Russia Big Data Analytics in Agriculture Russia 3D Printing Market Value & Volume, 2023-2030 ($)
Figure 126: Russia GDP and Population, 2023-2030 ($)
Figure 127: Russia GDP – Composition of 2023, By Sector of Origin
Figure 128: Russia Export and Import Value & Volume, 2023-2030 ($)
Figure 129: Israel Big Data Analytics in Agriculture Value & Volume, 2023-2030 ($)
Figure 130: Israel GDP and Population, 2023-2030 ($)
Figure 131: Israel GDP – Composition of 2023, By Sector of Origin
Figure 132: Israel Export and Import Value & Volume, 2023-2030 ($)
Figure 133: Entropy Share, By Strategies, 2023-2030* (%)Big Data Analytics in Agriculture
Figure 134: Developments, 2023-2030*Big Data Analytics in Agriculture
Figure 135: Company 1 Big Data Analytics in Agriculture Net Revenue, By Years, 2023-2030* ($)
Figure 136: Company 1 Big Data Analytics in Agriculture Net Revenue Share, By Business segments, 2023 (%)
Figure 137: Company 1 Big Data Analytics in Agriculture Net Sales Share, By Geography, 2023 (%)
Figure 138: Company 2 Big Data Analytics in Agriculture Net Revenue, By Years, 2023-2030* ($)
Figure 139: Company 2 Big Data Analytics in Agriculture Net Revenue Share, By Business segments, 2023 (%)
Figure 140: Company 2 Big Data Analytics in Agriculture Net Sales Share, By Geography, 2023 (%)
Figure 141: Company 3Big Data Analytics in Agriculture Net Revenue, By Years, 2023-2030* ($)
Figure 142: Company 3Big Data Analytics in Agriculture Net Revenue Share, By Business segments, 2023 (%)
Figure 143: Company 3Big Data Analytics in Agriculture Net Sales Share, By Geography, 2023 (%)
Figure 144: Company 4 Big Data Analytics in Agriculture Net Revenue, By Years, 2023-2030* ($)
Figure 145: Company 4 Big Data Analytics in Agriculture Net Revenue Share, By Business segments, 2023 (%)
Figure 146: Company 4 Big Data Analytics in Agriculture Net Sales Share, By Geography, 2023 (%)
Figure 147: Company 5 Big Data Analytics in Agriculture Net Revenue, By Years, 2023-2030* ($)
Figure 148: Company 5 Big Data Analytics in Agriculture Net Revenue Share, By Business segments, 2023 (%)
Figure 149: Company 5 Big Data Analytics in Agriculture Net Sales Share, By Geography, 2023 (%)
Figure 150: Company 6 Big Data Analytics in Agriculture Net Revenue, By Years, 2023-2030* ($)
Figure 151: Company 6 Big Data Analytics in Agriculture Net Revenue Share, By Business segments, 2023 (%)
Figure 152: Company 6 Big Data Analytics in Agriculture Net Sales Share, By Geography, 2023 (%)
Figure 153: Company 7 Big Data Analytics in Agriculture Net Revenue, By Years, 2023-2030* ($)
Figure 154: Company 7 Big Data Analytics in Agriculture Net Revenue Share, By Business segments, 2023 (%)
Figure 155: Company 7 Big Data Analytics in Agriculture Net Sales Share, By Geography, 2023 (%)
Figure 156: Company 8 Big Data Analytics in Agriculture Net Revenue, By Years, 2023-2030* ($)
Figure 157: Company 8 Big Data Analytics in Agriculture Net Revenue Share, By Business segments, 2023 (%)
Figure 158: Company 8 Big Data Analytics in Agriculture Net Sales Share, By Geography, 2023 (%)
Figure 159: Company 9 Big Data Analytics in Agriculture Net Revenue, By Years, 2023-2030* ($)
Figure 160: Company 9 Big Data Analytics in Agriculture Net Revenue Share, By Business segments, 2023 (%)
Figure 161: Company 9 Big Data Analytics in Agriculture Net Sales Share, By Geography, 2023 (%)
Figure 162: Company 10 Big Data Analytics in Agriculture Net Revenue, By Years, 2023-2030* ($)
Figure 163: Company 10 Big Data Analytics in Agriculture Net Revenue Share, By Business segments, 2023 (%)
Figure 164: Company 10 Big Data Analytics in Agriculture Net Sales Share, By Geography, 2023 (%)
Figure 165: Company 11 Big Data Analytics in Agriculture Net Revenue, By Years, 2023-2030* ($)
Figure 166: Company 11 Big Data Analytics in Agriculture Net Revenue Share, By Business segments, 2023 (%)
Figure 167: Company 11 Big Data Analytics in Agriculture Net Sales Share, By Geography, 2023 (%)
Figure 168: Company 12 Big Data Analytics in Agriculture Net Revenue, By Years, 2023-2030* ($)
Figure 169: Company 12 Big Data Analytics in Agriculture Net Revenue Share, By Business segments, 2023 (%)
Figure 170: Company 12 Big Data Analytics in Agriculture Net Sales Share, By Geography, 2023 (%)
Figure 171: Company 13Big Data Analytics in Agriculture Net Revenue, By Years, 2023-2030* ($)
Figure 172: Company 13Big Data Analytics in Agriculture Net Revenue Share, By Business segments, 2023 (%)
Figure 173: Company 13Big Data Analytics in Agriculture Net Sales Share, By Geography, 2023 (%)
Figure 174: Company 14 Big Data Analytics in Agriculture Net Revenue, By Years, 2023-2030* ($)
Figure 175: Company 14 Big Data Analytics in Agriculture Net Revenue Share, By Business segments, 2023 (%)
Figure 176: Company 14 Big Data Analytics in Agriculture Net Sales Share, By Geography, 2023 (%)
Figure 177: Company 15 Big Data Analytics in Agriculture Net Revenue, By Years, 2023-2030* ($)
Figure 178: Company 15 Big Data Analytics in Agriculture Net Revenue Share, By Business segments, 2023 (%)
Figure 179: Company 15 Big Data Analytics in Agriculture Net Sales Share, By Geography, 2023 (%)