 Email
Email Print
Print


Food Biodegradable Packaging Market - Forecast(2025 - 2031)
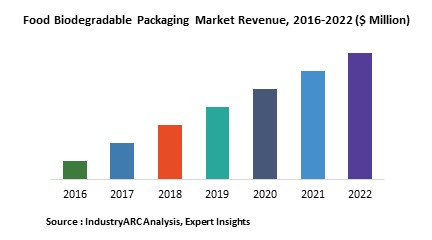
Biodegradable packaging is plant-based and is harvested directly from nature. It does not contain harmful chemicals and plastic coatings and thus are completely decomposable with the aid of microorganisms, when placed in a composting area. Growing demand for sustainable and recyclable packaging is thus driving the food biodegradable market globally. Developments in biodegradable materials, rising consumer awareness on environmental issues and stringent regulations are other major factors enhancing the market growth. Biodegradable plastics are thus poised to replace conventional non-biodegradable plastics used as raw materials for packaging. Food biodegradable packing market is poised to witness growth of XX% CAGR during the forecast period to reach revenue of $XXm by 2021.
The global food biodegradable packing market is analyzed based on application such as dairy products, bakery & confectionery, convenience food, fruits & vegetables, meat, fish, & poultry sauces, dressings & condiments. The market is also segmented on basis of material, which includes paper and plastic. The food biodegradable packing market size is analyzed based on the geographic regions including Americas, Europe, APAC and Rest of the World (RoW). The market is further segmented on the basis of the key countries in the region.
Global food biodegradable packaging market is fragmented market with the presence of significant number of players.
Sample Companies Profiled in this Report are:
Key development strategies adopted by major players in the biodegradable packing market are acquisition and joint venture.
The global food biodegradable packing market is analyzed based on application such as dairy products, bakery & confectionery, convenience food, fruits & vegetables, meat, fish, & poultry sauces, dressings & condiments. The market is also segmented on basis of material, which includes paper and plastic. The food biodegradable packing market size is analyzed based on the geographic regions including Americas, Europe, APAC and Rest of the World (RoW). The market is further segmented on the basis of the key countries in the region.
Global food biodegradable packaging market is fragmented market with the presence of significant number of players.
Sample Companies Profiled in this Report are:
- BASF SE (Germany)
- Be Green Packaging LLC (California)
- BioPak Pty Ltd (Australia)
- International Paper Co (U.S.)
- Mondi Plc (Austria).
- 10+.
Key development strategies adopted by major players in the biodegradable packing market are acquisition and joint venture.
1. Food Biodegradable Packaging Market - Overview
1.1. Definitions and Scope
2. Food Biodegradable Packaging Market - Executive summary
2.1. Market Revenue, Market Size and Key Trends by Company
2.2. Key Trends by type of Application
2.3. Key Trends segmented by Geography
3. Food Biodegradable Packaging Market
3.1. Comparative analysis
3.1.1. Product Benchmarking - Top 10 companies
3.1.2. Top 5 Financials Analysis
3.1.3. Market Value split by Top 10 companies
3.1.4. Patent Analysis - Top 10 companies
3.1.5. Pricing Analysis
4. Food Biodegradable Packaging Market – Startup companies Scenario Premium
4.1. Top 10 startup company Analysis by
4.1.1. Investment
4.1.2. Revenue
4.1.3. Market Shares
4.1.4. Market Size and Application Analysis
4.1.5. Venture Capital and Funding Scenario
5. Food Biodegradable Packaging Market – Industry Market Entry Scenario Premium
5.1. Regulatory Framework Overview
5.2. New Business and Ease of Doing business index
5.3. Case studies of successful ventures
5.4. Customer Analysis – Top 10 companies
6. Food Biodegradable Packaging Market Forces
6.1. Drivers
6.2. Constraints
6.3. Challenges
6.4. Porters five force model
6.4.1. Bargaining power of suppliers
6.4.2. Bargaining powers of customers
6.4.3. Threat of new entrants
6.4.4. Rivalry among existing players
6.4.5. Threat of substitutes
7. Food Biodegradable Packaging Market - Strategic analysis
7.1. Value chain analysis
7.2. Opportunities analysis
7.3. Product life cycle
7.4. Suppliers and distributors Market Share
8. Food Biodegradable Packaging Market – Type of Category 1 (Market Size -$Million / $Billion)
8.1. Market Size and Market Share Analysis
8.2. Application Revenue and Trend Research
8.3. Product Segment Analysis
8.3.1. Plastics
Polyhydroxyalkanoates (PHA)
Polylactic Acid (PLA)
Polyhydroxybutyrate (PHB)
Cellulose
Starch-based Plastics
8.3.2. Paper
8.3.2.1. Flexible Paper
8.3.2.2. Kraft
8.3.2.3. Boxboard
8.3.2.4. Corrugated Board
8.3.3. Others
9. Food Biodegradable Packaging Market – By Application (Market Size -$Million / $Billion)
9.1. Dairy Products
9.2. Bakery & Confectionery
9.3. Bakery & Confectionery
9.3.1. Fruits & Vegetables
9.3.2. Meat, Fish, & Poultry
9.3.3. Sauces, Dressings & Condiments
9.3.4. Others
10. Food Biodegradable Packaging - By Geography (Market Size -$Million / $Billion)
10.1. Food Biodegradable Packaging Market - North America Segment Research
10.2. North America Market Research (Million / $Billion)
10.2.1. Segment type Size and Market Size Analysis
10.2.2. Revenue and Trends
10.2.3. Application Revenue and Trends by type of Application
10.2.4. Company Revenue and Product Analysis
10.2.5. North America Product type and Application Market Size
10.2.5.1. U.S.
10.2.5.2. Canada
10.2.5.3. Mexico
10.2.5.4. Rest of North America
10.3. Food Biodegradable Packaging - South America Segment Research
10.4. South America Market Research (Market Size -$Million / $Billion)
10.4.1. Segment type Size and Market Size Analysis
10.4.2. Revenue and Trends
10.4.3. Application Revenue and Trends by type of Application
10.4.4. Company Revenue and Product Analysis
10.4.5. South America Product type and Application Market Size
10.4.5.1. Brazil
10.4.5.2. Venezuela
10.4.5.3. Argentina
10.4.5.4. Ecuador
10.4.5.5. Peru
10.4.5.6. Colombia
10.4.5.7. Costa Rica
10.4.5.8. Rest of South America
10.5. Food Biodegradable Packaging - Europe Segment Research
10.6. Europe Market Research (Market Size -$Million / $Billion)
10.6.1. Segment type Size and Market Size Analysis
10.6.2. Revenue and Trends
10.6.3. Application Revenue and Trends by type of Application
10.6.4. Company Revenue and Product Analysis
10.6.5. Europe Segment Product type and Application Market Size
10.6.5.1. U.K
10.6.5.2. Germany
10.6.5.3. Italy
10.6.5.4. France
10.6.5.5. Netherlands
10.6.5.6. Belgium
10.6.5.7. Spain
10.6.5.8. Denmark
10.6.5.9. Rest of Europe
10.7. Food Biodegradable Packaging – APAC Segment Research
10.8. APAC Market Research (Market Size -$Million / $Billion)
10.8.1. Segment type Size and Market Size Analysis
10.8.2. Revenue and Trends
10.8.3. Application Revenue and Trends by type of Application
10.8.4. Company Revenue and Product Analysis
10.8.5. APAC Segment – Product type and Application Market Size
10.8.5.1. China
10.8.5.2. Australia
10.8.5.3. Japan
10.8.5.4. South Korea
10.8.5.5. India
10.8.5.6. Taiwan
10.8.5.7. Malaysia
11. Food Biodegradable Packaging Market - Entropy
11.1. New product launches
11.2. M&A's, collaborations, JVs and partnerships
12. Food Biodegradable Packaging Market – Industry / Segment Competition landscape Premium
12.1. Market Share Analysis
12.1.1. Market Share by Country- Top companies
12.1.2. Market Share by Region- Top 10 companies
12.1.3. Market Share by type of Application – Top 10 companies
12.1.4. Market Share by type of Product / Product category- Top 10 companies
12.1.5. Market Share at global level- Top 10 companies
12.1.6. Best Practises for companies
13. Food Biodegradable Packaging Market – Key Company List by Country Premium
14. Food Biodegradable Packaging Market Company Analysis
14.1. Market Share, Company Revenue, Products, M&A, Developments
14.2. BASF SE (Germany)
14.3. Be Green Packaging LLC (California)
14.4. BioPak Pty Ltd (Australia)
14.5. International Paper Co (U.S.)
14.6. Mondi Plc (Austria).
14.7. Company 6
14.8. Company 7
14.9. Company 8
14.10. Company 9
14.11. Company 10 and more
"*Financials would be provided on a best efforts basis for private companies"
15. Food Biodegradable Packaging Market - Appendix
15.1. Abbreviations
15.2. Sources
16. Food Biodegradable Packaging Market - Methodology
16.1. Research Methodology
16.1.1. Company Expert Interviews
16.1.2. Industry Databases
16.1.3. Associations
16.1.4. Company News
16.1.5. Company Annual Reports
16.1.6. Application Trends
16.1.7. New Products and Product database
16.1.8. Company Transcripts
16.1.9. R&D Trends
16.1.10. Key Opinion Leaders Interviews
16.1.11. Supply and Demand Trends
List of Tables
Table 1 Food Biodegradable Packaging Market Overview 2023-2030
Table 2 Food Biodegradable Packaging Market Leader Analysis 2023-2030 (US$)
Table 3 Food Biodegradable Packaging MarketProduct Analysis 2023-2030 (US$)
Table 4 Food Biodegradable Packaging MarketEnd User Analysis 2023-2030 (US$)
Table 5 Food Biodegradable Packaging MarketPatent Analysis 2013-2023* (US$)
Table 6 Food Biodegradable Packaging MarketFinancial Analysis 2023-2030 (US$)
Table 7 Food Biodegradable Packaging Market Driver Analysis 2023-2030 (US$)
Table 8 Food Biodegradable Packaging MarketChallenges Analysis 2023-2030 (US$)
Table 9 Food Biodegradable Packaging MarketConstraint Analysis 2023-2030 (US$)
Table 10 Food Biodegradable Packaging Market Supplier Bargaining Power Analysis 2023-2030 (US$)
Table 11 Food Biodegradable Packaging Market Buyer Bargaining Power Analysis 2023-2030 (US$)
Table 12 Food Biodegradable Packaging Market Threat of Substitutes Analysis 2023-2030 (US$)
Table 13 Food Biodegradable Packaging Market Threat of New Entrants Analysis 2023-2030 (US$)
Table 14 Food Biodegradable Packaging Market Degree of Competition Analysis 2023-2030 (US$)
Table 15 Food Biodegradable Packaging MarketValue Chain Analysis 2023-2030 (US$)
Table 16 Food Biodegradable Packaging MarketPricing Analysis 2023-2030 (US$)
Table 17 Food Biodegradable Packaging MarketOpportunities Analysis 2023-2030 (US$)
Table 18 Food Biodegradable Packaging MarketProduct Life Cycle Analysis 2023-2030 (US$)
Table 19 Food Biodegradable Packaging MarketSupplier Analysis 2023-2030 (US$)
Table 20 Food Biodegradable Packaging MarketDistributor Analysis 2023-2030 (US$)
Table 21 Food Biodegradable Packaging Market Trend Analysis 2023-2030 (US$)
Table 22 Food Biodegradable Packaging Market Size 2023 (US$)
Table 23 Food Biodegradable Packaging Market Forecast Analysis 2023-2030 (US$)
Table 24 Food Biodegradable Packaging Market Sales Forecast Analysis 2023-2030 (Units)
Table 25 Food Biodegradable Packaging Market, Revenue & Volume,By Material, 2023-2030 ($)
Table 26 Food Biodegradable Packaging MarketBy Material, Revenue & Volume,By Plastics, 2023-2030 ($)
Table 27 Food Biodegradable Packaging MarketBy Material, Revenue & Volume,By Paper, 2023-2030 ($)
Table 28 Food Biodegradable Packaging Market, Revenue & Volume,By Application, 2023-2030 ($)
Table 29 Food Biodegradable Packaging MarketBy Application, Revenue & Volume,By Dairy Products , 2023-2030 ($)
Table 30 Food Biodegradable Packaging MarketBy Application, Revenue & Volume,By Bakery & Confectionery, 2023-2030 ($)
Table 31 Food Biodegradable Packaging MarketBy Application, Revenue & Volume,By Convenience Food, 2023-2030 ($)
Table 32 Food Biodegradable Packaging MarketBy Application, Revenue & Volume,By Fruits & Vegetables, 2023-2030 ($)
Table 33 Food Biodegradable Packaging MarketBy Application, Revenue & Volume,By Meat, Fish, & Poultry, 2023-2030 ($)
Table 34 North America Food Biodegradable Packaging Market, Revenue & Volume,By Material, 2023-2030 ($)
Table 35 North America Food Biodegradable Packaging Market, Revenue & Volume,By Application, 2023-2030 ($)
Table 36 South america Food Biodegradable Packaging Market, Revenue & Volume,By Material, 2023-2030 ($)
Table 37 South america Food Biodegradable Packaging Market, Revenue & Volume,By Application, 2023-2030 ($)
Table 38 Europe Food Biodegradable Packaging Market, Revenue & Volume,By Material, 2023-2030 ($)
Table 39 Europe Food Biodegradable Packaging Market, Revenue & Volume,By Application, 2023-2030 ($)
Table 40 APAC Food Biodegradable Packaging Market, Revenue & Volume,By Material, 2023-2030 ($)
Table 41 APAC Food Biodegradable Packaging Market, Revenue & Volume,By Application, 2023-2030 ($)
Table 42 Middle East & Africa Food Biodegradable Packaging Market, Revenue & Volume,By Material, 2023-2030 ($)
Table 43 Middle East & Africa Food Biodegradable Packaging Market, Revenue & Volume,By Application, 2023-2030 ($)
Table 44 Russia Food Biodegradable Packaging Market, Revenue & Volume,By Material, 2023-2030 ($)
Table 45 Russia Food Biodegradable Packaging Market, Revenue & Volume,By Application, 2023-2030 ($)
Table 46 Israel Food Biodegradable Packaging Market, Revenue & Volume,By Material, 2023-2030 ($)
Table 47 Israel Food Biodegradable Packaging Market, Revenue & Volume,By Application, 2023-2030 ($)
Table 48 Top Companies 2023 (US$)Food Biodegradable Packaging Market, Revenue & Volume,,
Table 49 Product Launch 2023-2030Food Biodegradable Packaging Market, Revenue & Volume,,
Table 50 Mergers & Acquistions 2023-2030Food Biodegradable Packaging Market, Revenue & Volume,,
List of Figures
Figure 1 Overview of Food Biodegradable Packaging Market 2023-2030
Figure 2 Market Share Analysis for Food Biodegradable Packaging Market 2023 (US$)
Figure 3 Product Comparison in Food Biodegradable Packaging Market 2023-2030 (US$)
Figure 4 End User Profile for Food Biodegradable Packaging Market 2023-2030 (US$)
Figure 5 Patent Application and Grant in Food Biodegradable Packaging Market 2013-2023* (US$)
Figure 6 Top 5 Companies Financial Analysis in Food Biodegradable Packaging Market 2023-2030 (US$)
Figure 7 Market Entry Strategy in Food Biodegradable Packaging Market 2023-2030
Figure 8 Ecosystem Analysis in Food Biodegradable Packaging Market2023
Figure 9 Average Selling Price in Food Biodegradable Packaging Market 2023-2030
Figure 10 Top Opportunites in Food Biodegradable Packaging Market 2023-2030
Figure 11 Market Life Cycle Analysis in Food Biodegradable Packaging Market
Figure 12 GlobalBy MaterialFood Biodegradable Packaging Market Revenue, 2023-2030 ($)
Figure 13 GlobalBy ApplicationFood Biodegradable Packaging Market Revenue, 2023-2030 ($)
Figure 14 Global Food Biodegradable Packaging Market - By Geography
Figure 15 Global Food Biodegradable Packaging Market Value & Volume, By Geography, 2023-2030 ($)
Figure 16 Global Food Biodegradable Packaging Market CAGR, By Geography, 2023-2030 (%)
Figure 17 North America Food Biodegradable Packaging Market Value & Volume, 2023-2030 ($)
Figure 18 US Food Biodegradable Packaging Market Value & Volume, 2023-2030 ($)
Figure 19 US GDP and Population, 2023-2030 ($)
Figure 20 US GDP – Composition of 2023, By Sector of Origin
Figure 21 US Export and Import Value & Volume, 2023-2030 ($)
Figure 22 Canada Food Biodegradable Packaging Market Value & Volume, 2023-2030 ($)
Figure 23 Canada GDP and Population, 2023-2030 ($)
Figure 24 Canada GDP – Composition of 2023, By Sector of Origin
Figure 25 Canada Export and Import Value & Volume, 2023-2030 ($)
Figure 26 Mexico Food Biodegradable Packaging Market Value & Volume, 2023-2030 ($)
Figure 27 Mexico GDP and Population, 2023-2030 ($)
Figure 28 Mexico GDP – Composition of 2023, By Sector of Origin
Figure 29 Mexico Export and Import Value & Volume, 2023-2030 ($)
Figure 30 South America Food Biodegradable Packaging MarketSouth America 3D Printing Market Value & Volume, 2023-2030 ($)
Figure 31 Brazil Food Biodegradable Packaging Market Value & Volume, 2023-2030 ($)
Figure 32 Brazil GDP and Population, 2023-2030 ($)
Figure 33 Brazil GDP – Composition of 2023, By Sector of Origin
Figure 34 Brazil Export and Import Value & Volume, 2023-2030 ($)
Figure 35 Venezuela Food Biodegradable Packaging Market Value & Volume, 2023-2030 ($)
Figure 36 Venezuela GDP and Population, 2023-2030 ($)
Figure 37 Venezuela GDP – Composition of 2023, By Sector of Origin
Figure 38 Venezuela Export and Import Value & Volume, 2023-2030 ($)
Figure 39 Argentina Food Biodegradable Packaging Market Value & Volume, 2023-2030 ($)
Figure 40 Argentina GDP and Population, 2023-2030 ($)
Figure 41 Argentina GDP – Composition of 2023, By Sector of Origin
Figure 42 Argentina Export and Import Value & Volume, 2023-2030 ($)
Figure 43 Ecuador Food Biodegradable Packaging Market Value & Volume, 2023-2030 ($)
Figure 44 Ecuador GDP and Population, 2023-2030 ($)
Figure 45 Ecuador GDP – Composition of 2023, By Sector of Origin
Figure 46 Ecuador Export and Import Value & Volume, 2023-2030 ($)
Figure 47 Peru Food Biodegradable Packaging Market Value & Volume, 2023-2030 ($)
Figure 48 Peru GDP and Population, 2023-2030 ($)
Figure 49 Peru GDP – Composition of 2023, By Sector of Origin
Figure 50 Peru Export and Import Value & Volume, 2023-2030 ($)
Figure 51 Colombia Food Biodegradable Packaging Market Value & Volume, 2023-2030 ($)
Figure 52 Colombia GDP and Population, 2023-2030 ($)
Figure 53 Colombia GDP – Composition of 2023, By Sector of Origin
Figure 54 Colombia Export and Import Value & Volume, 2023-2030 ($)
Figure 55 Costa Rica Food Biodegradable Packaging MarketCosta Rica 3D Printing Market Value & Volume, 2023-2030 ($)
Figure 56 Costa Rica GDP and Population, 2023-2030 ($)
Figure 57 Costa Rica GDP – Composition of 2023, By Sector of Origin
Figure 58 Costa Rica Export and Import Value & Volume, 2023-2030 ($)
Figure 59 Europe Food Biodegradable Packaging Market Value & Volume, 2023-2030 ($)
Figure 60 U.K Food Biodegradable Packaging Market Value & Volume, 2023-2030 ($)
Figure 61 U.K GDP and Population, 2023-2030 ($)
Figure 62 U.K GDP – Composition of 2023, By Sector of Origin
Figure 63 U.K Export and Import Value & Volume, 2023-2030 ($)
Figure 64 Germany Food Biodegradable Packaging Market Value & Volume, 2023-2030 ($)
Figure 65 Germany GDP and Population, 2023-2030 ($)
Figure 66 Germany GDP – Composition of 2023, By Sector of Origin
Figure 67 Germany Export and Import Value & Volume, 2023-2030 ($)
Figure 68 Italy Food Biodegradable Packaging Market Value & Volume, 2023-2030 ($)
Figure 69 Italy GDP and Population, 2023-2030 ($)
Figure 70 Italy GDP – Composition of 2023, By Sector of Origin
Figure 71 Italy Export and Import Value & Volume, 2023-2030 ($)
Figure 72 France Food Biodegradable Packaging Market Value & Volume, 2023-2030 ($)
Figure 73 France GDP and Population, 2023-2030 ($)
Figure 74 France GDP – Composition of 2023, By Sector of Origin
Figure 75 France Export and Import Value & Volume, 2023-2030 ($)
Figure 76 Netherlands Food Biodegradable Packaging Market Value & Volume, 2023-2030 ($)
Figure 77 Netherlands GDP and Population, 2023-2030 ($)
Figure 78 Netherlands GDP – Composition of 2023, By Sector of Origin
Figure 79 Netherlands Export and Import Value & Volume, 2023-2030 ($)
Figure 80 Belgium Food Biodegradable Packaging Market Value & Volume, 2023-2030 ($)
Figure 81 Belgium GDP and Population, 2023-2030 ($)
Figure 82 Belgium GDP – Composition of 2023, By Sector of Origin
Figure 83 Belgium Export and Import Value & Volume, 2023-2030 ($)
Figure 84 Spain Food Biodegradable Packaging Market Value & Volume, 2023-2030 ($)
Figure 85 Spain GDP and Population, 2023-2030 ($)
Figure 86 Spain GDP – Composition of 2023, By Sector of Origin
Figure 87 Spain Export and Import Value & Volume, 2023-2030 ($)
Figure 88 Denmark Food Biodegradable Packaging Market Value & Volume, 2023-2030 ($)
Figure 89 Denmark GDP and Population, 2023-2030 ($)
Figure 90 Denmark GDP – Composition of 2023, By Sector of Origin
Figure 91 Denmark Export and Import Value & Volume, 2023-2030 ($)
Figure 92 APAC Food Biodegradable Packaging Market Value & Volume, 2023-2030 ($)
Figure 93 China Food Biodegradable Packaging MarketValue & Volume, 2023-2030
Figure 94 China GDP and Population, 2023-2030 ($)
Figure 95 China GDP – Composition of 2023, By Sector of Origin
Figure 96 China Export and Import Value & Volume, 2023-2030 ($)Food Biodegradable Packaging MarketChina Export and Import Value & Volume, 2023-2030 ($)
Figure 97 Australia Food Biodegradable Packaging Market Value & Volume, 2023-2030 ($)
Figure 98 Australia GDP and Population, 2023-2030 ($)
Figure 99 Australia GDP – Composition of 2023, By Sector of Origin
Figure 100 Australia Export and Import Value & Volume, 2023-2030 ($)
Figure 101 South Korea Food Biodegradable Packaging Market Value & Volume, 2023-2030 ($)
Figure 102 South Korea GDP and Population, 2023-2030 ($)
Figure 103 South Korea GDP – Composition of 2023, By Sector of Origin
Figure 104 South Korea Export and Import Value & Volume, 2023-2030 ($)
Figure 105 India Food Biodegradable Packaging Market Value & Volume, 2023-2030 ($)
Figure 106 India GDP and Population, 2023-2030 ($)
Figure 107 India GDP – Composition of 2023, By Sector of Origin
Figure 108 India Export and Import Value & Volume, 2023-2030 ($)
Figure 109 Taiwan Food Biodegradable Packaging MarketTaiwan 3D Printing Market Value & Volume, 2023-2030 ($)
Figure 110 Taiwan GDP and Population, 2023-2030 ($)
Figure 111 Taiwan GDP – Composition of 2023, By Sector of Origin
Figure 112 Taiwan Export and Import Value & Volume, 2023-2030 ($)
Figure 113 Malaysia Food Biodegradable Packaging MarketMalaysia 3D Printing Market Value & Volume, 2023-2030 ($)
Figure 114 Malaysia GDP and Population, 2023-2030 ($)
Figure 115 Malaysia GDP – Composition of 2023, By Sector of Origin
Figure 116 Malaysia Export and Import Value & Volume, 2023-2030 ($)
Figure 117 Hong Kong Food Biodegradable Packaging MarketHong Kong 3D Printing Market Value & Volume, 2023-2030 ($)
Figure 118 Hong Kong GDP and Population, 2023-2030 ($)
Figure 119 Hong Kong GDP – Composition of 2023, By Sector of Origin
Figure 120 Hong Kong Export and Import Value & Volume, 2023-2030 ($)
Figure 121 Middle East & Africa Food Biodegradable Packaging MarketMiddle East & Africa 3D Printing Market Value & Volume, 2023-2030 ($)
Figure 122 Russia Food Biodegradable Packaging MarketRussia 3D Printing Market Value & Volume, 2023-2030 ($)
Figure 123 Russia GDP and Population, 2023-2030 ($)
Figure 124 Russia GDP – Composition of 2023, By Sector of Origin
Figure 125 Russia Export and Import Value & Volume, 2023-2030 ($)
Figure 126 Israel Food Biodegradable Packaging Market Value & Volume, 2023-2030 ($)
Figure 127 Israel GDP and Population, 2023-2030 ($)
Figure 128 Israel GDP – Composition of 2023, By Sector of Origin
Figure 129 Israel Export and Import Value & Volume, 2023-2030 ($)
Figure 130 Entropy Share, By Strategies, 2023-2030* (%)Food Biodegradable Packaging Market
Figure 131 Developments, 2023-2030*Food Biodegradable Packaging Market
Figure 132 Company 1 Food Biodegradable Packaging Market Net Revenue, By Years, 2023-2030* ($)
Figure 133 Company 1 Food Biodegradable Packaging Market Net Revenue Share, By Business segments, 2023 (%)
Figure 134 Company 1 Food Biodegradable Packaging Market Net Sales Share, By Geography, 2023 (%)
Figure 135 Company 2 Food Biodegradable Packaging Market Net Revenue, By Years, 2023-2030* ($)
Figure 136 Company 2 Food Biodegradable Packaging Market Net Revenue Share, By Business segments, 2023 (%)
Figure 137 Company 2 Food Biodegradable Packaging Market Net Sales Share, By Geography, 2023 (%)
Figure 138 Company 3Food Biodegradable Packaging Market Net Revenue, By Years, 2023-2030* ($)
Figure 139 Company 3Food Biodegradable Packaging Market Net Revenue Share, By Business segments, 2023 (%)
Figure 140 Company 3Food Biodegradable Packaging Market Net Sales Share, By Geography, 2023 (%)
Figure 141 Company 4 Food Biodegradable Packaging Market Net Revenue, By Years, 2023-2030* ($)
Figure 142 Company 4 Food Biodegradable Packaging Market Net Revenue Share, By Business segments, 2023 (%)
Figure 143 Company 4 Food Biodegradable Packaging Market Net Sales Share, By Geography, 2023 (%)
Figure 144 Company 5 Food Biodegradable Packaging Market Net Revenue, By Years, 2023-2030* ($)
Figure 145 Company 5 Food Biodegradable Packaging Market Net Revenue Share, By Business segments, 2023 (%)
Figure 146 Company 5 Food Biodegradable Packaging Market Net Sales Share, By Geography, 2023 (%)
Figure 147 Company 6 Food Biodegradable Packaging Market Net Revenue, By Years, 2023-2030* ($)
Figure 148 Company 6 Food Biodegradable Packaging Market Net Revenue Share, By Business segments, 2023 (%)
Figure 149 Company 6 Food Biodegradable Packaging Market Net Sales Share, By Geography, 2023 (%)
Figure 150 Company 7 Food Biodegradable Packaging Market Net Revenue, By Years, 2023-2030* ($)
Figure 151 Company 7 Food Biodegradable Packaging Market Net Revenue Share, By Business segments, 2023 (%)
Figure 152 Company 7 Food Biodegradable Packaging Market Net Sales Share, By Geography, 2023 (%)
Figure 153 Company 8 Food Biodegradable Packaging Market Net Revenue, By Years, 2023-2030* ($)
Figure 154 Company 8 Food Biodegradable Packaging Market Net Revenue Share, By Business segments, 2023 (%)
Figure 155 Company 8 Food Biodegradable Packaging Market Net Sales Share, By Geography, 2023 (%)
Figure 156 Company 9 Food Biodegradable Packaging Market Net Revenue, By Years, 2023-2030* ($)
Figure 157 Company 9 Food Biodegradable Packaging Market Net Revenue Share, By Business segments, 2023 (%)
Figure 158 Company 9 Food Biodegradable Packaging Market Net Sales Share, By Geography, 2023 (%)
Figure 159 Company 10 Food Biodegradable Packaging Market Net Revenue, By Years, 2023-2030* ($)
Figure 160 Company 10 Food Biodegradable Packaging Market Net Revenue Share, By Business segments, 2023 (%)
Figure 161 Company 10 Food Biodegradable Packaging Market Net Sales Share, By Geography, 2023 (%)
Figure 162 Company 11 Food Biodegradable Packaging Market Net Revenue, By Years, 2023-2030* ($)
Figure 163 Company 11 Food Biodegradable Packaging Market Net Revenue Share, By Business segments, 2023 (%)
Figure 164 Company 11 Food Biodegradable Packaging Market Net Sales Share, By Geography, 2023 (%)
Figure 165 Company 12 Food Biodegradable Packaging Market Net Revenue, By Years, 2023-2030* ($)
Figure 166 Company 12 Food Biodegradable Packaging Market Net Revenue Share, By Business segments, 2023 (%)
Figure 167 Company 12 Food Biodegradable Packaging Market Net Sales Share, By Geography, 2023 (%)
Figure 168 Company 13Food Biodegradable Packaging Market Net Revenue, By Years, 2023-2030* ($)
Figure 169 Company 13Food Biodegradable Packaging Market Net Revenue Share, By Business segments, 2023 (%)
Figure 170 Company 13Food Biodegradable Packaging Market Net Sales Share, By Geography, 2023 (%)
Figure 171 Company 14 Food Biodegradable Packaging Market Net Revenue, By Years, 2023-2030* ($)
Figure 172 Company 14 Food Biodegradable Packaging Market Net Revenue Share, By Business segments, 2023 (%)
Figure 173 Company 14 Food Biodegradable Packaging Market Net Sales Share, By Geography, 2023 (%)
Figure 174 Company 15 Food Biodegradable Packaging Market Net Revenue, By Years, 2023-2030* ($)
Figure 175 Company 15 Food Biodegradable Packaging Market Net Revenue Share, By Business segments, 2023 (%)
Figure 176 Company 15 Food Biodegradable Packaging Market Net Sales Share, By Geography, 2023 (%)