LIST OF TABLES:
Table 1: Global Natural Fragrance Ingredients Market Revenue, By Type, 2016-2022 ($Million)
Table 2: Global Natural Fragrance Ingredients Market Revenue, By Form, 2016-2022 ($Million)
Table 3: Global Natural Fragrance Ingredients Market Revenue, By Application, 2016-2022 ($Million)
Table 4: Natural Fragrance Ingredients Market Ranking, By Company 2023
Table 5: Natural Fragrance Ingredients Market Value, By Type, 2016-2022 ($Million)
Table 6: Natural Fragrance Ingredients Market Value- Essential Oils, 2016-2022 ($Million)
Table 7: Natural Fragrance Ingredients Market Value- Isolates, 2016-2022 ($Million)
Table 8: Natural Fragrance Ingredients Market Revenue, By Form, 2016-2022 ($Million)
Table 9: Global Natural Fragrance Ingredients Market Revenue, By Application, 2016-2022 ($Million)
Table 10: Global Natural Fragrance Ingredients Market Value, By Region, 2016-2022 ($Million)
Table 11: North Americas Natural Fragrance Ingredients Market Revenue, By Type, 2016-2022 ($Million)
Table 12: North Americas Natural Fragrance Ingredients Market Revenue, By Form, 2016-2022 ($Million)
Table 13: North Americas Natural Fragrance Ingredients Market Revenue, By Application, 2016-2022 ($Million)
Table 14: North Americas Natural Fragrance Ingredients Market Revenue, By Country, 2016-2022 ($Million)
Table 15: Europe Natural Fragrance Ingredients Market Revenue, By Type, 2016-2022 ($Million)
Table 16: Europe Natural Fragrance Ingredients Market Revenue, By Form, 2016-2022 ($Million)
Table 17: Europe Natural Fragrance Ingredients Market Revenue, By Application, 2016-2022 ($Million)
Table 18: Europe Natural Fragrance Ingredients Market Revenue, By Country, 2016-2022 ($Million)
Table 19: Asia-Pacific: Natural Fragrance Ingredients Market Value, By Type, 2016-2022 ($Million)
Table 20: Asia-Pacific: Natural Fragrance Ingredients Market Value, By Form, 2016-2022 ($Million)
Table 21: Asia-Pacific: Natural Fragrance Ingredients Market Value, By Application, 2016-2022 ($Million)
Table 22: Asia-Pacific: Natural Fragrance Ingredients Market Value, By Country, 2016-2022 ($Million)
Table 23: RoW: Natural Fragrance Ingredients Market Value, By Type, 2016-2022 ($Million)
Table 24: RoW: Natural Fragrance Ingredients Market Value, By Form, 2016-2022 ($Million)
Table 25: RoW: Natural Fragrance Ingredients Market Value, By Application, 2016-2022 ($Million)
Table 26: RoW: Natural Fragrance Ingredients Market Value, By Region, 2016-2022 ($Million)
LIST OF FIGURES:
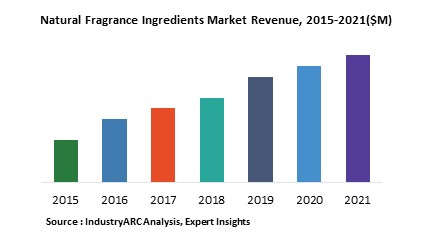
Figure 1: Natural Fragrance Ingredients Market Revenue, By Years, 2016-2022 ($Million)
Figure 2: Natural Fragrance Ingredients Market Revenue, By Region, 2016 and 2022 (%)
Figure 3: Givaudan SA
Figure 4: International Flavors & Fragrances Inc.
Figure 5: Symrise AG
Figure 6: Takasago International Corporation
Figure 7: Natural Fragrance Ingredients: Earnings Per Share, By Company ($), 2016-2022
Figure 8: Natural Fragrance Ingredients Published Patents, 2012-2023*
Figure 9: Natural Fragrance Ingredients Patents Share, By Countries, 2012-2023* (%)
Figure 10: Natural Fragrance Ingredients Share, By Company 1976-2023* (%)
Figure 11: Fragrance Industry Value Chain
Figure 12: Natural Fragrance Ingredients Market Life Cycle Analysis
Figure 13: Natural Fragrance Ingredients Market- Type
Figure 14: Natural Fragrance Ingredients Market- Essential Oils
Figure 15: Natural Fragrance Ingredients Market Value- Orange, 2016-2022 ($Million)
Figure 16: Natural Fragrance Ingredients Market Value- Mentha Arvensis, 2016-2022 ($Million)
Figure 17: Natural Fragrance Ingredients Market Value- Eucalyptus, 2016-2022 ($Million)
Figure 18: Natural Fragrance Ingredients Market Value- Citronella, 2016-2022 ($Million)
Figure 19: Natural Fragrance Ingredients Market Value- Others, 2016-2022 ($Million)
Figure 20: Natural Fragrance Ingredients Market- Isolates
Figure 21: Natural Fragrance Ingredients Market Value- Flowers, 2016-2022 ($Million)
Figure 22: Natural Fragrance Ingredients Market Value- Leaves, 2016-2022 ($Million)
Figure 23: Natural Fragrance Ingredients Market Value- Fruits, 2016-2022 ($Million)
Figure 24: Natural Fragrance Ingredients Market Value- Others, 2016-2022 ($Million)
Figure 25: Liquid: Natural Fragrance Ingredients Market Revenue, 2016-2022 ($Million)
Figure 26: Powder & Crystalline: Natural Fragrance Ingredients Market Revenue, 2016-2022 ($Million)
Figure 27: Households: Global Natural Fragrance Ingredients Market Revenue, By Application, 2016-2022 ($Million)
Figure 28: Cosmetics: Global Natural Fragrance Ingredients Market Revenue, By Application, 2016-2022 ($Million)
Figure 29: Global Natural Fragrance Ingredients Market - By Geography
Figure 30: U.S.: GDP and Population, 2012-2015 ($Trillion, Million)
Figure 31: U.S.: GDP – Composition of 2015, By Sector of Origin
Figure 32: U.S.: Export and Import Value, 2012-2015 ($Trillion)
Figure 33: Canada: GDP and Population, 2012-2015 ($Trillion, Million)
Figure 34: Canada: GDP – Composition of 2015, By Sector of Origin
Figure 35: Canada: Export and Import Value, 2012-2015 ($Billion)
Figure 36: Mexico: GDP and Population, 2012-2015 ($Trillion, Million)
Figure 37: Mexico: GDP – Composition of 2015, By Sector of Origin
Figure 38: Mexico: Export and Import Value, 2012-2015 ($Billion)
Figure 39: U.S.: Natural Fragrance Ingredients Market Revenue, 2016-2022 ($Million)
Figure 40: Canada: Natural Fragrance Ingredients Market Revenue, 2016-2022 ($Million)
Figure 41: Mexico: Natural Fragrance Ingredients Market Revenue, 2016-2022 ($Million)
Figure 42: North America: Natural Fragrance Ingredients Market CAGR, By Country, 2023-2022 (%)
Figure 43: U.K.: GDP and Population, 2012-2015 ($Trillion, Million)
Figure 44: U.K.: GDP – Composition of 2015, By Sector of Origin
Figure 45: U.K.: Export and Import Value, 2012-2015 ($Billion)
Figure 46: Germany: GDP and Population, 2012-2015 ($Trillion, Million)
Figure 47: Germany: GDP – Composition of 2015, By Sector of Origin
Figure 48: Germany: Export and Import Value, 2012-2015 ($Billion)
Figure 49: France: GDP and Population, 2012-2015 ($Trillion, Million)
Figure 50: France: GDP – Composition of 2015, By Sector of Origin
Figure 51: France: Export and Import Value, 2012-2015 ($Billion)
Figure 52: Spain: GDP and Population, 2012-2015 ($Trillion, Million)
Figure 53: Spain: GDP – Composition of 2015, By Sector of Origin
Figure 54: Spain: Export and Import Value, 2012-2015 ($Billion)
Figure 55: Italy: GDP and Population, 2012-2015 ($Trillion, Million)
Figure 56: Italy: GDP – Composition of 2015, By Sector of Origin
Figure 57: Italy: Export and Import Value, 2012-2015 ($Billion)
Figure 58: Germany: Natural Fragrance Ingredients Market Revenue, 2016-2022 ($Million)
Figure 59: U.K.: Natural Fragrance Ingredients Market Revenue, 2016-2022 ($Million)
Figure 60: Spain: Natural Fragrance Ingredients Market Revenue, 2016-2022 ($Million)
Figure 61: France: Natural Fragrance Ingredients Market Revenue, 2016-2022 ($Million)
Figure 62: Italy: Natural Fragrance Ingredients Market Revenue, 2016-2022 ($Million)
Figure 63: Rest of Europe: Natural Fragrance Ingredients Market Revenue, 2016-2022 ($Million)
Figure 64: Europe: Natural Fragrance Ingredients Market CAGR, By Country, 2023-2022 (%)
Figure 65: China: GDP and Population, 2012-2015 ($Trillion, Million)
Figure 66: China: GDP – Composition of 2015, By Sector of Origin
Figure 67: China: Export and Import Value, 2012-2015 ($Billion)
Figure 68: Japan: GDP and Population, 2012-2015 ($Trillion, Million)
Figure 69: Japan: GDP – Composition of 2015, By Sector of Origin
Figure 70: Japan: Export and Import Value, 2012-2015 ($Billion)
Figure 71: South Korea: GDP and Population, 2012-2015 ($Trillion, Million)
Figure 72: South Korea: GDP – Composition of 2015, By Sector of Origin
Figure 73: South Korea: Export and Import Value, 2012-2015 ($Billion)
Figure 74: India: GDP and Population, 2012-2015 ($Trillion, Million)
Figure 75: India: GDP – Composition of 2015, By Sector of Origin
Figure 76: India: Export and Import Value, 2012-2015 ($Billion)
Figure 77: China: Natural Fragrance Ingredients Market Revenue, 2016-2022 ($Million)
Figure 78: Japan: Natural Fragrance Ingredients Market Revenue 2016-2022 ($Million)
Figure 79: India: Natural Fragrance Ingredients Market Revenue 2016-2022 ($Million)
Figure 80: South Korea: Natural Fragrance Ingredients Market Revenue, 2016-2022 ($Million)
Figure 81: Australia & New Zealand: Natural Fragrance Ingredients Market Revenue, 2016-2022 ($Million)
Figure 82: Rest of APAC: Natural Fragrance Ingredients Market Revenue, 2016-2022 ($Million)
Figure 83: APAC: Natural Fragrance Ingredients Market CAGR, By Country, 2023-2022 (%)
Figure 84: Middle East: Natural Fragrance Ingredients Market Revenue, 2016-2022 ($Million)
Figure 85: Africa: Natural Fragrance Ingredients Market Revenue, 2016-2022 ($Million)
Figure 86: South America: Natural Fragrance Ingredients Market Revenue, 2016-2022 ($Million)
Figure 87: RoW: Natural Fragrance Ingredients Market CAGR, By Country 2023-2022 (%)
Figure 88: Global Natural Fragrance Ingredients Market Entropy Share, By Strategies, 2014-2023* (%)
Figure 89: Global Natural Fragrance Ingredients Market Entropy, By Total Number of Developments, 2014-2023*
Figure 90: Givaudan: Net Revenue, 2015-2016 ($Billion)
Figure 91: Givaudan Market Share, By Segment, 2016 (%)
Figure 92: Givaudan Market Share, By Geography, 2016 (%)
Figure 93: International Flavors and Fragrances: Net Sales, 2013-2016 ($Billion)
Figure 94: International Flavors and Fragrances Market Share, By Segment, 2016 (%)
Figure 95: International Flavors & Fragrances Market Share, By Geography, 2016 (%)
Figure 96: Symrise AG: Net Sales, 2013-2016 ($Billion)
Figure 97: Symrise Market Share, By Segment, 2016 (%)
Figure 98: Takasago International Corporation: Net Sales, 2015-2016 ($Billion)
Figure 99: Takasago Inernational Corporation Market Share, By Geography, 2016 (%)
Figure 100: FRUTAROM, Sales, 2013-2016 ($Million)
Figure 101: FRUTAROM, Sales, By Segments, 2016 (%)
Figure 102: FRUTAROM, Sales, By Geography, 2016 (%)
Figure 103: Sensient Technologies Corporation, Sales, 2013-2016 ($Million)
Figure 104: Sensient Technologies Corporation, Sales, By Segments, 2016 (%)
Figure 105: Sensient Technologies Corporation, Sales, By Geography, 2016 (%)
Figure 106: BASF SE, Sales ($Billion), 2013-2016
Figure 107: BASF SE, Sales, By Segments, 2016 (%)
Figure 108: BASF SE, Sales, By Geography,2016 (%)
 Email
Email Print
Print