 Email
Email Print
Print


Personalized Stationery Market - Forecast(2025 - 2031)
Personalized stationery refers to the customized stationery products that are widely used by various corporate companies, hotels, hospitals, educational institutes and so on. Owing to high competition in the market, almost all the companies are using personalized stationery for office use as well as gifting purpose as a marketing strategy. Advances in printing technologies, developments in software, and an increase in the demand from consumers are providing new opportunities for global personalized stationery market.
Global personalized stationery market is analyzed by product types and by end users. On the basis of product types the market is segmented into paper based products, writing & drawing instruments, storage & filing products, office & desk accessories, presentation & planning materials and bags & briefcases. End users of personalized stationery market are classified as business users, small office & home office users, educational institutes and private users.
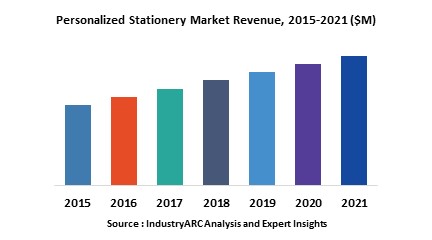
The overall personalized stationery market is also presented from the perspective of different geographic regions and the key countries in each region. North America was a dominant market which held XX% market share in 2015. In Europe, Germany and Switzerland led the market whereas in Asia-Pacific, Japan dominated the market in 2015. Global Personalized stationery market is estimated to grow at a CAGR of XX% during 2016-2021.
Global personalized stationery market is analyzed by product types and by end users. On the basis of product types the market is segmented into paper based products, writing & drawing instruments, storage & filing products, office & desk accessories, presentation & planning materials and bags & briefcases. End users of personalized stationery market are classified as business users, small office & home office users, educational institutes and private users.
The overall personalized stationery market is also presented from the perspective of different geographic regions and the key countries in each region. North America was a dominant market which held XX% market share in 2015. In Europe, Germany and Switzerland led the market whereas in Asia-Pacific, Japan dominated the market in 2015. Global Personalized stationery market is estimated to grow at a CAGR of XX% during 2016-2021.
Sample Companies profiled in this Report are:
- Costa Inc. (U.S.)
- Adveo Group International SA (Spain)
- Canon U.S.A. Inc. (U.S.)
- Groupe Hamelin (France)
- Kokuyo Co. Ltd. (Japan)
- 10+.
For more Consumer Product and Services related reports, please click here
1. Global Personalized Stationery Market Overview
2. Global Personalized Market Executive Summary
3. Global Personalized Stationery Market Landscape
3.1. Market Share Analysis
3.2. Comparative Analysis
3.2.1. Product Benchmarking
3.2.2. Patent Analysis
3.2.3. End User Profiling
3.2.4. Top 5 Financial Analysis
4. Global Personalized Stationery Market Forces
4.1. Market Drivers
4.2. Market Constraints
4.3. Market Challenges
4.4. Industry Attractiveness
4.4.1. Power of Suppliers
4.4.2. Power of Customers
4.4.3. Threat of New Entrants
4.4.4. Threat of Substitutions
4.4.5. Degree of Competition
5. Global Personalized Stationery Market – Strategic Analysis
5.1. Value Chain Analysis
5.2. Pricing Analysis
5.3. Opportunity Analysis
5.4. Product Life Cycle Analysis
5.5. Suppliers And Distributor Analysis
6. Global Personalized Stationery Market – By Product Type
6.1. Paper Based Products
6.1.1. Envelopes
6.1.2. Manuscript Books
6.1.3. Letterheads
6.1.4. Exercise and Analysis Books
6.1.5. Memo
6.1.6. Calendars
6.1.7. Others
6.2. Writing and Drawing Instruments
6.2.1. Pens
6.2.2. Highlighters and Markers
6.2.3. Pencils
6.2.4. Others
6.3. Storage and Filing Products
6.4. Office and Desk Accessories
6.5. Presentation and Planning Materials
6.6. Bags and Briefcases
6.7. Others
7. Global Personalized Stationery Market – By End User
7.1. Business Users
7.2. Small Office and Home Office Users
7.3. Educational Institutes
7.4. Private Users
7.5. Others
8. Global Personalized Stationery Market – By Geography
8.1 North America
8.1.1 U.S.
8.1.2. Canada
8.1.3. Mexico
8.2. Europe
8.2.1. U.K.
8.2.2. Germany
8.2.3. Italy
8.2.4. Switzerland
8.2.5. France
8.2.6. Rest of Europe
8.3. Asia-Pacific
8.3.1. China
8.3.2. South Korea
8.3.3. India
8.3.4. Japan
8.3.5. Australia
8.3.6. New Zealand
8.3.7. Rest of APAC
8.4. RoW
8.4.1. South America
8.4.2. Africa
8.4.3. Middle East
9. Global Personalized Stationery Market Entropy
9.1. New Product Launches
9.2. M&As, JVs, Collaborations & Partnerships
10. Global Personalized Stationery Market - Company Profiles
10.1. Costa Inc. (U.S.)
10.2. Adveo Group International SA (Spain)
10.3. Canon U.S.A. Inc. (U.S.)
10.4. Groupe Hamelin (France)
10.5. Herlitz PBS AG (Germany)
10.6. Kokuyo Co. Ltd. (Japan)
10.7. Newell Rubbermaid Inc. (U.S.)
10.8. Pilot Corporation (Japan)
10.9. Richemont (Switzerland)
10.10. Staples Advantage (U.S.)
*More than 10 Companies are profiled in this Research Report*
"*Financials would be provided on a best efforts basis for private companies"
11. Appendix
11.1. Abbreviations
11.2. Sources
11.3. Research Methodology
11.4. Expert Insights
List of Tables
Table 1 Personalized Stationery Market Overview 2023-2030
Table 2 Personalized Stationery Market Leader Analysis 2023-2030 (US$)
Table 3 Personalized Stationery MarketProduct Analysis 2023-2030 (US$)
Table 4 Personalized Stationery MarketEnd User Analysis 2023-2030 (US$)
Table 5 Personalized Stationery MarketPatent Analysis 2013-2023* (US$)
Table 6 Personalized Stationery MarketFinancial Analysis 2023-2030 (US$)
Table 7 Personalized Stationery Market Driver Analysis 2023-2030 (US$)
Table 8 Personalized Stationery MarketChallenges Analysis 2023-2030 (US$)
Table 9 Personalized Stationery MarketConstraint Analysis 2023-2030 (US$)
Table 10 Personalized Stationery Market Supplier Bargaining Power Analysis 2023-2030 (US$)
Table 11 Personalized Stationery Market Buyer Bargaining Power Analysis 2023-2030 (US$)
Table 12 Personalized Stationery Market Threat of Substitutes Analysis 2023-2030 (US$)
Table 13 Personalized Stationery Market Threat of New Entrants Analysis 2023-2030 (US$)
Table 14 Personalized Stationery Market Degree of Competition Analysis 2023-2030 (US$)
Table 15 Personalized Stationery MarketValue Chain Analysis 2023-2030 (US$)
Table 16 Personalized Stationery MarketPricing Analysis 2023-2030 (US$)
Table 17 Personalized Stationery MarketOpportunities Analysis 2023-2030 (US$)
Table 18 Personalized Stationery MarketProduct Life Cycle Analysis 2023-2030 (US$)
Table 19 Personalized Stationery MarketSupplier Analysis 2023-2030 (US$)
Table 20 Personalized Stationery MarketDistributor Analysis 2023-2030 (US$)
Table 21 Personalized Stationery Market Trend Analysis 2023-2030 (US$)
Table 22 Personalized Stationery Market Size 2023 (US$)
Table 23 Personalized Stationery Market Forecast Analysis 2023-2030 (US$)
Table 24 Personalized Stationery Market Sales Forecast Analysis 2023-2030 (Units)
Table 25 Personalized Stationery Market, Revenue & Volume,By Type, 2023-2030 ($)
Table 26 Personalized Stationery MarketBy Type, Revenue & Volume,By Paper Based Products, 2023-2030 ($)
Table 27 Personalized Stationery MarketBy Type, Revenue & Volume,By Writing and Drawing Instruments, 2023-2030 ($)
Table 28 Personalized Stationery MarketBy Type, Revenue & Volume,By Storage and Filing Products, 2023-2030 ($)
Table 29 Personalized Stationery MarketBy Type, Revenue & Volume,By Office and Desk Accessories, 2023-2030 ($)
Table 30 Personalized Stationery MarketBy Type, Revenue & Volume,By Presentation and Planning Materials, 2023-2030 ($)
Table 31 Personalized Stationery Market, Revenue & Volume,By Product, 2023-2030 ($)
Table 32 Personalized Stationery MarketBy Product, Revenue & Volume,By Business Users, 2023-2030 ($)
Table 33 Personalized Stationery MarketBy Product, Revenue & Volume,By Small Office and Home Office Users, 2023-2030 ($)
Table 34 Personalized Stationery MarketBy Product, Revenue & Volume,By Educational Institutes, 2023-2030 ($)
Table 35 Personalized Stationery MarketBy Product, Revenue & Volume,By Private Users, 2023-2030 ($)
Table 36 North America Personalized Stationery Market, Revenue & Volume,By Type, 2023-2030 ($)
Table 37 North America Personalized Stationery Market, Revenue & Volume,By Product, 2023-2030 ($)
Table 38 South america Personalized Stationery Market, Revenue & Volume,By Type, 2023-2030 ($)
Table 39 South america Personalized Stationery Market, Revenue & Volume,By Product, 2023-2030 ($)
Table 40 Europe Personalized Stationery Market, Revenue & Volume,By Type, 2023-2030 ($)
Table 41 Europe Personalized Stationery Market, Revenue & Volume,By Product, 2023-2030 ($)
Table 42 APAC Personalized Stationery Market, Revenue & Volume,By Type, 2023-2030 ($)
Table 43 APAC Personalized Stationery Market, Revenue & Volume,By Product, 2023-2030 ($)
Table 44 Middle East & Africa Personalized Stationery Market, Revenue & Volume,By Type, 2023-2030 ($)
Table 45 Middle East & Africa Personalized Stationery Market, Revenue & Volume,By Product, 2023-2030 ($)
Table 46 Russia Personalized Stationery Market, Revenue & Volume,By Type, 2023-2030 ($)
Table 47 Russia Personalized Stationery Market, Revenue & Volume,By Product, 2023-2030 ($)
Table 48 Israel Personalized Stationery Market, Revenue & Volume,By Type, 2023-2030 ($)
Table 49 Israel Personalized Stationery Market, Revenue & Volume,By Product, 2023-2030 ($)
Table 50 Top Companies 2023 (US$)Personalized Stationery Market, Revenue & Volume,,
Table 51 Product Launch 2023-2030Personalized Stationery Market, Revenue & Volume,,
Table 52 Mergers & Acquistions 2023-2030Personalized Stationery Market, Revenue & Volume,,
List of Figures
Figure 1 Overview of Personalized Stationery Market 2023-2030
Figure 2 Market Share Analysis for Personalized Stationery Market 2023 (US$)
Figure 3 Product Comparison in Personalized Stationery Market 2023-2030 (US$)
Figure 4 End User Profile for Personalized Stationery Market 2023-2030 (US$)
Figure 5 Patent Application and Grant in Personalized Stationery Market 2013-2023* (US$)
Figure 6 Top 5 Companies Financial Analysis in Personalized Stationery Market 2023-2030 (US$)
Figure 7 Market Entry Strategy in Personalized Stationery Market 2023-2030
Figure 8 Ecosystem Analysis in Personalized Stationery Market2023
Figure 9 Average Selling Price in Personalized Stationery Market 2023-2030
Figure 10 Top Opportunites in Personalized Stationery Market 2023-2030
Figure 11 Market Life Cycle Analysis in Personalized Stationery Market
Figure 12 GlobalBy TypePersonalized Stationery Market Revenue, 2023-2030 ($)
Figure 13 GlobalBy ProductPersonalized Stationery Market Revenue, 2023-2030 ($)
Figure 14 Global Personalized Stationery Market - By Geography
Figure 15 Global Personalized Stationery Market Value & Volume, By Geography, 2023-2030 ($)
Figure 16 Global Personalized Stationery Market CAGR, By Geography, 2023-2030 (%)
Figure 17 North America Personalized Stationery Market Value & Volume, 2023-2030 ($)
Figure 18 US Personalized Stationery Market Value & Volume, 2023-2030 ($)
Figure 19 US GDP and Population, 2023-2030 ($)
Figure 20 US GDP – Composition of 2023, By Sector of Origin
Figure 21 US Export and Import Value & Volume, 2023-2030 ($)
Figure 22 Canada Personalized Stationery Market Value & Volume, 2023-2030 ($)
Figure 23 Canada GDP and Population, 2023-2030 ($)
Figure 24 Canada GDP – Composition of 2023, By Sector of Origin
Figure 25 Canada Export and Import Value & Volume, 2023-2030 ($)
Figure 26 Mexico Personalized Stationery Market Value & Volume, 2023-2030 ($)
Figure 27 Mexico GDP and Population, 2023-2030 ($)
Figure 28 Mexico GDP – Composition of 2023, By Sector of Origin
Figure 29 Mexico Export and Import Value & Volume, 2023-2030 ($)
Figure 30 South America Personalized Stationery MarketSouth America 3D Printing Market Value & Volume, 2023-2030 ($)
Figure 31 Brazil Personalized Stationery Market Value & Volume, 2023-2030 ($)
Figure 32 Brazil GDP and Population, 2023-2030 ($)
Figure 33 Brazil GDP – Composition of 2023, By Sector of Origin
Figure 34 Brazil Export and Import Value & Volume, 2023-2030 ($)
Figure 35 Venezuela Personalized Stationery Market Value & Volume, 2023-2030 ($)
Figure 36 Venezuela GDP and Population, 2023-2030 ($)
Figure 37 Venezuela GDP – Composition of 2023, By Sector of Origin
Figure 38 Venezuela Export and Import Value & Volume, 2023-2030 ($)
Figure 39 Argentina Personalized Stationery Market Value & Volume, 2023-2030 ($)
Figure 40 Argentina GDP and Population, 2023-2030 ($)
Figure 41 Argentina GDP – Composition of 2023, By Sector of Origin
Figure 42 Argentina Export and Import Value & Volume, 2023-2030 ($)
Figure 43 Ecuador Personalized Stationery Market Value & Volume, 2023-2030 ($)
Figure 44 Ecuador GDP and Population, 2023-2030 ($)
Figure 45 Ecuador GDP – Composition of 2023, By Sector of Origin
Figure 46 Ecuador Export and Import Value & Volume, 2023-2030 ($)
Figure 47 Peru Personalized Stationery Market Value & Volume, 2023-2030 ($)
Figure 48 Peru GDP and Population, 2023-2030 ($)
Figure 49 Peru GDP – Composition of 2023, By Sector of Origin
Figure 50 Peru Export and Import Value & Volume, 2023-2030 ($)
Figure 51 Colombia Personalized Stationery Market Value & Volume, 2023-2030 ($)
Figure 52 Colombia GDP and Population, 2023-2030 ($)
Figure 53 Colombia GDP – Composition of 2023, By Sector of Origin
Figure 54 Colombia Export and Import Value & Volume, 2023-2030 ($)
Figure 55 Costa Rica Personalized Stationery MarketCosta Rica 3D Printing Market Value & Volume, 2023-2030 ($)
Figure 56 Costa Rica GDP and Population, 2023-2030 ($)
Figure 57 Costa Rica GDP – Composition of 2023, By Sector of Origin
Figure 58 Costa Rica Export and Import Value & Volume, 2023-2030 ($)
Figure 59 Europe Personalized Stationery Market Value & Volume, 2023-2030 ($)
Figure 60 U.K Personalized Stationery Market Value & Volume, 2023-2030 ($)
Figure 61 U.K GDP and Population, 2023-2030 ($)
Figure 62 U.K GDP – Composition of 2023, By Sector of Origin
Figure 63 U.K Export and Import Value & Volume, 2023-2030 ($)
Figure 64 Germany Personalized Stationery Market Value & Volume, 2023-2030 ($)
Figure 65 Germany GDP and Population, 2023-2030 ($)
Figure 66 Germany GDP – Composition of 2023, By Sector of Origin
Figure 67 Germany Export and Import Value & Volume, 2023-2030 ($)
Figure 68 Italy Personalized Stationery Market Value & Volume, 2023-2030 ($)
Figure 69 Italy GDP and Population, 2023-2030 ($)
Figure 70 Italy GDP – Composition of 2023, By Sector of Origin
Figure 71 Italy Export and Import Value & Volume, 2023-2030 ($)
Figure 72 France Personalized Stationery Market Value & Volume, 2023-2030 ($)
Figure 73 France GDP and Population, 2023-2030 ($)
Figure 74 France GDP – Composition of 2023, By Sector of Origin
Figure 75 France Export and Import Value & Volume, 2023-2030 ($)
Figure 76 Netherlands Personalized Stationery Market Value & Volume, 2023-2030 ($)
Figure 77 Netherlands GDP and Population, 2023-2030 ($)
Figure 78 Netherlands GDP – Composition of 2023, By Sector of Origin
Figure 79 Netherlands Export and Import Value & Volume, 2023-2030 ($)
Figure 80 Belgium Personalized Stationery Market Value & Volume, 2023-2030 ($)
Figure 81 Belgium GDP and Population, 2023-2030 ($)
Figure 82 Belgium GDP – Composition of 2023, By Sector of Origin
Figure 83 Belgium Export and Import Value & Volume, 2023-2030 ($)
Figure 84 Spain Personalized Stationery Market Value & Volume, 2023-2030 ($)
Figure 85 Spain GDP and Population, 2023-2030 ($)
Figure 86 Spain GDP – Composition of 2023, By Sector of Origin
Figure 87 Spain Export and Import Value & Volume, 2023-2030 ($)
Figure 88 Denmark Personalized Stationery Market Value & Volume, 2023-2030 ($)
Figure 89 Denmark GDP and Population, 2023-2030 ($)
Figure 90 Denmark GDP – Composition of 2023, By Sector of Origin
Figure 91 Denmark Export and Import Value & Volume, 2023-2030 ($)
Figure 92 APAC Personalized Stationery Market Value & Volume, 2023-2030 ($)
Figure 93 China Personalized Stationery MarketValue & Volume, 2023-2030
Figure 94 China GDP and Population, 2023-2030 ($)
Figure 95 China GDP – Composition of 2023, By Sector of Origin
Figure 96 China Export and Import Value & Volume, 2023-2030 ($)Personalized Stationery MarketChina Export and Import Value & Volume, 2023-2030 ($)
Figure 97 Australia Personalized Stationery Market Value & Volume, 2023-2030 ($)
Figure 98 Australia GDP and Population, 2023-2030 ($)
Figure 99 Australia GDP – Composition of 2023, By Sector of Origin
Figure 100 Australia Export and Import Value & Volume, 2023-2030 ($)
Figure 101 South Korea Personalized Stationery Market Value & Volume, 2023-2030 ($)
Figure 102 South Korea GDP and Population, 2023-2030 ($)
Figure 103 South Korea GDP – Composition of 2023, By Sector of Origin
Figure 104 South Korea Export and Import Value & Volume, 2023-2030 ($)
Figure 105 India Personalized Stationery Market Value & Volume, 2023-2030 ($)
Figure 106 India GDP and Population, 2023-2030 ($)
Figure 107 India GDP – Composition of 2023, By Sector of Origin
Figure 108 India Export and Import Value & Volume, 2023-2030 ($)
Figure 109 Taiwan Personalized Stationery MarketTaiwan 3D Printing Market Value & Volume, 2023-2030 ($)
Figure 110 Taiwan GDP and Population, 2023-2030 ($)
Figure 111 Taiwan GDP – Composition of 2023, By Sector of Origin
Figure 112 Taiwan Export and Import Value & Volume, 2023-2030 ($)
Figure 113 Malaysia Personalized Stationery MarketMalaysia 3D Printing Market Value & Volume, 2023-2030 ($)
Figure 114 Malaysia GDP and Population, 2023-2030 ($)
Figure 115 Malaysia GDP – Composition of 2023, By Sector of Origin
Figure 116 Malaysia Export and Import Value & Volume, 2023-2030 ($)
Figure 117 Hong Kong Personalized Stationery MarketHong Kong 3D Printing Market Value & Volume, 2023-2030 ($)
Figure 118 Hong Kong GDP and Population, 2023-2030 ($)
Figure 119 Hong Kong GDP – Composition of 2023, By Sector of Origin
Figure 120 Hong Kong Export and Import Value & Volume, 2023-2030 ($)
Figure 121 Middle East & Africa Personalized Stationery MarketMiddle East & Africa 3D Printing Market Value & Volume, 2023-2030 ($)
Figure 122 Russia Personalized Stationery MarketRussia 3D Printing Market Value & Volume, 2023-2030 ($)
Figure 123 Russia GDP and Population, 2023-2030 ($)
Figure 124 Russia GDP – Composition of 2023, By Sector of Origin
Figure 125 Russia Export and Import Value & Volume, 2023-2030 ($)
Figure 126 Israel Personalized Stationery Market Value & Volume, 2023-2030 ($)
Figure 127 Israel GDP and Population, 2023-2030 ($)
Figure 128 Israel GDP – Composition of 2023, By Sector of Origin
Figure 129 Israel Export and Import Value & Volume, 2023-2030 ($)
Figure 130 Entropy Share, By Strategies, 2023-2030* (%)Personalized Stationery Market
Figure 131 Developments, 2023-2030*Personalized Stationery Market
Figure 132 Company 1 Personalized Stationery Market Net Revenue, By Years, 2023-2030* ($)
Figure 133 Company 1 Personalized Stationery Market Net Revenue Share, By Business segments, 2023 (%)
Figure 134 Company 1 Personalized Stationery Market Net Sales Share, By Geography, 2023 (%)
Figure 135 Company 2 Personalized Stationery Market Net Revenue, By Years, 2023-2030* ($)
Figure 136 Company 2 Personalized Stationery Market Net Revenue Share, By Business segments, 2023 (%)
Figure 137 Company 2 Personalized Stationery Market Net Sales Share, By Geography, 2023 (%)
Figure 138 Company 3Personalized Stationery Market Net Revenue, By Years, 2023-2030* ($)
Figure 139 Company 3Personalized Stationery Market Net Revenue Share, By Business segments, 2023 (%)
Figure 140 Company 3Personalized Stationery Market Net Sales Share, By Geography, 2023 (%)
Figure 141 Company 4 Personalized Stationery Market Net Revenue, By Years, 2023-2030* ($)
Figure 142 Company 4 Personalized Stationery Market Net Revenue Share, By Business segments, 2023 (%)
Figure 143 Company 4 Personalized Stationery Market Net Sales Share, By Geography, 2023 (%)
Figure 144 Company 5 Personalized Stationery Market Net Revenue, By Years, 2023-2030* ($)
Figure 145 Company 5 Personalized Stationery Market Net Revenue Share, By Business segments, 2023 (%)
Figure 146 Company 5 Personalized Stationery Market Net Sales Share, By Geography, 2023 (%)
Figure 147 Company 6 Personalized Stationery Market Net Revenue, By Years, 2023-2030* ($)
Figure 148 Company 6 Personalized Stationery Market Net Revenue Share, By Business segments, 2023 (%)
Figure 149 Company 6 Personalized Stationery Market Net Sales Share, By Geography, 2023 (%)
Figure 150 Company 7 Personalized Stationery Market Net Revenue, By Years, 2023-2030* ($)
Figure 151 Company 7 Personalized Stationery Market Net Revenue Share, By Business segments, 2023 (%)
Figure 152 Company 7 Personalized Stationery Market Net Sales Share, By Geography, 2023 (%)
Figure 153 Company 8 Personalized Stationery Market Net Revenue, By Years, 2023-2030* ($)
Figure 154 Company 8 Personalized Stationery Market Net Revenue Share, By Business segments, 2023 (%)
Figure 155 Company 8 Personalized Stationery Market Net Sales Share, By Geography, 2023 (%)
Figure 156 Company 9 Personalized Stationery Market Net Revenue, By Years, 2023-2030* ($)
Figure 157 Company 9 Personalized Stationery Market Net Revenue Share, By Business segments, 2023 (%)
Figure 158 Company 9 Personalized Stationery Market Net Sales Share, By Geography, 2023 (%)
Figure 159 Company 10 Personalized Stationery Market Net Revenue, By Years, 2023-2030* ($)
Figure 160 Company 10 Personalized Stationery Market Net Revenue Share, By Business segments, 2023 (%)
Figure 161 Company 10 Personalized Stationery Market Net Sales Share, By Geography, 2023 (%)
Figure 162 Company 11 Personalized Stationery Market Net Revenue, By Years, 2023-2030* ($)
Figure 163 Company 11 Personalized Stationery Market Net Revenue Share, By Business segments, 2023 (%)
Figure 164 Company 11 Personalized Stationery Market Net Sales Share, By Geography, 2023 (%)
Figure 165 Company 12 Personalized Stationery Market Net Revenue, By Years, 2023-2030* ($)
Figure 166 Company 12 Personalized Stationery Market Net Revenue Share, By Business segments, 2023 (%)
Figure 167 Company 12 Personalized Stationery Market Net Sales Share, By Geography, 2023 (%)
Figure 168 Company 13Personalized Stationery Market Net Revenue, By Years, 2023-2030* ($)
Figure 169 Company 13Personalized Stationery Market Net Revenue Share, By Business segments, 2023 (%)
Figure 170 Company 13Personalized Stationery Market Net Sales Share, By Geography, 2023 (%)
Figure 171 Company 14 Personalized Stationery Market Net Revenue, By Years, 2023-2030* ($)
Figure 172 Company 14 Personalized Stationery Market Net Revenue Share, By Business segments, 2023 (%)
Figure 173 Company 14 Personalized Stationery Market Net Sales Share, By Geography, 2023 (%)
Figure 174 Company 15 Personalized Stationery Market Net Revenue, By Years, 2023-2030* ($)
Figure 175 Company 15 Personalized Stationery Market Net Revenue Share, By Business segments, 2023 (%)
Figure 176 Company 15 Personalized Stationery Market Net Sales Share, By Geography, 2023 (%)