 Email
Email Print
Print


Precasting Market - By Type , By Construction Type , By End-use Industry , By Geography - Global Opportunity Analysis & Industry Forecast, 2024 - 2030
Precasting Market Overview
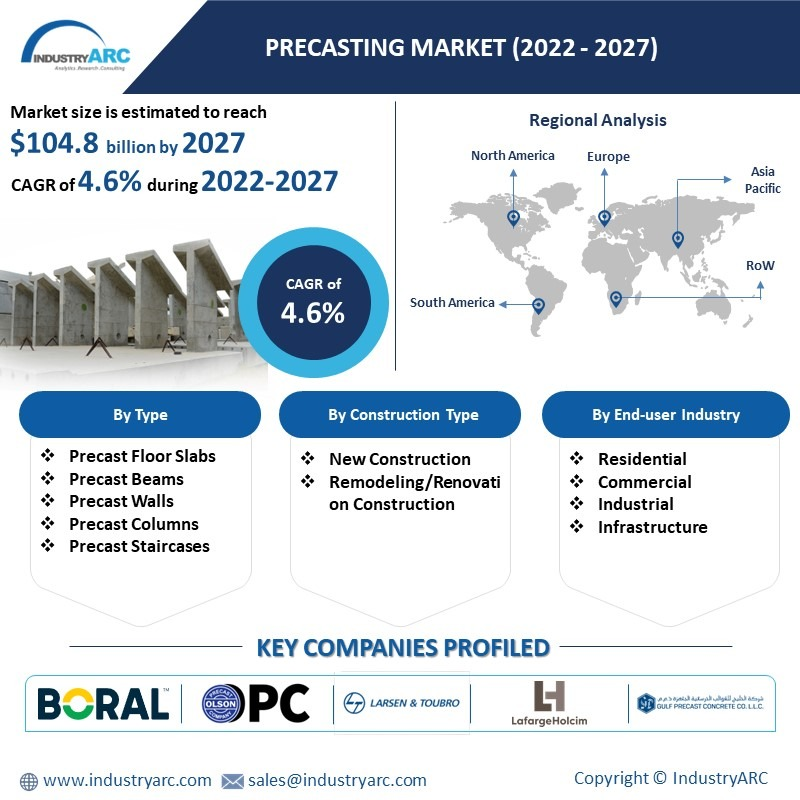
The Precasting Market Size is forecast to reach $ 257354.3 Million by 2030, at a CAGR of 6.50% during forecast period 2024-2030. Precast materials can be categorized into various types which include precast floor slabs, precast beams, precast walls, precast columns, precast staircases and more. The expansion of the precasting market is primarily driven by its usage in the construction industry. According to recent insights from World Cement, the global construction industry output increased by 5.7% in 2021. An increase in construction activities along with the surging green building initiatives is expected to drive the growth of the precasting market size in the upcoming years. On the other hand, the availability of substitutes may confine the market growth. In 2020, the surge in the COVID-19 pandemic negatively impacted construction activities, thus, temporarily affecting the growth of the precasting industry. However, a steady recovery in new development and construction contracts has been witnessed across many countries around the world since 2021, which in turn, is driving the demand for precast materials.
Precasting Market Report Coverage
The "Precasting Market Report – Forecast (2024-2030)” by IndustryARC, covers an in-depth analysis of the following segments in the Precasting Market.
Key Takeaways
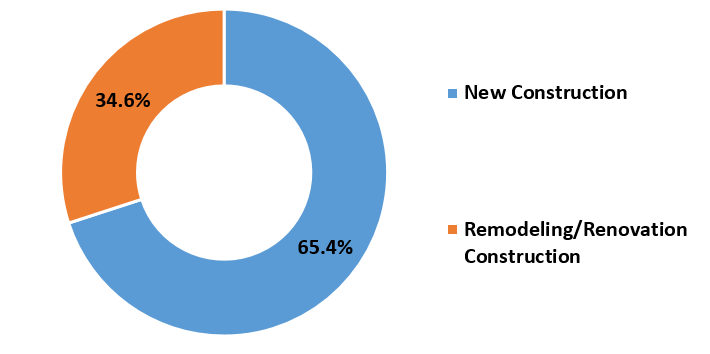
- New construction segment held the largest share in the Precasting Market in 2021, owing to an increase in new construction activities across the world.
- Residential segment held a significant share in the Precasting Market in 2021, owing to the increasing demand for precast materials for use in floors, concrete frameworks, walls and other applications of residential buildings.
- Asia-Pacific dominated the Precasting Market in 2021, owing to its increasing demand from the construction sector in the region. In October 2021, the Ministry of Construction of Vietnam proposed around 266 residential housing projects across the country which are scheduled to be completed during 2024-2030.
- A detailed analysis of strengths, weaknesses, opportunities and threats would be provided in the Precasting Market Report.
Precasting Market Segment Analysis – by Construction Type
The new construction type held the largest share (30%) of the Precasting Market in 2021, owing to an increase in new construction activities across the world. In 2021, the construction of two new mixed-use towers began in Australia, which is scheduled to be completed in 2025. Moreover, in 2021, the development of new commercial offices commenced in Germany which is scheduled to be completed in 2023. Thus, such an increase in new construction projects is expected to increase the demand for precast materials. This is expected to drive the growth of the market during the forecast period.
Precasting Market Segment Analysis – by End-use
The residential segment held a significant share of over 20% in the Precasting Market in 2021, owing to the increase in construction of residential buildings across the globe. In October 2021, the Ministry of Construction of Vietnam proposed VND 30 trillion (US$1.3 billion) credit package to build low-cost residential homes for workers. The project is scheduled for completion by 2025. Moreover, recent insights from Construct Connect state that the US government has funded around US$20 billion for the construction of a real estate and development project called One Central Project in Chicago, which is currently undergoing construction in 2022. Precast materials such as precast floor slabs, precast beams, precast walls, precast columns, precast staircases and more are primarily used during the construction of a residential building. Thus, such surging growth of the residential sector is expected to expand the Precasting market size during the forecast period.
Precasting Market Segment Analysis – by Geography
Asia-Pacific held a dominant Precasting Market share of around 35% in the year 2021. The consumption of precasting material is particularly high in this region due to its increasing demand from the construction sector. In January 2022, the government of China approved 695 building and construction projects with a total investment of US$471 billion. Moreover, recent insights from Invest India state that there are around 115 future construction projects that are currently under the planning phase in India in 2022 with a total investment of around US$11.63 million. In this way, the surging growth of the construction sector in the region is expected to increase the demand for precast materials for use in floors, frameworks, walls and other similar applications, thus, accelerating the market growth during the forecast period.
Precasting Market Drivers
An increase in construction activities
The factors such as urbanization and the rapid pace of development to aid the economic growth of the countries are driving the construction activities in multiple regions across the world. According to Volvo CE, the construction sector saw an increase in construction activities across multiple regions since the fourth quarter of 2020. South America saw an increase of 12%, Asia by 39%, Europe by 20% and China by 28% in 2020. Precast materials such as precast floor slabs, precast beams, precast walls, precast columns, precast staircases and more are primarily used in the construction industry in different applications involving floors, walls, staircases, wall cladding and other similar applications. Thus, an increase in global construction activities is anticipated to drive market growth in the upcoming years.
Surging green building initiatives
Precast materials such as precast concrete are natural building materials that are completely recyclable in nature. Similarly, the minimum waste output is generated during the production process of precast materials. Moreover, the use of precast materials during the construction of a building significantly reduces the consumption of energy, water and building materials. It is also non-toxic and eco-friendly. Thus, all of these properties of precast materials make them ideal for use in the construction of green buildings. In 2020, the Ministry of Housing and Urban-Rural Development (MOHURD) of China implemented Urban Renewal Actions as a part of the 14th Five-Year Plan. This urban regeneration initiative aims at producing greener and more efficient cities with the development of green buildings across the country. Hence, such a massive initiative toward the development of green buildings is expected to increase the demand for precast materials. This is expected to accelerate market growth in the upcoming years.
Precasting Market Challenge
Availability of substitutes
Precast materials such as precast concrete have several substitutes such as reinforced concrete, prefabrication concrete and more. These substitutes have similar physical properties, performance and other similar factors such as strength, durability, impact resistance and more, which may restrict the growth of the market. For instance, reinforced concrete is commonly used as a substitute for precast concrete in major end-users such as residential, commercial, industrial construction and more, owing to their range of benefits. Reinforced concrete offers high strength, flexibility, workability and better availability of raw materials. Moreover, reinforced concrete is relatively cheaper than precast concrete. Thus, the availability of such cheaper alternatives with similar properties may limit the growth of the Precasting industry during the forecast period.
Precasting Industry Outlook
Technology launches, acquisitions and increased R&D activities are key strategies adopted by players in the Precasting Market. The top companies in the Precasting Market are:
- Boral Ltd.
- LafargeHolcim
- Gulf Precast
- Olson Precast Company
- Larsen & Toubro
- Cemex S.A.B. de C.V.
- Tindall Corporation
- Skanska AB
- CRH Plc
- Balfour Beatty Plc
Recent Developments
- In December 2021, Cementos Molins acquired Pretersa Prenavisa, a precast concrete company headquartered in Spain. The main motive of this acquisition was to expand the company’s presence in the precast solutions in Spain, Portugal and France.
- In December 2021, Janaadhar, a precast solution provider based in India, launched its new precast concrete factory in India. The primary motive of this launch is to offer sustainable precast solutions and deliver green affordable homes that are accessible to low-income families across India.
- In January 2021, Jensen Precast, a precast concrete infrastructure solutions provider acquired EnCon United facilities in Camas and Puyallup, Washington. The acquisition aimed at strengthening the company’s position in the North American market.
Key Market Players:
The Top 5 companies in the Precasting Market are:
- LafargeHolcim
- CRH plc
- Skanska
- Boral
- CEMEX
For more Chemicals and Materials Market reports, please click here
List of Tables:
Table 1 Global Precast Market Revenue, By Region, 2016-2021 ($Million)
Table 2 Precast Concrete Wall Panels Pricing Analysis, 2016
Table 3 Precast Market Revenue, By Product Types, 2016-2021 ($Million)
Table 4 Global Precast Market Revenue, By Geography, 2016-2021 ($Million)
Table 5 Americas: Precast Market Revenue, By Type, 2016-2021 ($ Million)
Table 6 Americas: Precast Market Revenue, By End Use Industry, 2016-2021 ($Million)
Table 7 Europe Precast Market Revenue, By Products Type, 2016-2021 ($Million)
Table 8 Europe: Precast Market Revenue, By End Use Industry, 2016-2021 ($Million)
Table 9 APAC Precast Market Revenue, By Products Type, 2016-2021 ($Million)
Table 10 APAC Precast Market Revenue, By End Use Industry, 2016-2021 ($Million)
Table 11 China : Total Assets on Cement & Concrete , 2008-2014, (Billion Yuan)
List of Figures:
Figure 1 Precast Market Revenue, By Region, 2016 and 2021 (%)
Figure 2 Global Precast Market Revenue, By Product Type, 2016-2021 ($Million)
Figure 3 Global Precast Market Revenue, By End-User, 2016-2021 ($Million)
Figure 4 Precast Market Share Analysis, By Company 2015 (%)
Figure 5 Precasting Patents, 2013-2023 (*Jan)
Figure 6 Precasting Patents Share, By Countries, 2013-2023 (%)
Figure 7 Precast Market Life Cycle, 2015-2021
Figure 8 Facades: Precast Market Revenue, 2016-2021 ($Million)
Figure 9 Floors : Precast Market Revenue, 2016-2021 ($Million)
Figure 10 Partition & Internal Walls : Precast Market Revenue, 2016-2021 ($Million)
Figure 11 Foundation : Precast Market Revenue, 2016-2021 ($Million)
Figure 12 Frames : Precast Market Revenue, 2016-2021 ($Million)
Figure 13 Others: Precast Market Revenue, 2016-2021 ($Million)
Figure 14 Precast Market Segmentation, By End-Use Industry
Figure 15 Precast Market Value, By End-users, 2016-2021 ($Million)
Figure 16 NUMBER OF CITIES WITH MORE THAN 50,000 PEOPLE, BY REGION, 2015
Figure 17 U.S. Manufactured houses Sales, 2013 – 2016 (Units)
Figure 18 Cast in-situ concrete and Precast concrete, Material Consumption Comparison
Figure 19 Residential: Precast Market Revenue, 2016-2021 ($Million)
Figure 20 THE U.S. NON-RESIDENTIAL CONSTRUCTION SPENDING, DECEMBER 2014-APRIL 2015, ($Million)
Figure 21 Non-Residential: Precast Market Revenue, 2016-2021 ($Million)
Figure 22 Hospitals, By Country, 2015 (Units)
Figure 23 Change in Consumer Spending, By Year, 2005-2019 (%)
Figure 24 Infrastructure Spending Forecast Of Emerging Markets, 2008-2023 ($Trillion)
Figure 25 Infrastructure: Precast Market Value, 2016-2021 ($Million)
Figure 26 U.S.: GDP and Population, 2012-2015 ($Trillion, Million)
Figure 27 U.S.: GDP – Composition of 2015, By Sector of Origin
Figure 28 U.S.: Export and Import Value, 2012-2015 ($Trillion)
Figure 29 U.S.: GDP – Composition of 2015, By End Use
Figure 30 Annual Value of U.S. Construction, 2005-2016 ($ Billion)
Figure 31 The U.S. Value of Construction: Residential vs. Non-residential, January, 2015-April, 2015 ($Billion)
Figure 32 U.S: Precast Market Revenue, 2016-2021 ($ Million)
Figure 33 Canada: GDP and Population, 2012-2015 ($Trillion, Million)
Figure 34 Canada: GDP – Composition of 2015, By Sector of Origin
Figure 35 Canada : Export and Import Value, 2012-2015 ($Billion)
Figure 36 Canada : GDP – Composition of 2015, By End Use
Figure 37 Canadian Building Permits Data, By type of Construction ($Million)
Figure 38 Canada: Precast Market Revenue, 2016-2021 ($ Million)
Figure 39 Brazil: GDP and Population, 2012-2015 ($Trillion, Million)
Figure 40 Brazil: GDP – Composition of 2015, By Sector of Origin
Figure 41 Brazil: Export and Import Value, 2012-2015 ($Billion)
Figure 42 Brazil: GDP – Composition of 2015, By End Use
Figure 43 Brazil: Precast Market Revenue, 2016-2021 ($ Million)
Figure 44 Mexico Construction Industry GDP Growth Forecast, 2014-2020 (%)
Figure 45 Rest of Americas: Precast Market Revenue, 2016-2021 ($ Million)
Figure 46 Germany: GDP and Population, 2012-2015 ($Trillion, Million)
Figure 47 Germany: GDP – Composition of 2015, By Sector of Origin
Figure 48 Germany: Export and Import Value, 2012-2015 ($Billion)
Figure 49 Germany: GDP – Composition of 2015, By End Use
Figure 50 Germany: Precast Market Revenue, 2016-2021 ($ Million)
Figure 51 U.K.: GDP and Population, 2012-2015 ($Trillion, Million)
Figure 52 U.K.: GDP – Composition of 2015, By Sector of Origin
Figure 53 U.K.: Export and Import Value, 2012-2015 ($Billion)
Figure 54 U.K.: GDP – Composition of 2015, By End Use
Figure 55 UK: Value of Construction, By type of Construction 2010-2020 ($Million)
Figure 56 United Kingdom: Precast Market Revenue, 2016-2021 ($ Million)
Figure 57 GDP, 2011-2015 ($Trillion)
Figure 58 GDP – Composition of 2015, By Sector of Origin
Figure 59 Export and Import Value, 2012-2015 (%)
Figure 60 GDP – Composition of 2015, By End Use
Figure 61 Russia: Precast Market Revenue, 2016-2021 ($ Million)
Figure 62 Rest of Europe: Precast Market Revenue, 2016-2021 ($ Million)
Figure 63 China: GDP and Population, 2012-2015 ($Trillion, Million)
Figure 64 China: GDP – Composition of 2015, By Sector of Origin
Figure 65 China: Export and Import Value, 2012-2015 ($Billion)
Figure 66 China: GDP – Composition of 2015, By End Use
Figure 67 China : Total Assets on Cement & Concrete , 2008-2014, (Billion Yuan)
Figure 68 Revenue of largest construction companies in China in 2015, ($Billion)
Figure 69 China: Precast Market Revenue, 2016-2021 ($ Million)
Figure 70 Korea: GDP and Population, 2012-2015 ($Trillion, Million)
Figure 71 Korea: GDP – Composition of 2015, By Sector of Origin
Figure 72 Korea: Export and Import Value, 2012-2015 ($Billion)
Figure 73 Korea: GDP – Composition of 2015, By End Use
Figure 74 South Korea: Precast Market Revenue, 2016-2021 ($ Million)
Figure 75 Japan: GDP and Population, 2012-2015 ($Trillion, Million)
Figure 76 Japan: GDP – Composition of 2015, By Sector of Origin
Figure 77 Japan: Export and Import Value, 2012-2015 ($Billion)
Figure 78 Japan: GDP – Composition of 2015, By End Use
Figure 79 Japan: Precast Market Revenue, 2016-2021 ($ Million)
Figure 80 Rest of Asia: Precast Market Revenue, 2016-2021 ($ Million)
Figure 81 Middle East: Precast Market Revenue, 2016-2021 ($ Million)
Figure 82 Africa : Precast Market Revenue, 2016-2021 ($ Million)
Figure 83 HEIDELBERGCEMENT AG Net sales, By Years, 2012-2015 ($Billion)
Figure 84 HEIDELBERGCEMENT AG Net Sales Share, By Business segments, 2015 (%)
Figure 85 HEIDELBERGCEMENT AG Net Sales Share, By Geography, 2015 (%)
Figure 86 Lafarge Holcim, Net Sales, By Years, 2014-2016* ($Billion)
Figure 87 Lafarge Holcim, Net Sales Share, By Geography, 2016* (Jan-Sep) (%)
Figure 88 CNBM revenue, By year, 2013-2015 ($Billion)
Figure 89 CNBM revenue share, By Segment 2015 (%)
Figure 90 L & T Net sales, By Years, 2013-2015 ($Billion)
Figure 91 L & T Net Sales Share, By Business segment, 2015 (%)
Figure 92 L & T Net Sales Share, By Geography, FY 2016 (%)
Figure 93 Italcementi S,p.A Net sales, By Years, 2012-2015 ($Billion)
Figure 94 Italcementi S.p.A Net Sales Revenue by Business Segments, 2015(%)
Figure 95 Italcementi S.p.A Net Sales Revenue by geography, 2015(%)
Figure 96 CEMEX, Inc Net sales, By Years, 2012- 2015 ($Billion)
Figure 97 CEMEX, Inc Net Sales Share, By Geography, 2015 (%)