 Email
Email Print
Print


The Nanosensor Market size is estimated to reach $805.6 Million by 2030, growing at a CAGR of 11.80% during the forecast period 2024-2030
Nanotechnology is one among the emerging and disruptive technology and has revolutionized the sensors industry to greater extent. Nanosensors are made with the help of chemical, biological sensory points to transfer information regarding nanoparticles that is used in organic studies. Technological advancements and huge R&D investments by the leading players has enabled the entry of nanotechnology in to sensors industry. The nanosensors market has witnessed huge growth in last 3-4 years and similar trend in expected to follow in coming years. The growth has been tremendous in medical, biotechnology, and military applications and it is expected that nano-sensor will find new opportunities in untapped applications.
Rising demand in healthcare and medical industry coupled with technological innovations will propel the growth of the nanosensors market during the forecast period. Advantages such as reduction in the average time for detection, diagnosis along with the demand for quality and cost-efficient products will further attribute to the market growth.
The global market for Nanosensors can be segmented based on type into optical, electromagnetic and electrochemical. On the basis of technology the market has been classified into molecular self-assembly, top-down and bottom-up assembly. Based on the application the market is classified into automotive, biomedical, healthcare, food management, aerospace, defence and military among others.
The report contains the most detailed and in-depth segmentation of the Nanosensors market. The global Nanosensors market has been analyzed with respect to different parameters such as demand, supply, end-users and service providers.
The overall market has also been presented from the perspective of different geographical locations into standard geographic regions and key economies in the market. Competitive landscape for each of the segments is highlighted and market players are profiled with attributes of company overview, financial overview, business strategies, product portfolio and recent developments.
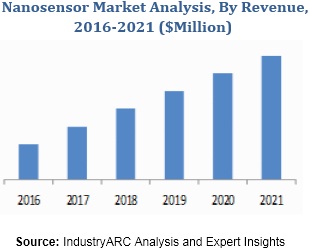
The global Nanosensors market is estimated to reach $xxm in 2023 from $xxm in 2016 growing with CAGR of xx% during the forecast period. North America has been the leading region in for Nanosensors market followed by Europe and APAC. Rising demand for nanosensors for military and security purpose owing to their energy efficiency, compact size and low cost has resulted for the market growth in this region.
The market shares for the key players in 2016 are also provided.
Sample Companies Profiled in this Report are:
- Nanowear, Inc.
- Lamdagen Corporation
- Aerbetic
- Applied Nanodetectors Ltd.
1. Nanosensor Market Overview
2. Executive Summary
3. Nanosensor Market Landscape
3.1. Market Share Analysis
3.2. Comparative Analysis
3.2.1. Product Benchmarking
3.2.2. End-User Profiling
3.2.3. Financial Analysis of Top 5 Players
4. Nanosensor Market Forces
4.1. Market Drivers
4.2. Market Constraints
4.3. Market Challenges
4.4. Attractiveness of Industry
4.4.1. Power of Supplier
4.4.2. Power of Consumer
4.4.3. Threat of New Entrant
4.4.4. Threat of Substitute
4.4.5. Degree of Competition
5. Nanosensor Market Strategic Analysis
5.1. Value Chain Analysis
5.2. Pricing Analysis
5.3. Opportunity Analysis
5.4. Product Life Cycle Analysis
5.5. Supplier & Distributor Analysis
6. Nanosensor Market - By Type
6.1. Optical
6.2. Electromagnetic
6.3. Electrochemical
7. Nanosensor Market - By Technology
7.1. Molecular Self Assembly
7.2. Top-down Assembly
7.3. Bottom-up Assembly
8. Nanosensor Market - By Application
8.1. Security & Surveillance
8.2. Aerospace, Defense, & Military
8.3. Automotive
8.4. Biomedical
8.5. Healthcare
8.6. Food Management
8.7. Others
9. Nanosensor Market - By Geography
9.1. North America
9.1.1. The U.S.
9.1.2. Canada
9.1.3. Others
9.2. Europe
9.2.1. Germany
9.2.2. U.K.
9.2.3. France
9.2.4. Others
9.3. Asia-Pacific
9.3.1. China
9.3.2. India
9.3.3. Japan
9.3.4. Others
9.4. South America, Middle-East & Africa
10. Nanosensor Market Entropy
10.1. New Product Launches
10.2. M&A, Collaboration, Partnerships, & JVs
11. Company Profiles (Overview, Financials, Products & Services, Recent Developments, Competitors, and Customers)
11.1. Company 1
11.2. Company 2
11.3. Company 3
11.4. Company 4
11.5. Company 5
11.6. Company 6
11.7. Company 7
11.8. Company 8
11.9. Company 9
11.10. Company 10
*More than 40 Companies are profiled in this Research Report, Complete List available on Request*
"*Financials would be provided on a best efforts basis for private companies"
12. Appendix
12.1. Abbreviations
12.2. Sources
12.3. Research Methodology
12.4. Bibliography
12.5. Compilation of Expert Insights
List of Tables
Table1: Nanosensor Market Overview 2023-2030
Table2: Nanosensor Market Leader Analysis 2023-2030 (US$)
Table3: Nanosensor Market Product Analysis 2023-2030 (US$)
Table4: Nanosensor Market End User Analysis 2023-2030 (US$)
Table5: Nanosensor Market Patent Analysis 2013-2023* (US$)
Table6: Nanosensor Market Financial Analysis 2023-2030 (US$)
Table7: Nanosensor Market Driver Analysis 2023-2030 (US$)
Table8: Nanosensor Market Challenges Analysis 2023-2030 (US$)
Table9: Nanosensor Market Constraint Analysis 2023-2030 (US$)
Table10: Nanosensor Market Supplier Bargaining Power Analysis 2023-2030 (US$)
Table11: Nanosensor Market Buyer Bargaining Power Analysis 2023-2030 (US$)
Table12: Nanosensor Market Threat of Substitutes Analysis 2023-2030 (US$)
Table13: Nanosensor Market Threat of New Entrants Analysis 2023-2030 (US$)
Table14: Nanosensor Market Degree of Competition Analysis 2023-2030 (US$)
Table15: Nanosensor Market Value Chain Analysis 2023-2030 (US$)
Table16: Nanosensor Market Pricing Analysis 2023-2030 (US$)
Table17: Nanosensor Market Opportunities Analysis 2023-2030 (US$)
Table18: Nanosensor Market Product Life Cycle Analysis 2023-2030 (US$)
Table19: Nanosensor Market Supplier Analysis 2023-2030 (US$)
Table20: Nanosensor Market Distributor Analysis 2023-2030 (US$)
Table21: Nanosensor Market Trend Analysis 2023-2030 (US$)
Table22: Nanosensor Market Size 2023 (US$)
Table23: Nanosensor Market Forecast Analysis 2023-2030 (US$)
Table24: Nanosensor Market Sales Forecast Analysis 2023-2030 (Units)
Table25: Nanosensor Market, Revenue & Volume, By Type, 2023-2030 ($)
Table26: Nanosensor Market By Type, Revenue & Volume, Optical, 2023-2030 ($)
Table27: Nanosensor Market By Type, Revenue & Volume, Electromagnetic, 2023-2030 ($)
Table28: Nanosensor Market By Type, Revenue & Volume, Electrochemical, 2023-2030 ($)
Table29: Nanosensor Market, Revenue & Volume, By Technology, 2023-2030 ($)
Table30: Nanosensor Market By Technology, Revenue & Volume, Molecular Self Assembly, 2023-2030 ($)
Table31: Nanosensor Market By Technology, Revenue & Volume, Top-down Assembly, 2023-2030 ($)
Table32: Nanosensor Market By Technology, Revenue & Volume, Bottom-up Assembly, 2023-2030 ($)
Table33: North America Nanosensor Market, Revenue & Volume, By Type, 2023-2030 ($)
Table34: North America Nanosensor Market, Revenue & Volume, By Technology, 2023-2030 ($)
Table35: South america Nanosensor Market, Revenue & Volume, By Type, 2023-2030 ($)
Table36: South america Nanosensor Market, Revenue & Volume, By Technology, 2023-2030 ($)
Table37: Europe Nanosensor Market, Revenue & Volume, By Type, 2023-2030 ($)
Table38: Europe Nanosensor Market, Revenue & Volume, By Technology, 2023-2030 ($)
Table39: APAC Nanosensor Market, Revenue & Volume, By Type, 2023-2030 ($)
Table40: APAC Nanosensor Market, Revenue & Volume, By Technology, 2023-2030 ($)
Table41: Middle East & Africa Nanosensor Market, Revenue & Volume, By Type, 2023-2030 ($)
Table42: Middle East & Africa Nanosensor Market, Revenue & Volume, By Technology, 2023-2030 ($)
Table43: Russia Nanosensor Market, Revenue & Volume, By Type, 2023-2030 ($)
Table44: Russia Nanosensor Market, Revenue & Volume, By Technology, 2023-2030 ($)
Table45: Israel Nanosensor Market, Revenue & Volume, By Type, 2023-2030 ($)
Table46: Israel Nanosensor Market, Revenue & Volume, By Technology, 2023-2030 ($)
Table47: Top Companies 2023 (US$)Nanosensor Market, Revenue & Volume
Table48: Product Launch 2023-2030Nanosensor Market, Revenue & Volume
Table49: Mergers & Acquistions 2023-2030Nanosensor Market, Revenue & Volume
List of Figures
Figure 1: Overview of Nanosensor Market 2023-2030
Figure 2: Market Share Analysis for Nanosensor Market 2023 (US$)
Figure 3: Product Comparison in Nanosensor Market 2023-2030 (US$)
Figure 4: End User Profile for Nanosensor Market 2023-2030 (US$)
Figure 5: Patent Application and Grant in Nanosensor Market 2013-2023* (US$)
Figure 6: Top 5 Companies Financial Analysis in Nanosensor Market 2023-2030 (US$)
Figure 7: Market Entry Strategy in Nanosensor Market 2023-2030
Figure 8: Ecosystem Analysis in Nanosensor Market 2023
Figure 9: Average Selling Price in Nanosensor Market 2023-2030
Figure 10: Top Opportunites in Nanosensor Market 2023-2030
Figure 11: Market Life Cycle Analysis in Nanosensor Market
Figure 12: GlobalBy TypeNanosensor Market Revenue, 2023-2030 ($)
Figure 13: GlobalBy TechnologyNanosensor Market Revenue, 2023-2030 ($)
Figure 14: Global Nanosensor Market - By Geography
Figure 15: Global Nanosensor Market Value & Volume, By Geography, 2023-2030 ($)
Figure 16: Global Nanosensor Market CAGR, By Geography, 2023-2030 (%)
Figure 17: North America Nanosensor Market Value & Volume, 2023-2030 ($)
Figure 18: US Nanosensor Market Value & Volume, 2023-2030 ($)
Figure 19: US GDP and Population, 2023-2030 ($)
Figure 20: US GDP – Composition of 2023, By Sector of Origin
Figure 21: US Export and Import Value & Volume, 2023-2030 ($)
Figure 22: Canada Nanosensor Market Value & Volume, 2023-2030 ($)
Figure 23: Canada GDP and Population, 2023-2030 ($)
Figure 24: Canada GDP – Composition of 2023, By Sector of Origin
Figure 25: Canada Export and Import Value & Volume, 2023-2030 ($)
Figure 26: Mexico Nanosensor Market Value & Volume, 2023-2030 ($)
Figure 27: Mexico GDP and Population, 2023-2030 ($)
Figure 28: Mexico GDP – Composition of 2023, By Sector of Origin
Figure 29: Mexico Export and Import Value & Volume, 2023-2030 ($)
Figure 30: South America Nanosensor Market Value & Volume, 2023-2030 ($)
Figure 31: Brazil Nanosensor Market Value & Volume, 2023-2030 ($)
Figure 32: Brazil GDP and Population, 2023-2030 ($)
Figure 33: Brazil GDP – Composition of 2023, By Sector of Origin
Figure 34: Brazil Export and Import Value & Volume, 2023-2030 ($)
Figure 35: Venezuela Nanosensor Market Value & Volume, 2023-2030 ($)
Figure 36: Venezuela GDP and Population, 2023-2030 ($)
Figure 37: Venezuela GDP – Composition of 2023, By Sector of Origin
Figure 38: Venezuela Export and Import Value & Volume, 2023-2030 ($)
Figure 39: Argentina Nanosensor Market Value & Volume, 2023-2030 ($)
Figure 40: Argentina GDP and Population, 2023-2030 ($)
Figure 41: Argentina GDP – Composition of 2023, By Sector of Origin
Figure 42: Argentina Export and Import Value & Volume, 2023-2030 ($)
Figure 43: Ecuador Nanosensor Market Value & Volume, 2023-2030 ($)
Figure 44: Ecuador GDP and Population, 2023-2030 ($)
Figure 45: Ecuador GDP – Composition of 2023, By Sector of Origin
Figure 46: Ecuador Export and Import Value & Volume, 2023-2030 ($)
Figure 47: Peru Nanosensor Market Value & Volume, 2023-2030 ($)
Figure 48: Peru GDP and Population, 2023-2030 ($)
Figure 49: Peru GDP – Composition of 2023, By Sector of Origin
Figure 50: Peru Export and Import Value & Volume, 2023-2030 ($)
Figure 51: Colombia Nanosensor Market Value & Volume, 2023-2030 ($)
Figure 52: Colombia GDP and Population, 2023-2030 ($)
Figure 53: Colombia GDP – Composition of 2023, By Sector of Origin
Figure 54: Colombia Export and Import Value & Volume, 2023-2030 ($)
Figure 55: Costa Rica Nanosensor Market Value & Volume, 2023-2030 ($)
Figure 56: Costa Rica GDP and Population, 2023-2030 ($)
Figure 57: Costa Rica GDP – Composition of 2023, By Sector of Origin
Figure 58: Costa Rica Export and Import Value & Volume, 2023-2030 ($)
Figure 59: Europe Nanosensor Market Value & Volume, 2023-2030 ($)
Figure 60: U.K Nanosensor Market Value & Volume, 2023-2030 ($)
Figure 61: U.K GDP and Population, 2023-2030 ($)
Figure 62: U.K GDP – Composition of 2023, By Sector of Origin
Figure 63: U.K Export and Import Value & Volume, 2023-2030 ($)
Figure 64: Germany Nanosensor Market Value & Volume, 2023-2030 ($)
Figure 65: Germany GDP and Population, 2023-2030 ($)
Figure 66: Germany GDP – Composition of 2023, By Sector of Origin
Figure 67: Germany Export and Import Value & Volume, 2023-2030 ($)
Figure 68: Italy Nanosensor Market Value & Volume, 2023-2030 ($)
Figure 69: Italy GDP and Population, 2023-2030 ($)
Figure 70: Italy GDP – Composition of 2023, By Sector of Origin
Figure 71: Italy Export and Import Value & Volume, 2023-2030 ($)
Figure 72: France Nanosensor Market Value & Volume, 2023-2030 ($)
Figure 73: France GDP and Population, 2023-2030 ($)
Figure 74: France GDP – Composition of 2023, By Sector of Origin
Figure 75: France Export and Import Value & Volume, 2023-2030 ($)
Figure 76: Netherlands Nanosensor Market Value & Volume, 2023-2030 ($)
Figure 77: Netherlands GDP and Population, 2023-2030 ($)
Figure 78: Netherlands GDP – Composition of 2023, By Sector of Origin
Figure 79: Netherlands Export and Import Value & Volume, 2023-2030 ($)
Figure 80: Belgium Nanosensor Market Value & Volume, 2023-2030 ($)
Figure 81: Belgium GDP and Population, 2023-2030 ($)
Figure 82: Belgium GDP – Composition of 2023, By Sector of Origin
Figure 83: Belgium Export and Import Value & Volume, 2023-2030 ($)
Figure 84: Spain Nanosensor Market Value & Volume, 2023-2030 ($)
Figure 85: Spain GDP and Population, 2023-2030 ($)
Figure 86: Spain GDP – Composition of 2023, By Sector of Origin
Figure 87: Spain Export and Import Value & Volume, 2023-2030 ($)
Figure 88: Denmark Nanosensor Market Value & Volume, 2023-2030 ($)
Figure 89: Denmark GDP and Population, 2023-2030 ($)
Figure 90: Denmark GDP – Composition of 2023, By Sector of Origin
Figure 91: Denmark Export and Import Value & Volume, 2023-2030 ($)
Figure 92: APAC Nanosensor Market Value & Volume, 2023-2030 ($)
Figure 93: China Nanosensor Market Value & Volume, 2023-2030
Figure 94: China GDP and Population, 2023-2030 ($)
Figure 95: China GDP – Composition of 2023, By Sector of Origin
Figure 96: China Export and Import Value & Volume, 2023-2030 ($)Nanosensor Market China Export and Import Value & Volume, 2023-2030 ($)
Figure 97: Australia Nanosensor Market Value & Volume, 2023-2030 ($)
Figure 98: Australia GDP and Population, 2023-2030 ($)
Figure 99: Australia GDP – Composition of 2023, By Sector of Origin
Figure 100: Australia Export and Import Value & Volume, 2023-2030 ($)
Figure 101: South Korea Nanosensor Market Value & Volume, 2023-2030 ($)
Figure 102: South Korea GDP and Population, 2023-2030 ($)
Figure 103: South Korea GDP – Composition of 2023, By Sector of Origin
Figure 104: South Korea Export and Import Value & Volume, 2023-2030 ($)
Figure 105: India Nanosensor Market Value & Volume, 2023-2030 ($)
Figure 106: India GDP and Population, 2023-2030 ($)
Figure 107: India GDP – Composition of 2023, By Sector of Origin
Figure 108: India Export and Import Value & Volume, 2023-2030 ($)
Figure 109: Taiwan Nanosensor Market Value & Volume, 2023-2030 ($)
Figure 110: Taiwan GDP and Population, 2023-2030 ($)
Figure 111: Taiwan GDP – Composition of 2023, By Sector of Origin
Figure 112: Taiwan Export and Import Value & Volume, 2023-2030 ($)
Figure 113: Malaysia Nanosensor Market Value & Volume, 2023-2030 ($)
Figure 114: Malaysia GDP and Population, 2023-2030 ($)
Figure 115: Malaysia GDP – Composition of 2023, By Sector of Origin
Figure 116: Malaysia Export and Import Value & Volume, 2023-2030 ($)
Figure 117: Hong Kong Nanosensor Market Value & Volume, 2023-2030 ($)
Figure 118: Hong Kong GDP and Population, 2023-2030 ($)
Figure 119: Hong Kong GDP – Composition of 2023, By Sector of Origin
Figure 120: Hong Kong Export and Import Value & Volume, 2023-2030 ($)
Figure 121: Middle East & Africa Nanosensor Market Middle East & Africa 3D Printing Market Value & Volume, 2023-2030 ($)
Figure 122: Russia Nanosensor Market Value & Volume, 2023-2030 ($)
Figure 123: Russia GDP and Population, 2023-2030 ($)
Figure 124: Russia GDP – Composition of 2023, By Sector of Origin
Figure 125: Russia Export and Import Value & Volume, 2023-2030 ($)
Figure 126: Israel Nanosensor Market Value & Volume, 2023-2030 ($)
Figure 127: Israel GDP and Population, 2023-2030 ($)
Figure 128: Israel GDP – Composition of 2023, By Sector of Origin
Figure 129: Israel Export and Import Value & Volume, 2023-2030 ($)
Figure 130: Entropy Share, By Strategies, 2023-2030* (%)Nanosensor Market
Figure 131: Developments, 2023-2030*Nanosensor Market
Figure 132: Company 1 Nanosensor Market Net Revenue, By Years, 2023-2030* ($)
Figure 133: Company 1 Nanosensor Market Net Revenue Share, By Business segments, 2023 (%)
Figure 134: Company 1 Nanosensor Market Net Sales Share, By Geography, 2023 (%)
Figure 135: Company 2 Nanosensor Market Net Revenue, By Years, 2023-2030* ($)
Figure 136: Company 2 Nanosensor Market Net Revenue Share, By Business segments, 2023 (%)
Figure 137: Company 2 Nanosensor Market Net Sales Share, By Geography, 2023 (%)
Figure 138: Company 3 Nanosensor Market Net Revenue, By Years, 2023-2030* ($)
Figure 139: Company 3 Nanosensor Market Net Revenue Share, By Business segments, 2023 (%)
Figure 140: Company 3 Nanosensor Market Net Sales Share, By Geography, 2023 (%)
Figure 141: Company 4 Nanosensor Market Net Revenue, By Years, 2023-2030* ($)
Figure 142: Company 4 Nanosensor Market Net Revenue Share, By Business segments, 2023 (%)
Figure 143: Company 4 Nanosensor Market Net Sales Share, By Geography, 2023 (%)
Figure 144: Company 5 Nanosensor Market Net Revenue, By Years, 2023-2030* ($)
Figure 145: Company 5 Nanosensor Market Net Revenue Share, By Business segments, 2023 (%)
Figure 146: Company 5 Nanosensor Market Net Sales Share, By Geography, 2023 (%)
Figure 147: Company 6 Nanosensor Market Net Revenue, By Years, 2023-2030* ($)
Figure 148: Company 6 Nanosensor Market Net Revenue Share, By Business segments, 2023 (%)
Figure 149: Company 6 Nanosensor Market Net Sales Share, By Geography, 2023 (%)
Figure 150: Company 7 Nanosensor Market Net Revenue, By Years, 2023-2030* ($)
Figure 151: Company 7 Nanosensor Market Net Revenue Share, By Business segments, 2023 (%)
Figure 152: Company 7 Nanosensor Market Net Sales Share, By Geography, 2023 (%)
Figure 153: Company 8 Nanosensor Market Net Revenue, By Years, 2023-2030* ($)
Figure 154: Company 8 Nanosensor Market Net Revenue Share, By Business segments, 2023 (%)
Figure 155: Company 8 Nanosensor Market Net Sales Share, By Geography, 2023 (%)
Figure 156: Company 9 Nanosensor Market Net Revenue, By Years, 2023-2030* ($)
Figure 157: Company 9 Nanosensor Market Net Revenue Share, By Business segments, 2023 (%)
Figure 158: Company 9 Nanosensor Market Net Sales Share, By Geography, 2023 (%)
Figure 159: Company 10 Nanosensor Market Net Revenue, By Years, 2023-2030* ($)
Figure 160: Company 10 Nanosensor Market Net Revenue Share, By Business segments, 2023 (%)
Figure 161: Company 10 Nanosensor Market Net Sales Share, By Geography, 2023 (%)
Figure 162: Company 11 Nanosensor Market Net Revenue, By Years, 2023-2030* ($)
Figure 163: Company 11 Nanosensor Market Net Revenue Share, By Business segments, 2023 (%)
Figure 164: Company 11 Nanosensor Market Net Sales Share, By Geography, 2023 (%)
Figure 165: Company 12 Nanosensor Market Net Revenue, By Years, 2023-2030* ($)
Figure 166: Company 12 Nanosensor Market Net Revenue Share, By Business segments, 2023 (%)
Figure 167: Company 12 Nanosensor Market Net Sales Share, By Geography, 2023 (%)
Figure 168: Company 13 Nanosensor Market Net Revenue, By Years, 2023-2030* ($)
Figure 169: Company 13 Nanosensor Market Net Revenue Share, By Business segments, 2023 (%)
Figure 170: Company 13 Nanosensor Market Net Sales Share, By Geography, 2023 (%)
Figure 171: Company 14 Nanosensor Market Net Revenue, By Years, 2023-2030* ($)
Figure 172: Company 14 Nanosensor Market Net Revenue Share, By Business segments, 2023 (%)
Figure 173: Company 14 Nanosensor Market Net Sales Share, By Geography, 2023 (%)
Figure 174: Company 15 Nanosensor Market Net Revenue, By Years, 2023-2030* ($)
Figure 175: Company 15 Nanosensor Market Net Revenue Share, By Business segments, 2023 (%)
Figure 176: Company 15 Nanosensor Market Net Sales Share, By Geography, 2023 (%)