 Email
Email Print
Print


Odometer Market Overview:
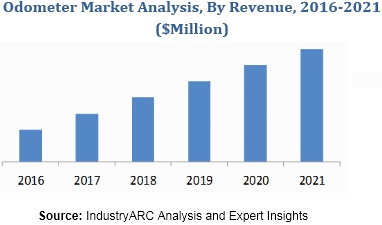
Odometer Market Size is forecast to reach $ 4530.9 Million by 2030, at a CAGR of 9.20% during forecast period 2024-2030. Odometer calculates the distance covered or travelled by vehicle. Odometer is also known as milometer or mileometer in some parts of the world. In past, odometers were completely mechanical but due to advancement in technology, electronic odometers are developed and widely used. Some odometers are even a combination of both mechanical and electronics. Odometer calculates the distance traveled by vehicles by counting number of wheel rotations times the tire circumference. Nowadays, GPS are also used as odometers and is considered more precise and accurate. A GPS receiver with odometer mode servers as both odometer and speedometer and considered a highly inexpensive and precise device.
The report classifies the odometer market with respect to type of vehicle in which the device is used. These includes bicycles, two-wheelers such as motorbikes and sports bikes, three-wheelers, and four-wheelers such as passenger cars, heavy commercial vehicles, light commercial vehicles, buses, trucks, luxury car etc. The rate of penetration of the odometer in the four-wheelers is high as compared to other types of vehicles.
The report gives insightful information about the different driving and restraining factors impacting the odometer market. The increasing use of trip meters instead of odometers as trip meters can be reset at any point of journey and hence is the major challenge to the odometer market. The opportunities in terms of application, technological advancements, and geographic reach are also analyzed in the report. The demand and supply-side factors, value chain analysis, pricing analysis, and mapping of suppliers and end-users with manufacturers are also covered in the report.
The report also covers the various types of odometers depending on their functions. These include mechanical, electronics, and hybrid. Hybrid odometers are a combination of both mechanical and electronics and are currently used in the market. The rate of penetration of electronic odometers is high compared to other types of odometers. These are considered highly precise and less expensive. The report offers the market share and sizing of all these types of odometers along with their rate of penetration in all geographies.
The geographical market analysis is covered exhaustively in the report with special focus on different regions such as North America, Europe, APAC, Latin America, and Middle-East and Africa. As automobile industry is highly flourished in countries such as the U.S. India, China, Japan, and Germany, the odometer market has high growth potential in these countries. Recently, North America, and Europe accounts for high share in the odometer market with Asia-Pacific having high growth rate.
The report also gives detailed insights on the competitiveness of the market under market entropy section. The major strategies adopted are new product launches, mergers & acquisitions, partnerships, agreements, and collaborations among others. The key market players are analyzed and profiled in detail in the report. This section covers the business financials, company snapshots, key products & services, major developments, future programs (if any), and finally, the individual SWOT analysis.
Key Market Players:
The Top 5 companies in the Odometer Market are:
- Shenzhen Chileaf Electronics
- Jajodia Commodities Private Limited
- Anyline
- Avon
- Smartcar
For more "Electronics" related reports, please click here
1. Odometer Market - Overview
1.1. Definitions and Scope
2. Odometer Market - Executive summary
2.1. Market Revenue, Market Size and Key Trends by Company
2.2. Key Trends by type of Application
2.3. Key Trends segmented by Geography
3. Odometer Market
3.1. Comparative analysis
3.1.1. Product Benchmarking - Top 10 companies
3.1.2. Top 5 Financials Analysis
3.1.3. Market Value split by Top 10 companies
3.1.4. Patent Analysis - Top 10 companies
3.1.5. Pricing Analysis
4. Odometer Market – Startup companies Scenario Premium
4.1. Top 10 startup company Analysis by
4.1.1. Investment
4.1.2. Revenue
4.1.3. Market Shares
4.1.4. Market Size and Application Analysis
4.1.5. Venture Capital and Funding Scenario
5. Odometer Market – Industry Market Entry Scenario Premium
5.1. Regulatory Framework Overview
5.2. New Business and Ease of Doing business index
5.3. Case studies of successful ventures
5.4. Customer Analysis – Top 10 companies
6. Odometer Market Forces
6.1. Drivers
6.2. Constraints
6.3. Challenges
6.4. Porters five force model
6.4.1. Bargaining power of suppliers
6.4.2. Bargaining powers of customers
6.4.3. Threat of new entrants
6.4.4. Rivalry among existing players
6.4.5. Threat of substitutes
7. Odometer Market -Strategic analysis
7.1. Value chain analysis
7.2. Opportunities analysis
7.3. Product life cycle
7.4. Suppliers and distributors Market Share
8. Odometer Market – By Type of vehicles (Market Size -$Million / $Billion)
8.1. Market Size and Market Share Analysis
8.2. Application Revenue and Trend Research
8.3. Product Segment Analysis
8.3.1. Bicycles
8.3.2. Two-Wheelersc
8.3.3. Three-Wheelers
8.3.4. Four Wheelers
9. Odometer Market – By Type (Market Size -$Million / $Billion)
9.1. Mechanical
9.2. Electronics
9.3. Hybrid
10. Odometer - By Geography (Market Size -$Million / $Billion)
10.1. Odometer Market - North America Segment Research
10.2. North America Market Research (Million / $Billion)
10.2.1. Segment type Size and Market Size Analysis
10.2.2. Revenue and Trends
10.2.3. Application Revenue and Trends by type of Application
10.2.4. Company Revenue and Product Analysis
10.2.5. North America Product type and Application Market Size
10.2.5.1. U.S.
10.2.5.2. Canada
10.2.5.3. Mexico
10.2.5.4. Rest of North America
10.3. Odometer - South America Segment Research
10.4. South America Market Research (Market Size -$Million / $Billion)
10.4.1. Segment type Size and Market Size Analysis
10.4.2. Revenue and Trends
10.4.3. Application Revenue and Trends by type of Application
10.4.4. Company Revenue and Product Analysis
10.4.5. South America Product type and Application Market Size
10.4.5.1. Brazil
10.4.5.2. Venezuela
10.4.5.3. Argentina
10.4.5.4. Ecuador
10.4.5.5. Peru
10.4.5.6. Colombia
10.4.5.7. Costa Rica
10.4.5.8. Rest of South America
10.5. Odometer - Europe Segment Research
10.6. Europe Market Research (Market Size -$Million / $Billion)
10.6.1. Segment type Size and Market Size Analysis
10.6.2. Revenue and Trends
10.6.3. Application Revenue and Trends by type of Application
10.6.4. Company Revenue and Product Analysis
10.6.5. Europe Segment Product type and Application Market Size
10.6.5.1. U.K
10.6.5.2. Germany
10.6.5.3. Italy
10.6.5.4. France
10.6.5.5. Netherlands
10.6.5.6. Belgium
10.6.5.7. Spain
10.6.5.8. Denmark
10.6.5.9. Rest of Europe
10.7. Odometer – APAC Segment Research
10.8. APAC Market Research (Market Size -$Million / $Billion)
10.8.1. Segment type Size and Market Size Analysis
10.8.2. Revenue and Trends
10.8.3. Application Revenue and Trends by type of Application
10.8.4. Company Revenue and Product Analysis
10.8.5. APAC Segment – Product type and Application Market Size
10.8.5.1. China
10.8.5.2. Australia
10.8.5.3. Japan
10.8.5.4. South Korea
10.8.5.5. India
10.8.5.6. Taiwan
10.8.5.7. Malaysia
11. Odometer Market - Entropy
11.1. New product launches
11.2. M&A's, collaborations, JVs and partnerships
12. Odometer Market – Industry / Segment Competition landscape Premium
12.1. Market Share Analysis
12.1.1. Market Share by Country- Top companies
12.1.2. Market Share by Region- Top 10 companies
12.1.3. Market Share by type of Application – Top 10 companies
12.1.4. Market Share by type of Product / Product category- Top 10 companies
12.1.5. Market Share at global level- Top 10 companies
12.1.6. Best Practises for companies
13. Odometer Market – Key Company List by Country Premium
14. Odometer Market Company Analysis
14.1. Market Share, Company Revenue, Products, M&A, Developments
14.2. OBD Auto Diagnostic Equipment Co.,Ltd
14.3. TENET AUTO ELECTRONICS LIMITED
14.4. OBDSTAR
14.5. Hae Tech Co. Ltd.
14.6. Odometer Gears
14.7. Company 6
14.8. Company 7
14.9. Company 8
14.10. Company 9
14.11. Company 10 and More
"*Financials would be provided on a best efforts basis for private companies"
15. Odometer Market -Appendix
15.1. Abbreviations
15.2. Sources
16. Odometer Market -Methodology Premium
16.1. Research Methodology
16.1.1. Company Expert Interviews
16.1.2. Industry Databases
16.1.3. Associations
16.1.4. Company News
16.1.5. Company Annual Reports
16.1.6. Application Trends
16.1.7. New Products and Product database
16.1.8. Company Transcripts
16.1.9. R&D Trends
16.1.10. Key Opinion Leaders Interviews
16.1.11. Supply and Demand Trends
List of Tables:
Table 1: Odometer Market Overview 2023-2030
Table 2: Odometer Market Leader Analysis 2023-2030 (US$)
Table 3: Odometer Market Product Analysis 2023-2030 (US$)
Table 4: Odometer Market End User Analysis 2023-2030 (US$)
Table 5: Odometer Market Patent Analysis 2013-2023* (US$)
Table 6: Odometer Market Financial Analysis 2023-2030 (US$)
Table 7: Odometer Market Driver Analysis 2023-2030 (US$)
Table 8: Odometer Market Challenges Analysis 2023-2030 (US$)
Table 9: Odometer Market Constraint Analysis 2023-2030 (US$)
Table 10: Odometer Market Supplier Bargaining Power Analysis 2023-2030 (US$)
Table 11: Odometer Market Buyer Bargaining Power Analysis 2023-2030 (US$)
Table 12: Odometer Market Threat of Substitutes Analysis 2023-2030 (US$)
Table 13: Odometer Market Threat of New Entrants Analysis 2023-2030 (US$)
Table 14: Odometer Market Degree of Competition Analysis 2023-2030 (US$)
Table 15: Odometer Market Value Chain Analysis 2023-2030 (US$)
Table 16: Odometer Market Pricing Analysis 2023-2030 (US$)
Table 17: Odometer Market Opportunities Analysis 2023-2030 (US$)
Table 18: Odometer Market Product Life Cycle Analysis 2023-2030 (US$)
Table 19: Odometer Market Supplier Analysis 2023-2030 (US$)
Table 20: Odometer Market Distributor Analysis 2023-2030 (US$)
Table 21: Odometer Market Trend Analysis 2023-2030 (US$)
Table 22: Odometer Market Size 2023 (US$)
Table 23: Odometer Market Forecast Analysis 2023-2030 (US$)
Table 24: Odometer Market Sales Forecast Analysis 2023-2030 (Units)
Table 25: Odometer Market , Revenue & Volume,By Type, 2023-2030 ($)
Table 26: Odometer Market By Type, Revenue & Volume,By Mechanical, 2023-2030 ($)
Table 27: Odometer Market By Type, Revenue & Volume,By Electronics, 2023-2030 ($)
Table 28: Odometer Market By Type, Revenue & Volume,By Hybrid, 2023-2030 ($)
Table 29: Odometer Market , Revenue & Volume,By Type of vehicles, 2023-2030 ($)
Table 30: Odometer Market By Type of vehicles, Revenue & Volume,By Bicycles, 2023-2030 ($)
Table 31: Odometer Market By Type of vehicles, Revenue & Volume,By Two-Wheelers, 2023-2030 ($)
Table 32: Odometer Market By Type of vehicles, Revenue & Volume,By Three-Wheelers, 2023-2030 ($)
Table 33: Odometer Market By Type of vehicles, Revenue & Volume,By Four Wheelers, 2023-2030 ($)
Table 34: North America Odometer Market , Revenue & Volume,By Type, 2023-2030 ($)
Table 35: North America Odometer Market , Revenue & Volume,By Type of vehicles, 2023-2030 ($)
Table 36: South america Odometer Market , Revenue & Volume,By Type, 2023-2030 ($)
Table 37: South america Odometer Market , Revenue & Volume,By Type of vehicles, 2023-2030 ($)
Table 38: Europe Odometer Market , Revenue & Volume,By Type, 2023-2030 ($)
Table 39: Europe Odometer Market , Revenue & Volume,By Type of vehicles, 2023-2030 ($)
Table 40: APAC Odometer Market , Revenue & Volume,By Type, 2023-2030 ($)
Table 41: APAC Odometer Market , Revenue & Volume,By Type of vehicles, 2023-2030 ($)
Table 42: Middle East & Africa Odometer Market , Revenue & Volume,By Type, 2023-2030 ($)
Table 43: Middle East & Africa Odometer Market , Revenue & Volume,By Type of vehicles, 2023-2030 ($)
Table 44: Russia Odometer Market , Revenue & Volume,By Type, 2023-2030 ($)
Table 45: Russia Odometer Market , Revenue & Volume,By Type of vehicles, 2023-2030 ($)
Table 46: Israel Odometer Market , Revenue & Volume,By Type, 2023-2030 ($)
Table 47: Israel Odometer Market , Revenue & Volume,By Type of vehicles, 2023-2030 ($)
Table 48: Top Companies 2023 (US$)Odometer Market , Revenue & Volume
Table 49: Product Launch 2023-2030 Odometer Market , Revenue & Volume
Table 50: Mergers & Acquistions 2023-2030 Odometer Market , Revenue & Volume
List of Figures:
Figure 1: Overview of Odometer Market 2023-2030
Figure 2: Market Share Analysis for Odometer Market 2023 (US$)
Figure 3: Product Comparison in Odometer Market 2023-2030 (US$)
Figure 4: End User Profile for Odometer Market 2023-2030 (US$)
Figure 5: Patent Application and Grant in Odometer Market 2013-2023* (US$)
Figure 6: Top 5 Companies Financial Analysis in Odometer Market 2023-2030 (US$)
Figure 7: Market Entry Strategy in Odometer Market 2023-2030
Figure 8: Ecosystem Analysis in Odometer Market 2023
Figure 9: Average Selling Price in Odometer Market 2023-2030
Figure 10: Top Opportunites in Odometer Market 2023-2030
Figure 11: Market Life Cycle Analysis in Odometer Market
Figure 12: Global By Type Odometer Market Revenue, 2023-2030 ($)
Figure 13: Global By Type of vehicles Odometer Market Revenue, 2023-2030 ($)
Figure 14: Global Odometer Market - By Geography
Figure 15: Global Odometer Market Value & Volume, By Geography, 2023-2030 ($)
Figure 16: Global Odometer Market CAGR, By Geography, 2023-2030 (%)
Figure 17: North America Odometer Market Value & Volume, 2023-2030 ($)
Figure 18: US Odometer Market Value & Volume, 2023-2030 ($)
Figure 19: US GDP and Population, 2023-2030 ($)
Figure 20: US GDP – Composition of 2023, By Sector of Origin
Figure 21: US Export and Import Value & Volume, 2023-2030 ($)
Figure 22: Canada Odometer Market Value & Volume, 2023-2030 ($)
Figure 23: Canada GDP and Population, 2023-2030 ($)
Figure 24: Canada GDP – Composition of 2023, By Sector of Origin
Figure 25: Canada Export and Import Value & Volume, 2023-2030 ($)
Figure 26: Mexico Odometer Market Value & Volume, 2023-2030 ($)
Figure 27: Mexico GDP and Population, 2023-2030 ($)
Figure 28: Mexico GDP – Composition of 2023, By Sector of Origin
Figure 29: Mexico Export and Import Value & Volume, 2023-2030 ($)
Figure 30: South America Odometer Market South America 3D Printing Market Value & Volume, 2023-2030 ($)
Figure 31: Brazil Odometer Market Value & Volume, 2023-2030 ($)
Figure 32: Brazil GDP and Population, 2023-2030 ($)
Figure 33: Brazil GDP – Composition of 2023, By Sector of Origin
Figure 34: Brazil Export and Import Value & Volume, 2023-2030 ($)
Figure 35: Venezuela Odometer Market Value & Volume, 2023-2030 ($)
Figure 36: Venezuela GDP and Population, 2023-2030 ($)
Figure 37: Venezuela GDP – Composition of 2023, By Sector of Origin
Figure 38: Venezuela Export and Import Value & Volume, 2023-2030 ($)
Figure 39: Argentina Odometer Market Value & Volume, 2023-2030 ($)
Figure 40: Argentina GDP and Population, 2023-2030 ($)
Figure 41: Argentina GDP – Composition of 2023, By Sector of Origin
Figure 42: Argentina Export and Import Value & Volume, 2023-2030 ($)
Figure 43: Ecuador Odometer Market Value & Volume, 2023-2030 ($)
Figure 44: Ecuador GDP and Population, 2023-2030 ($)
Figure 45: Ecuador GDP – Composition of 2023, By Sector of Origin
Figure 46: Ecuador Export and Import Value & Volume, 2023-2030 ($)
Figure 47: Peru Odometer Market Value & Volume, 2023-2030 ($)
Figure 48: Peru GDP and Population, 2023-2030 ($)
Figure 49: Peru GDP – Composition of 2023, By Sector of Origin
Figure 50: Peru Export and Import Value & Volume, 2023-2030 ($)
Figure 51: Colombia Odometer Market Value & Volume, 2023-2030 ($)
Figure 52: Colombia GDP and Population, 2023-2030 ($)
Figure 53: Colombia GDP – Composition of 2023, By Sector of Origin
Figure 54: Colombia Export and Import Value & Volume, 2023-2030 ($)
Figure 55: Costa Rica Odometer Market Costa Rica 3D Printing Market Value & Volume, 2023-2030 ($)
Figure 56: Costa Rica GDP and Population, 2023-2030 ($)
Figure 57: Costa Rica GDP – Composition of 2023, By Sector of Origin
Figure 58: Costa Rica Export and Import Value & Volume, 2023-2030 ($)
Figure 59: Europe Odometer Market Value & Volume, 2023-2030 ($)
Figure 60: U.K Odometer Market Value & Volume, 2023-2030 ($)
Figure 61: U.K GDP and Population, 2023-2030 ($)
Figure 62: U.K GDP – Composition of 2023, By Sector of Origin
Figure 63: U.K Export and Import Value & Volume, 2023-2030 ($)
Figure 64: Germany Odometer Market Value & Volume, 2023-2030 ($)
Figure 65: Germany GDP and Population, 2023-2030 ($)
Figure 66: Germany GDP – Composition of 2023, By Sector of Origin
Figure 67: Germany Export and Import Value & Volume, 2023-2030 ($)
Figure 68: Italy Odometer Market Value & Volume, 2023-2030 ($)
Figure 69: Italy GDP and Population, 2023-2030 ($)
Figure 70: Italy GDP – Composition of 2023, By Sector of Origin
Figure 71: Italy Export and Import Value & Volume, 2023-2030 ($)
Figure 72: France Odometer Market Value & Volume, 2023-2030 ($)
Figure 73: France GDP and Population, 2023-2030 ($)
Figure 74: France GDP – Composition of 2023, By Sector of Origin
Figure 75: France Export and Import Value & Volume, 2023-2030 ($)
Figure 76: Netherlands Odometer Market Value & Volume, 2023-2030 ($)
Figure 77: Netherlands GDP and Population, 2023-2030 ($)
Figure 78: Netherlands GDP – Composition of 2023, By Sector of Origin
Figure 79: Netherlands Export and Import Value & Volume, 2023-2030 ($)
Figure 80: Belgium Odometer Market Value & Volume, 2023-2030 ($)
Figure 81: Belgium GDP and Population, 2023-2030 ($)
Figure 82: Belgium GDP – Composition of 2023, By Sector of Origin
Figure 83: Belgium Export and Import Value & Volume, 2023-2030 ($)
Figure 84: Spain Odometer Market Value & Volume, 2023-2030 ($)
Figure 85: Spain GDP and Population, 2023-2030 ($)
Figure 86: Spain GDP – Composition of 2023, By Sector of Origin
Figure 87: Spain Export and Import Value & Volume, 2023-2030 ($)
Figure 88: Denmark Odometer Market Value & Volume, 2023-2030 ($)
Figure 89: Denmark GDP and Population, 2023-2030 ($)
Figure 90: Denmark GDP – Composition of 2023, By Sector of Origin
Figure 91: Denmark Export and Import Value & Volume, 2023-2030 ($)
Figure 92: APAC Odometer Market Value & Volume, 2023-2030 ($)
Figure 93: China Odometer Market Value & Volume, 2023-2030
Figure 94: China GDP and Population, 2023-2030 ($)
Figure 95: China GDP – Composition of 2023, By Sector of Origin
Figure 96: China Export and Import Value & Volume, 2023-2030 ($)Odometer Market China Export and Import Value & Volume, 2023-2030 ($)
Figure 97: Australia Odometer Market Value & Volume, 2023-2030 ($)
Figure 98: Australia GDP and Population, 2023-2030 ($)
Figure 99: Australia GDP – Composition of 2023, By Sector of Origin
Figure 100: Australia Export and Import Value & Volume, 2023-2030 ($)
Figure 101: South Korea Odometer Market Value & Volume, 2023-2030 ($)
Figure 102: South Korea GDP and Population, 2023-2030 ($)
Figure 103: South Korea GDP – Composition of 2023, By Sector of Origin
Figure 104: South Korea Export and Import Value & Volume, 2023-2030 ($)
Figure 105: India Odometer Market Value & Volume, 2023-2030 ($)
Figure 106: India GDP and Population, 2023-2030 ($)
Figure 107: India GDP – Composition of 2023, By Sector of Origin
Figure 108: India Export and Import Value & Volume, 2023-2030 ($)
Figure 109: Taiwan Odometer Market Taiwan 3D Printing Market Value & Volume, 2023-2030 ($)
Figure 110: Taiwan GDP and Population, 2023-2030 ($)
Figure 111: Taiwan GDP – Composition of 2023, By Sector of Origin
Figure 112: Taiwan Export and Import Value & Volume, 2023-2030 ($)
Figure 113: Malaysia Odometer Market Malaysia 3D Printing Market Value & Volume, 2023-2030 ($)
Figure 114: Malaysia GDP and Population, 2023-2030 ($)
Figure 115: Malaysia GDP – Composition of 2023, By Sector of Origin
Figure 116: Malaysia Export and Import Value & Volume, 2023-2030 ($)
Figure 117: Hong Kong Odometer Market Hong Kong 3D Printing Market Value & Volume, 2023-2030 ($)
Figure 118: Hong Kong GDP and Population, 2023-2030 ($)
Figure 119: Hong Kong GDP – Composition of 2023, By Sector of Origin
Figure 120: Hong Kong Export and Import Value & Volume, 2023-2030 ($)
Figure 121: Middle East & Africa Odometer Market Middle East & Africa 3D Printing Market Value & Volume, 2023-2030 ($)
Figure 122: Russia Odometer Market Russia 3D Printing Market Value & Volume, 2023-2030 ($)
Figure 123: Russia GDP and Population, 2023-2030 ($)
Figure 124: Russia GDP – Composition of 2023, By Sector of Origin
Figure 125: Russia Export and Import Value & Volume, 2023-2030 ($)
Figure 126: Israel Odometer Market Value & Volume, 2023-2030 ($)
Figure 127: Israel GDP and Population, 2023-2030 ($)
Figure 128: Israel GDP – Composition of 2023, By Sector of Origin
Figure 129: Israel Export and Import Value & Volume, 2023-2030 ($)
Figure 130: Entropy Share, By Strategies, 2023-2030* (%)Odometer Market
Figure 131: Developments, 2023-2030*Odometer Market
Figure 132: Company 1 Odometer Market Net Revenue, By Years, 2023-2030* ($)
Figure 133: Company 1 Odometer Market Net Revenue Share, By Business segments, 2023 (%)
Figure 134: Company 1 Odometer Market Net Sales Share, By Geography, 2023 (%)
Figure 135: Company 2 Odometer Market Net Revenue, By Years, 2023-2030* ($)
Figure 136: Company 2 Odometer Market Net Revenue Share, By Business segments, 2023 (%)
Figure 137: Company 2 Odometer Market Net Sales Share, By Geography, 2023 (%)
Figure 138: Company 3 Odometer Market Net Revenue, By Years, 2023-2030* ($)
Figure 139: Company 3 Odometer Market Net Revenue Share, By Business segments, 2023 (%)
Figure 140: Company 3 Odometer Market Net Sales Share, By Geography, 2023 (%)
Figure 141: Company 4 Odometer Market Net Revenue, By Years, 2023-2030* ($)
Figure 142: Company 4 Odometer Market Net Revenue Share, By Business segments, 2023 (%)
Figure 143: Company 4 Odometer Market Net Sales Share, By Geography, 2023 (%)
Figure 144: Company 5 Odometer Market Net Revenue, By Years, 2023-2030* ($)
Figure 145: Company 5 Odometer Market Net Revenue Share, By Business segments, 2023 (%)
Figure 146: Company 5 Odometer Market Net Sales Share, By Geography, 2023 (%)
Figure 147: Company 6 Odometer Market Net Revenue, By Years, 2023-2030* ($)
Figure 148: Company 6 Odometer Market Net Revenue Share, By Business segments, 2023 (%)
Figure 149: Company 6 Odometer Market Net Sales Share, By Geography, 2023 (%)
Figure 150: Company 7 Odometer Market Net Revenue, By Years, 2023-2030* ($)
Figure 151: Company 7 Odometer Market Net Revenue Share, By Business segments, 2023 (%)
Figure 152: Company 7 Odometer Market Net Sales Share, By Geography, 2023 (%)
Figure 153: Company 8 Odometer Market Net Revenue, By Years, 2023-2030* ($)
Figure 154: Company 8 Odometer Market Net Revenue Share, By Business segments, 2023 (%)
Figure 155: Company 8 Odometer Market Net Sales Share, By Geography, 2023 (%)
Figure 156: Company 9 Odometer Market Net Revenue, By Years, 2023-2030* ($)
Figure 157: Company 9 Odometer Market Net Revenue Share, By Business segments, 2023 (%)
Figure 158: Company 9 Odometer Market Net Sales Share, By Geography, 2023 (%)
Figure 159: Company 10 Odometer Market Net Revenue, By Years, 2023-2030* ($)
Figure 160: Company 10 Odometer Market Net Revenue Share, By Business segments, 2023 (%)
Figure 161: Company 10 Odometer Market Net Sales Share, By Geography, 2023 (%)
Figure 162: Company 11 Odometer Market Net Revenue, By Years, 2023-2030* ($)
Figure 163: Company 11 Odometer Market Net Revenue Share, By Business segments, 2023 (%)
Figure 164: Company 11 Odometer Market Net Sales Share, By Geography, 2023 (%)
Figure 165: Company 12 Odometer Market Net Revenue, By Years, 2023-2030* ($)
Figure 166: Company 12 Odometer Market Net Revenue Share, By Business segments, 2023 (%)
Figure 167: Company 12 Odometer Market Net Sales Share, By Geography, 2023 (%)
Figure 168: Company 13 Odometer Market Net Revenue, By Years, 2023-2030* ($)
Figure 169: Company 13 Odometer Market Net Revenue Share, By Business segments, 2023 (%)
Figure 170: Company 13 Odometer Market Net Sales Share, By Geography, 2023 (%)
Figure 171: Company 14 Odometer Market Net Revenue, By Years, 2023-2030* ($)
Figure 172: Company 14 Odometer Market Net Revenue Share, By Business segments, 2023 (%)
Figure 173: Company 14 Odometer Market Net Sales Share, By Geography, 2023 (%)
Figure 174: Company 15 Odometer Market Net Revenue, By Years, 2023-2030* ($)
Figure 175: Company 15 Odometer Market Net Revenue Share, By Business segments, 2023 (%)
Figure 176: Company 15 Odometer Market Net Sales Share, By Geography, 2023 (%)