 Email
Email Print
Print


Exhaust Gas Temperature Gauge Market - Forecast(2025 - 2031)
Exhaust Gas Temperature Gauge Market Overview
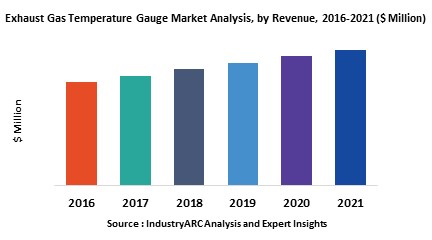
Exhaust Gas Temperature Gauge Market Size is forecast to reach $ 11,300 Million by 2030, at a CAGR of 5.10% during forecast period 2024-2030. An exhaust gas temperature gauge is device that, as the name suggests, is used to gauge the temperature of an exhaust gas, typically, of an internal combustion engine. It provides an indication to the driver that the engine could be overheating and needs to be checked. An exhaust gas temperature gauge is also known as an EGT gauge or a pyrometer gauge. It comprises a thermocouple or a temperature sensing probe and is designed to detect high temperatures. The gases typically emitted from vehicles include nitrogen oxide, carbon monoxide and other particulate matter and pollutants such as sulphur dioxide and ammonia. An exhaust gas temperature gauge also provides an indication of the health of an engine.
Increasing number of regulations with regard to emissions and environmental impact of vehicular emissions is expected to drive the growth for the exhaust gas temperature gauge market. The need to adhere to the Euro VI norms by 2017 is one such factor augmenting the growth of this market. The automotive aftermarket is another major driver for the exhaust gas temperature gauge market. Technological advancements in the automotive industry is another factor driving this market.
The exhaust gas temperature gague market has been segmented on the basis of type of engine as:
- Diesel Engine
- Petrol Engine
- Hybrid
- Electric
- Fuel Cells
In terms of type of vehicles, the Exhaust Gas Temperature Gauge market has been segmented across the following:
- Passenger Cars
- Light Commercial Vehicles
- Heavy Commercial Vehicles
- Airplanes
- Automotive Aftermarket
- Others
The North American and European exhaust gas temperature gauge markets are relatively saturated owing to the maturity and also the recent ongoing slump in the automotive industry in these regions. Asia Pacific has growing economies like India and China and hence will be associated with a healthy growth rate till the end of the forecast period considered in this report. Increasing levels of disposable income of the population in countries like India, China, Brazil is expected to drive the growth of the overall automotive industry.
The market has been segmented based on the following geographies:
- North America
- South America
- APAC
- Europe
- Middle East
- Africa
Key Market Players:
The Top 5 companies in the Exhaust Gas Temperature Gauge Market are:
- Denso Corporation
- Continental AG
- Sensata Technologies
- Infineon Technologies
- Robert Bosch GmbH
For more Automation and Instrumentation Market reports, please click here
1. Exhaust Gas Temperature Gauge Market - Overview
1.1. Definitions and Scope
2. Exhaust Gas Temperature Gauge Market - Executive summary
2.1. Market Revenue, Market Size and Key Trends by Company
2.2. Key Trends by type of Application
2.3. Key Trends segmented by Geography
3. Exhaust Gas Temperature Gauge Market
3.1. Comparative analysis
3.1.1. Product Benchmarking - Top 10 companies
3.1.2. Top 5 Financials Analysis
3.1.3. Market Value split by Top 10 companies
3.1.4. Patent Analysis - Top 10 companies
3.1.5. Pricing Analysis
4. Exhaust Gas Temperature Gauge Market – Startup companies Scenario Premium
4.1. Top 10 startup company Analysis by
4.1.1. Investment
4.1.2. Revenue
4.1.3. Market Shares
4.1.4. Market Size and Application Analysis
4.1.5. Venture Capital and Funding Scenario
5. Exhaust Gas Temperature Gauge Market – Industry Market Entry Scenario Premium
5.1. Regulatory Framework Overview
5.2. New Business and Ease of Doing business index
5.3. Case studies of successful ventures
5.4. Customer Analysis – Top 10 companies
6. Exhaust Gas Temperature Gauge Market Forces
6.1. Drivers
6.2. Constraints
6.3. Challenges
6.4. Porters five force model
6.4.1. Bargaining power of suppliers
6.4.2. Bargaining powers of customers
6.4.3. Threat of new entrants
6.4.4. Rivalry among existing players
6.4.5. Threat of substitutes
7. Exhaust Gas Temperature Gauge Market -Strategic analysis
7.1. Value chain analysis
7.2. Opportunities analysis
7.3. Product life cycle
7.4. Suppliers and distributors Market Share
8. Exhaust Gas Temperature Gauge Market – By Type of Engine (Market Size -$Million / $Billion)
8.1. Market Size and Market Share Analysis
8.2. Application Revenue and Trend Research
8.3. Product Segment Analysis
8.3.1. Diesel Engine
8.3.2. Petrol Engine
8.3.3. Hybrid
8.3.4. Electric
8.3.5. Fuel Cell
8.3.6. Others
9. Exhaust Gas Temperature Gauge Market – By Type of Vehicles (Market Size -$Million / $Billion)
9.1. Passenger Cars
9.2. Light Commercial Vehicles
9.3. Heavy Commercial Vehicles
9.4. Aircrafts
9.5. Automotive Aftermarket
9.6. Others
10. Exhaust Gas Temperature Gauge - By Geography (Market Size -$Million / $Billion)
10.1. Exhaust Gas Temperature Gauge Market - North America Segment Research
10.2. North America Market Research (Million / $Billion)
10.2.1. Segment type Size and Market Size Analysis
10.2.2. Revenue and Trends
10.2.3. Application Revenue and Trends by type of Application
10.2.4. Company Revenue and Product Analysis
10.2.5. North America Product type and Application Market Size
10.2.5.1. U.S.
10.2.5.2. Canada
10.2.5.3. Mexico
10.2.5.4. Rest of North America
10.3. Exhaust Gas Temperature Gauge - South America Segment Research
10.4. South America Market Research (Market Size -$Million / $Billion)
10.4.1. Segment type Size and Market Size Analysis
10.4.2. Revenue and Trends
10.4.3. Application Revenue and Trends by type of Application
10.4.4. Company Revenue and Product Analysis
10.4.5. South America Product type and Application Market Size
10.4.5.1. Brazil
10.4.5.2. Venezuela
10.4.5.3. Argentina
10.4.5.4. Ecuador
10.4.5.5. Peru
10.4.5.6. Colombia
10.4.5.7. Costa Rica
10.4.5.8. Rest of South America
10.5. Exhaust Gas Temperature Gauge - Europe Segment Research
10.6. Europe Market Research (Market Size -$Million / $Billion)
10.6.1. Segment type Size and Market Size Analysis
10.6.2. Revenue and Trends
10.6.3. Application Revenue and Trends by type of Application
10.6.4. Company Revenue and Product Analysis
10.6.5. Europe Segment Product type and Application Market Size
10.6.5.1. U.K
10.6.5.2. Germany
10.6.5.3. Italy
10.6.5.4. France
10.6.5.5. Netherlands
10.6.5.6. Belgium
10.6.5.7. Spain
10.6.5.8. Denmark
10.6.5.9. Rest of Europe
10.7. Exhaust Gas Temperature Gauge – APAC Segment Research
10.8. APAC Market Research (Market Size -$Million / $Billion)
10.8.1. Segment type Size and Market Size Analysis
10.8.2. Revenue and Trends
10.8.3. Application Revenue and Trends by type of Application
10.8.4. Company Revenue and Product Analysis
10.8.5. APAC Segment – Product type and Application Market Size
10.8.5.1. China
10.8.5.2. Australia
10.8.5.3. Japan
10.8.5.4. South Korea
10.8.5.5. India
10.8.5.6. Taiwan
10.8.5.7. Malaysia
11. Exhaust Gas Temperature Gauge Market - Entropy
11.1. New product launches
11.2. M&A's, collaborations, JVs and partnerships
12. Exhaust Gas Temperature Gauge Market – Industry / Segment Competition landscape Premium
12.1. Market Share Analysis
12.1.1. Market Share by Country- Top companies
12.1.2. Market Share by Region- Top 10 companies
12.1.3. Market Share by type of Application – Top 10 companies
12.1.4. Market Share by type of Product / Product category- Top 10 companies
12.1.5. Market Share at global level- Top 10 companies
12.1.6. Best Practises for companies
13. Exhaust Gas Temperature Gauge Market – Key Company List by Country Premium
14. Exhaust Gas Temperature Gauge Market Company Analysis
14.1. Market Share, Company Revenue, Products, M&A, Developments
14.2. Robert Bosch GmbH
14.3. Hitachi Ltd.
14.4. Sensata Technologies Holding NV
14.5. Denso Corporation
14.6. Delphi Automotive Plc
14.7. Continental AG
14.8. Stoneridge Inc
14.9. Infineon Technologies AG
14.10. Hella KGAA Hueck & Co.
13.11. Company 10
13.12. Company 11
13.13. Company 12
13.14. Company 13
13.15. Company 14 and more
"*Financials would be provided on a best efforts basis for private companies"
15. Exhaust Gas Temperature Gauge Market -Appendix
15.1. Abbreviations
15.2. Sources
16. Exhaust Gas Temperature Gauge Market -Methodology Premium
16.1. Research Methodology
16.1.1. Company Expert Interviews
16.1.2. Industry Databases
16.1.3. Associations
16.1.4. Company News
16.1.5. Company Annual Reports
16.1.6. Application Trends
16.1.7. New Products and Product database
16.1.8. Company Transcripts
16.1.9. R&D Trends
16.1.10. Key Opinion Leaders Interviews
16.1.11. Supply and Demand Trends
List of Tables :
Table 1: Exhaust Gas Temperature Gauge Market Overview 2023-2030
Table 2: Exhaust Gas Temperature Gauge Market Leader Analysis 2023-2030 (US$)
Table 3: Exhaust Gas Temperature Gauge MarketProduct Analysis 2023-2030 (US$)
Table 4: Exhaust Gas Temperature Gauge MarketEnd User Analysis 2023-2030 (US$)
Table 5: Exhaust Gas Temperature Gauge MarketPatent Analysis 2013-2023* (US$)
Table 6: Exhaust Gas Temperature Gauge MarketFinancial Analysis 2023-2030 (US$)
Table 7: Exhaust Gas Temperature Gauge Market Driver Analysis 2023-2030 (US$)
Table 8: Exhaust Gas Temperature Gauge MarketChallenges Analysis 2023-2030 (US$)
Table 9: Exhaust Gas Temperature Gauge MarketConstraint Analysis 2023-2030 (US$)
Table 10: Exhaust Gas Temperature Gauge Market Supplier Bargaining Power Analysis 2023-2030 (US$)
Table 11: Exhaust Gas Temperature Gauge Market Buyer Bargaining Power Analysis 2023-2030 (US$)
Table 12: Exhaust Gas Temperature Gauge Market Threat of Substitutes Analysis 2023-2030 (US$)
Table 13: Exhaust Gas Temperature Gauge Market Threat of New Entrants Analysis 2023-2030 (US$)
Table 14: Exhaust Gas Temperature Gauge Market Degree of Competition Analysis 2023-2030 (US$)
Table 15: Exhaust Gas Temperature Gauge MarketValue Chain Analysis 2023-2030 (US$)
Table 16: Exhaust Gas Temperature Gauge MarketPricing Analysis 2023-2030 (US$)
Table 17: Exhaust Gas Temperature Gauge MarketOpportunities Analysis 2023-2030 (US$)
Table 18: Exhaust Gas Temperature Gauge MarketProduct Life Cycle Analysis 2023-2030 (US$)
Table 19: Exhaust Gas Temperature Gauge MarketSupplier Analysis 2023-2030 (US$)
Table 20: Exhaust Gas Temperature Gauge MarketDistributor Analysis 2023-2030 (US$)
Table 21: Exhaust Gas Temperature Gauge Market Trend Analysis 2023-2030 (US$)
Table 22: Exhaust Gas Temperature Gauge Market Size 2023 (US$)
Table 23: Exhaust Gas Temperature Gauge Market Forecast Analysis 2023-2030 (US$)
Table 24: Exhaust Gas Temperature Gauge Market Sales Forecast Analysis 2023-2030 (Units)
Table 25: Exhaust Gas Temperature Gauge Market, Revenue & Volume,By Type of Engine, 2023-2030 ($)
Table 26: Exhaust Gas Temperature Gauge MarketBy Type of Engine, Revenue & Volume,By Diesel Engine, 2023-2030 ($)
Table 27: Exhaust Gas Temperature Gauge MarketBy Type of Engine, Revenue & Volume,By Petrol Engine, 2023-2030 ($)
Table 28: Exhaust Gas Temperature Gauge MarketBy Type of Engine, Revenue & Volume,By Hybrid, 2023-2030 ($)
Table 29: Exhaust Gas Temperature Gauge MarketBy Type of Engine, Revenue & Volume,By Electric, 2023-2030 ($)
Table 30: Exhaust Gas Temperature Gauge MarketBy Type of Engine, Revenue & Volume,By Fuel Cell, 2023-2030 ($)
Table 31: Exhaust Gas Temperature Gauge Market, Revenue & Volume,By Type of Vehicles, 2023-2030 ($)
Table 32: Exhaust Gas Temperature Gauge MarketBy Type of Vehicles, Revenue & Volume,By Passenger Cars, 2023-2030 ($)
Table 33: Exhaust Gas Temperature Gauge MarketBy Type of Vehicles, Revenue & Volume,By Light Commercial Vehicles, 2023-2030 ($)
Table 34: Exhaust Gas Temperature Gauge MarketBy Type of Vehicles, Revenue & Volume,By Heavy Commercial Vehicles, 2023-2030 ($)
Table 35: Exhaust Gas Temperature Gauge MarketBy Type of Vehicles, Revenue & Volume,By Aircrafts, 2023-2030 ($)
Table 36: Exhaust Gas Temperature Gauge MarketBy Type of Vehicles, Revenue & Volume,By Automotive Aftermarket, 2023-2030 ($)
Table 37: North America Exhaust Gas Temperature Gauge Market, Revenue & Volume,By Type of Engine, 2023-2030 ($)
Table 38: North America Exhaust Gas Temperature Gauge Market, Revenue & Volume,By Type of Vehicles, 2023-2030 ($)
Table 39: South america Exhaust Gas Temperature Gauge Market, Revenue & Volume,By Type of Engine, 2023-2030 ($)
Table 40: South america Exhaust Gas Temperature Gauge Market, Revenue & Volume,By Type of Vehicles, 2023-2030 ($)
Table 41: Europe Exhaust Gas Temperature Gauge Market, Revenue & Volume,By Type of Engine, 2023-2030 ($)
Table 42: Europe Exhaust Gas Temperature Gauge Market, Revenue & Volume,By Type of Vehicles, 2023-2030 ($)
Table 43: APAC Exhaust Gas Temperature Gauge Market, Revenue & Volume,By Type of Engine, 2023-2030 ($)
Table 44: APAC Exhaust Gas Temperature Gauge Market, Revenue & Volume,By Type of Vehicles, 2023-2030 ($)
Table 45: Middle East & Africa Exhaust Gas Temperature Gauge Market, Revenue & Volume,By Type of Engine, 2023-2030 ($)
Table 46: Middle East & Africa Exhaust Gas Temperature Gauge Market, Revenue & Volume,By Type of Vehicles, 2023-2030 ($)
Table 47: Russia Exhaust Gas Temperature Gauge Market, Revenue & Volume,By Type of Engine, 2023-2030 ($)
Table 48: Russia Exhaust Gas Temperature Gauge Market, Revenue & Volume,By Type of Vehicles, 2023-2030 ($)
Table 49: Israel Exhaust Gas Temperature Gauge Market, Revenue & Volume,By Type of Engine, 2023-2030 ($)
Table 50: Israel Exhaust Gas Temperature Gauge Market, Revenue & Volume,By Type of Vehicles, 2023-2030 ($)
Table 51: Top Companies 2023 (US$)Exhaust Gas Temperature Gauge Market, Revenue & Volume
Table 52: Product Launch 2023-2030Exhaust Gas Temperature Gauge Market, Revenue & Volume
Table 53: Mergers & Acquistions 2023-2030Exhaust Gas Temperature Gauge Market, Revenue & Volume
List of Figures:
Figure 1: Overview of Exhaust Gas Temperature Gauge Market 2023-2030
Figure 2: Market Share Analysis for Exhaust Gas Temperature Gauge Market 2023 (US$)
Figure 3: Product Comparison in Exhaust Gas Temperature Gauge Market 2023-2030 (US$)
Figure 4: End User Profile for Exhaust Gas Temperature Gauge Market 2023-2030 (US$)
Figure 5: Patent Application and Grant in Exhaust Gas Temperature Gauge Market 2013-2023* (US$)
Figure 6: Top 5 Companies Financial Analysis in Exhaust Gas Temperature Gauge Market 2023-2030 (US$)
Figure 7: Market Entry Strategy in Exhaust Gas Temperature Gauge Market 2023-2030
Figure 8: Ecosystem Analysis in Exhaust Gas Temperature Gauge Market2023
Figure 9: Average Selling Price in Exhaust Gas Temperature Gauge Market 2023-2030
Figure 10: Top Opportunites in Exhaust Gas Temperature Gauge Market 2023-2030
Figure 11: Market Life Cycle Analysis in Exhaust Gas Temperature Gauge Market
Figure 12: GlobalBy Type of EngineExhaust Gas Temperature Gauge Market Revenue, 2023-2030 ($)
Figure 13: GlobalBy Type of VehiclesExhaust Gas Temperature Gauge Market Revenue, 2023-2030 ($)
Figure 14: Global Exhaust Gas Temperature Gauge Market - By Geography
Figure 15: Global Exhaust Gas Temperature Gauge Market Value & Volume, By Geography, 2023-2030 ($)
Figure 16: Global Exhaust Gas Temperature Gauge Market CAGR, By Geography, 2023-2030 (%)
Figure 17: North America Exhaust Gas Temperature Gauge Market Value & Volume, 2023-2030 ($)
Figure 18: US Exhaust Gas Temperature Gauge Market Value & Volume, 2023-2030 ($)
Figure 19: US GDP and Population, 2023-2030 ($)
Figure 20: US GDP – Composition of 2023, By Sector of Origin
Figure 21: US Export and Import Value & Volume, 2023-2030 ($)
Figure 22: Canada Exhaust Gas Temperature Gauge Market Value & Volume, 2023-2030 ($)
Figure 23: Canada GDP and Population, 2023-2030 ($)
Figure 24: Canada GDP – Composition of 2023, By Sector of Origin
Figure 25: Canada Export and Import Value & Volume, 2023-2030 ($)
Figure 26: Mexico Exhaust Gas Temperature Gauge Market Value & Volume, 2023-2030 ($)
Figure 27: Mexico GDP and Population, 2023-2030 ($)
Figure 28: Mexico GDP – Composition of 2023, By Sector of Origin
Figure 29: Mexico Export and Import Value & Volume, 2023-2030 ($)
Figure 30: South America Exhaust Gas Temperature Gauge MarketSouth America 3D Printing Market Value & Volume, 2023-2030 ($)
Figure 31: Brazil Exhaust Gas Temperature Gauge Market Value & Volume, 2023-2030 ($)
Figure 32: Brazil GDP and Population, 2023-2030 ($)
Figure 33: Brazil GDP – Composition of 2023, By Sector of Origin
Figure 34: Brazil Export and Import Value & Volume, 2023-2030 ($)
Figure 35: Venezuela Exhaust Gas Temperature Gauge Market Value & Volume, 2023-2030 ($)
Figure 36: Venezuela GDP and Population, 2023-2030 ($)
Figure 37: Venezuela GDP – Composition of 2023, By Sector of Origin
Figure 38: Venezuela Export and Import Value & Volume, 2023-2030 ($)
Figure 39: Argentina Exhaust Gas Temperature Gauge Market Value & Volume, 2023-2030 ($)
Figure 40: Argentina GDP and Population, 2023-2030 ($)
Figure 41: Argentina GDP – Composition of 2023, By Sector of Origin
Figure 42: Argentina Export and Import Value & Volume, 2023-2030 ($)
Figure 43: Ecuador Exhaust Gas Temperature Gauge Market Value & Volume, 2023-2030 ($)
Figure 44: Ecuador GDP and Population, 2023-2030 ($)
Figure 45: Ecuador GDP – Composition of 2023, By Sector of Origin
Figure 46: Ecuador Export and Import Value & Volume, 2023-2030 ($)
Figure 47: Peru Exhaust Gas Temperature Gauge Market Value & Volume, 2023-2030 ($)
Figure 48: Peru GDP and Population, 2023-2030 ($)
Figure 49: Peru GDP – Composition of 2023, By Sector of Origin
Figure 50: Peru Export and Import Value & Volume, 2023-2030 ($)
Figure 51: Colombia Exhaust Gas Temperature Gauge Market Value & Volume, 2023-2030 ($)
Figure 52: Colombia GDP and Population, 2023-2030 ($)
Figure 53: Colombia GDP – Composition of 2023, By Sector of Origin
Figure 54: Colombia Export and Import Value & Volume, 2023-2030 ($)
Figure 55: Costa Rica Exhaust Gas Temperature Gauge MarketCosta Rica 3D Printing Market Value & Volume, 2023-2030 ($)
Figure 56: Costa Rica GDP and Population, 2023-2030 ($)
Figure 57: Costa Rica GDP – Composition of 2023, By Sector of Origin
Figure 58: Costa Rica Export and Import Value & Volume, 2023-2030 ($)
Figure 59: Europe Exhaust Gas Temperature Gauge Market Value & Volume, 2023-2030 ($)
Figure 60: U.K Exhaust Gas Temperature Gauge Market Value & Volume, 2023-2030 ($)
Figure 61: U.K GDP and Population, 2023-2030 ($)
Figure 62: U.K GDP – Composition of 2023, By Sector of Origin
Figure 63: U.K Export and Import Value & Volume, 2023-2030 ($)
Figure 64: Germany Exhaust Gas Temperature Gauge Market Value & Volume, 2023-2030 ($)
Figure 65: Germany GDP and Population, 2023-2030 ($)
Figure 66: Germany GDP – Composition of 2023, By Sector of Origin
Figure 67: Germany Export and Import Value & Volume, 2023-2030 ($)
Figure 68: Italy Exhaust Gas Temperature Gauge Market Value & Volume, 2023-2030 ($)
Figure 69: Italy GDP and Population, 2023-2030 ($)
Figure 70: Italy GDP – Composition of 2023, By Sector of Origin
Figure 71: Italy Export and Import Value & Volume, 2023-2030 ($)
Figure 72: France Exhaust Gas Temperature Gauge Market Value & Volume, 2023-2030 ($)
Figure 73: France GDP and Population, 2023-2030 ($)
Figure 74: France GDP – Composition of 2023, By Sector of Origin
Figure 75: France Export and Import Value & Volume, 2023-2030 ($)
Figure 76: Netherlands Exhaust Gas Temperature Gauge Market Value & Volume, 2023-2030 ($)
Figure 77: Netherlands GDP and Population, 2023-2030 ($)
Figure 78: Netherlands GDP – Composition of 2023, By Sector of Origin
Figure 79: Netherlands Export and Import Value & Volume, 2023-2030 ($)
Figure 80: Belgium Exhaust Gas Temperature Gauge Market Value & Volume, 2023-2030 ($)
Figure 81: Belgium GDP and Population, 2023-2030 ($)
Figure 82: Belgium GDP – Composition of 2023, By Sector of Origin
Figure 83: Belgium Export and Import Value & Volume, 2023-2030 ($)
Figure 84: Spain Exhaust Gas Temperature Gauge Market Value & Volume, 2023-2030 ($)
Figure 85: Spain GDP and Population, 2023-2030 ($)
Figure 86: Spain GDP – Composition of 2023, By Sector of Origin
Figure 87: Spain Export and Import Value & Volume, 2023-2030 ($)
Figure 88: Denmark Exhaust Gas Temperature Gauge Market Value & Volume, 2023-2030 ($)
Figure 89: Denmark GDP and Population, 2023-2030 ($)
Figure 90: Denmark GDP – Composition of 2023, By Sector of Origin
Figure 91: Denmark Export and Import Value & Volume, 2023-2030 ($)
Figure 92: APAC Exhaust Gas Temperature Gauge Market Value & Volume, 2023-2030 ($)
Figure 93: China Exhaust Gas Temperature Gauge MarketValue & Volume, 2023-2030
Figure 94: China GDP and Population, 2023-2030 ($)
Figure 95: China GDP – Composition of 2023, By Sector of Origin
Figure 96: China Export and Import Value & Volume, 2023-2030 ($)Exhaust Gas Temperature Gauge MarketChina Export and Import Value & Volume, 2023-2030 ($)
Figure 97: Australia Exhaust Gas Temperature Gauge Market Value & Volume, 2023-2030 ($)
Figure 98: Australia GDP and Population, 2023-2030 ($)
Figure 99: Australia GDP – Composition of 2023, By Sector of Origin
Figure 100: Australia Export and Import Value & Volume, 2023-2030 ($)
Figure 101: South Korea Exhaust Gas Temperature Gauge Market Value & Volume, 2023-2030 ($)
Figure 102: South Korea GDP and Population, 2023-2030 ($)
Figure 103: South Korea GDP – Composition of 2023, By Sector of Origin
Figure 104: South Korea Export and Import Value & Volume, 2023-2030 ($)
Figure 105: India Exhaust Gas Temperature Gauge Market Value & Volume, 2023-2030 ($)
Figure 106: India GDP and Population, 2023-2030 ($)
Figure 107: India GDP – Composition of 2023, By Sector of Origin
Figure 108: India Export and Import Value & Volume, 2023-2030 ($)
Figure 109: Taiwan Exhaust Gas Temperature Gauge MarketTaiwan 3D Printing Market Value & Volume, 2023-2030 ($)
Figure 110: Taiwan GDP and Population, 2023-2030 ($)
Figure 111: Taiwan GDP – Composition of 2023, By Sector of Origin
Figure 112: Taiwan Export and Import Value & Volume, 2023-2030 ($)
Figure 113: Malaysia Exhaust Gas Temperature Gauge MarketMalaysia 3D Printing Market Value & Volume, 2023-2030 ($)
Figure 114: Malaysia GDP and Population, 2023-2030 ($)
Figure 115: Malaysia GDP – Composition of 2023, By Sector of Origin
Figure 116: Malaysia Export and Import Value & Volume, 2023-2030 ($)
Figure 117: Hong Kong Exhaust Gas Temperature Gauge MarketHong Kong 3D Printing Market Value & Volume, 2023-2030 ($)
Figure 118: Hong Kong GDP and Population, 2023-2030 ($)
Figure 119: Hong Kong GDP – Composition of 2023, By Sector of Origin
Figure 120: Hong Kong Export and Import Value & Volume, 2023-2030 ($)
Figure 121: Middle East & Africa Exhaust Gas Temperature Gauge MarketMiddle East & Africa 3D Printing Market Value & Volume, 2023-2030 ($)
Figure 122: Russia Exhaust Gas Temperature Gauge MarketRussia 3D Printing Market Value & Volume, 2023-2030 ($)
Figure 123: Russia GDP and Population, 2023-2030 ($)
Figure 124: Russia GDP – Composition of 2023, By Sector of Origin
Figure 125: Russia Export and Import Value & Volume, 2023-2030 ($)
Figure 126: Israel Exhaust Gas Temperature Gauge Market Value & Volume, 2023-2030 ($)
Figure 127: Israel GDP and Population, 2023-2030 ($)
Figure 128: Israel GDP – Composition of 2023, By Sector of Origin
Figure 129: Israel Export and Import Value & Volume, 2023-2030 ($)
Figure 130: Entropy Share, By Strategies, 2023-2030* (%)Exhaust Gas Temperature Gauge Market
Figure 131: Developments, 2023-2030*Exhaust Gas Temperature Gauge Market
Figure 132: Company 1 Exhaust Gas Temperature Gauge Market Net Revenue, By Years, 2023-2030* ($)
Figure 133: Company 1 Exhaust Gas Temperature Gauge Market Net Revenue Share, By Business segments, 2023 (%)
Figure 134: Company 1 Exhaust Gas Temperature Gauge Market Net Sales Share, By Geography, 2023 (%)
Figure 135: Company 2 Exhaust Gas Temperature Gauge Market Net Revenue, By Years, 2023-2030* ($)
Figure 136: Company 2 Exhaust Gas Temperature Gauge Market Net Revenue Share, By Business segments, 2023 (%)
Figure 137: Company 2 Exhaust Gas Temperature Gauge Market Net Sales Share, By Geography, 2023 (%)
Figure 138: Company 3Exhaust Gas Temperature Gauge Market Net Revenue, By Years, 2023-2030* ($)
Figure 139: Company 3Exhaust Gas Temperature Gauge Market Net Revenue Share, By Business segments, 2023 (%)
Figure 140: Company 3Exhaust Gas Temperature Gauge Market Net Sales Share, By Geography, 2023 (%)
Figure 141: Company 4 Exhaust Gas Temperature Gauge Market Net Revenue, By Years, 2023-2030* ($)
Figure 142: Company 4 Exhaust Gas Temperature Gauge Market Net Revenue Share, By Business segments, 2023 (%)
Figure 143: Company 4 Exhaust Gas Temperature Gauge Market Net Sales Share, By Geography, 2023 (%)
Figure 144: Company 5 Exhaust Gas Temperature Gauge Market Net Revenue, By Years, 2023-2030* ($)
Figure 145: Company 5 Exhaust Gas Temperature Gauge Market Net Revenue Share, By Business segments, 2023 (%)
Figure 146: Company 5 Exhaust Gas Temperature Gauge Market Net Sales Share, By Geography, 2023 (%)
Figure 147: Company 6 Exhaust Gas Temperature Gauge Market Net Revenue, By Years, 2023-2030* ($)
Figure 148: Company 6 Exhaust Gas Temperature Gauge Market Net Revenue Share, By Business segments, 2023 (%)
Figure 149: Company 6 Exhaust Gas Temperature Gauge Market Net Sales Share, By Geography, 2023 (%)
Figure 150: Company 7 Exhaust Gas Temperature Gauge Market Net Revenue, By Years, 2023-2030* ($)
Figure 151: Company 7 Exhaust Gas Temperature Gauge Market Net Revenue Share, By Business segments, 2023 (%)
Figure 152: Company 7 Exhaust Gas Temperature Gauge Market Net Sales Share, By Geography, 2023 (%)
Figure 153: Company 8 Exhaust Gas Temperature Gauge Market Net Revenue, By Years, 2023-2030* ($)
Figure 154: Company 8 Exhaust Gas Temperature Gauge Market Net Revenue Share, By Business segments, 2023 (%)
Figure 155: Company 8 Exhaust Gas Temperature Gauge Market Net Sales Share, By Geography, 2023 (%)
Figure 156: Company 9 Exhaust Gas Temperature Gauge Market Net Revenue, By Years, 2023-2030* ($)
Figure 157: Company 9 Exhaust Gas Temperature Gauge Market Net Revenue Share, By Business segments, 2023 (%)
Figure 158: Company 9 Exhaust Gas Temperature Gauge Market Net Sales Share, By Geography, 2023 (%)
Figure 159: Company 10 Exhaust Gas Temperature Gauge Market Net Revenue, By Years, 2023-2030* ($)
Figure 160: Company 10 Exhaust Gas Temperature Gauge Market Net Revenue Share, By Business segments, 2023 (%)
Figure 161: Company 10 Exhaust Gas Temperature Gauge Market Net Sales Share, By Geography, 2023 (%)
Figure 162: Company 11 Exhaust Gas Temperature Gauge Market Net Revenue, By Years, 2023-2030* ($)
Figure 163: Company 11 Exhaust Gas Temperature Gauge Market Net Revenue Share, By Business segments, 2023 (%)
Figure 164: Company 11 Exhaust Gas Temperature Gauge Market Net Sales Share, By Geography, 2023 (%)
Figure 165: Company 12 Exhaust Gas Temperature Gauge Market Net Revenue, By Years, 2023-2030* ($)
Figure 166: Company 12 Exhaust Gas Temperature Gauge Market Net Revenue Share, By Business segments, 2023 (%)
Figure 167: Company 12 Exhaust Gas Temperature Gauge Market Net Sales Share, By Geography, 2023 (%)
Figure 168: Company 13Exhaust Gas Temperature Gauge Market Net Revenue, By Years, 2023-2030* ($)
Figure 169: Company 13Exhaust Gas Temperature Gauge Market Net Revenue Share, By Business segments, 2023 (%)
Figure 170: Company 13Exhaust Gas Temperature Gauge Market Net Sales Share, By Geography, 2023 (%)
Figure 171: Company 14 Exhaust Gas Temperature Gauge Market Net Revenue, By Years, 2023-2030* ($)
Figure 172: Company 14 Exhaust Gas Temperature Gauge Market Net Revenue Share, By Business segments, 2023 (%)
Figure 173: Company 14 Exhaust Gas Temperature Gauge Market Net Sales Share, By Geography, 2023 (%)
Figure 174: Company 15 Exhaust Gas Temperature Gauge Market Net Revenue, By Years, 2023-2030* ($)
Figure 175: Company 15 Exhaust Gas Temperature Gauge Market Net Revenue Share, By Business segments, 2023 (%)
Figure 176: Company 15 Exhaust Gas Temperature Gauge Market Net Sales Share, By Geography, 2023 (%)