 Email
Email Print
Print


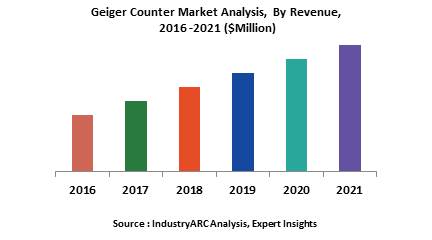
Geiger Counter Market Size is forecast to reach $105476.3 Million by 2030, at a CAGR of 6% during forecast period 2024-2030.A geiger counter is a device capable of detecting and measuring ionization radiation and is one of the most common radiation detection instruments. This instrument comprises a geiger-mueller tube whose function is to detect the radiation and the electronics that display the results. A geiger counter has two electrodes surrounded by gas, either helium or argon. When radiation enters the tube, the gas gets ionized and via a scaler, a pulse is produced everytime radiation ionizes the gas. Some of the advantages of geiger meters include portability, durability, low cost and the ability to detect all types of radiation. These advantages have a positive impact on the growth rate of the geiger counter market.
However, owing to their lower efficiency level coupled with the fact that the instruments cannot differentiate between the type of radiation being detected, the market growth is hampered. Also, the output pulse of the geiger counter remains the same irrespective of the energy of the incident radiation. Lack of set standarization and calibration is another factor currenlty inhibiting the growth of this market.
Geiger counters were initally mainly used for particle detection such as alpha and beta particles and now cover gamma and x-ray detection as well as neutron detection.
The geiger counter market has been classified on the basis of type as:
- Particle detection
- gamma and X-ray detection
- neutron detection
- others
The end window type of the Geiger-Mueller tube is used in the case of particle detection, however, this type will not be able to distinguish between alpha and beta particles. The windowless tube is use in the case of gamma detection while in the case of neutron detection, there is a slight modifaction. The gas used is typically helium 3 or borontrifluoride and the neutrons are slowed down using a plastic moderator.
In terms of applications, the Geiger Counter market has been segmented across the following:
- Healthcare
- homeland security
- mining
- military
- research
- nuclear
- others
North America, followed by Europe, currently dominate the overall geiger counter market and Asia Pacific is expected to witness the highest growth rate throughout the forecast period considered in this report.
The market has been segmented based on the following geographies:
- North America
- South America
- APAC
- Europe
- Middle East
- Africa
Sample Companies profiled in this Report are:
- Gamma-Scout
- Quarta-Rad
- S.E. International
- SOEKS USA LLC
- Ecotest
- 10+.
Key Market Players:
The Top 5 companies in the Geiger Counter Market are:
- Mirion Technologies, Inc.
- Thermo Fisher Scientific, Inc.
- RadiaBeam Technologies, LLC
- AMETEK Inc.
- Berthold Technologies GmbH & Co. KG
For more Automation and Instrumentation Market reports, please click here
1. Geiger Counter Market Overview
2. Executive Summary
3. Geiger Counter Market Landscape
3.1. Market Share Analysis
3.2. Comparative Analysis
3.2.1. Product Benchmarking
3.2.2. End User Profiling
3.2.3. Top 5 Financials Analysis
4. Geiger Counter Market Forces
4.1. Market Drivers
4.2. Market Constraints
4.3. Market Challenges
4.4. Attractiveness of the Geiger Counter Market
4.4.1. Power of Suppliers
4.4.2. Power of Customers
4.4.3. Threat of New Entrants
4.4.4. Threat of Substitution
4.4.5. Degree of Competition
5. Geiger Counter Market Strategic Analysis
5.1. Value Chain Analysis
5.2. Pricing Analysis
5.3. Opportunities Analysis
5.4. Product/Market Life Cycle Analysis
5.5. Suppliers and Distributors
6. Geiger Counter Market-By Type
6.1. Particle Detection
6.2. Gamma and X-ray Detection
6.3. Neutron Detection
6.4. Others
7. Geiger Counter Market- By Application
7.1. Healthcare
7.2. Research
7.3. Nuclear
7.4. Homeland Security
7.5. Military
7.6. Mining
7.7. Others
8. Geiger Counter Market- By Geography
8.1. Introduction
8.2. Global Study
8.3. Americas
8.3.1. North America
8.3.2. Brazil
8.3.3. Argentina
8.3.4. Others
8.4. Europe
8.4.1. U.K.
8.4.2. France
8.4.3. Germany
8.4.4. Others
8.5. APAC
8.5.1. China
8.5.2. Japan
8.5.3. India
8.5.4. Others
8.6. ROW
9. Geiger Counter Market Entropy
9.1. New Product Launches
9.2. M&As, Collaborations, JVs and Partnerships
10. Company Profiles
10.1. Quarta Rad Inc.
10.2. S.E. International
10.3. Gamma-Scout
10.4. Ecotest Group
10.5. SOEKS USA LLC
*More than 10 Companies are profiled in this Research Report*
"*Financials would be provided on a best efforts basis for private companies"
11. Appendix
11.1. Abbreviations
11.2. Sources
11.3. Research Methodology
11.4. Bibliography
11.5. Compilation of Expert Insights
11.6. Disclaimer
List of Tables
Table 1: Geiger Counter Market Overview 2023-2030
Table 2: Geiger Counter Market Leader Analysis 2023-2030 (US$)
Table 3: Geiger Counter Market Product Analysis 2023-2030 (US$)
Table 4: Geiger Counter Market End User Analysis 2023-2030 (US$)
Table 5: Geiger Counter Market Patent Analysis 2013-2023* (US$)
Table 6: Geiger Counter Market Financial Analysis 2023-2030 (US$)
Table 7: Geiger Counter Market Driver Analysis 2023-2030 (US$)
Table 8: Geiger Counter Market Challenges Analysis 2023-2030 (US$)
Table 9: Geiger Counter Market Constraint Analysis 2023-2030 (US$)
Table 10: Geiger Counter Market Supplier Bargaining Power Analysis 2023-2030 (US$)
Table 11: Geiger Counter Market Buyer Bargaining Power Analysis 2023-2030 (US$)
Table 12: Geiger Counter Market Threat of Substitutes Analysis 2023-2030 (US$)
Table 13: Geiger Counter Market Threat of New Entrants Analysis 2023-2030 (US$)
Table 14: Geiger Counter Market Degree of Competition Analysis 2023-2030 (US$)
Table 15: Geiger Counter Market Value Chain Analysis 2023-2030 (US$)
Table 16: Geiger Counter Market Pricing Analysis 2023-2030 (US$)
Table 17: Geiger Counter Market Opportunities Analysis 2023-2030 (US$)
Table 18: Geiger Counter Market Product Life Cycle Analysis 2023-2030 (US$)
Table 19: Geiger Counter Market Supplier Analysis 2023-2030 (US$)
Table 20: Geiger Counter Market Distributor Analysis 2023-2030 (US$)
Table 21: Geiger Counter Market Trend Analysis 2023-2030 (US$)
Table 22: Geiger Counter Market Size 2023 (US$)
Table 23: Geiger Counter Market Forecast Analysis 2023-2030 (US$)
Table 24: Geiger Counter Market Sales Forecast Analysis 2023-2030 (Units)
Table 25: Geiger Counter Market, Revenue & Volume,By Type, 2023-2030 ($)
Table 26: Geiger Counter Market By Type, Revenue & Volume,By Particle Detection, 2023-2030 ($)
Table 27: Geiger Counter Market By Type, Revenue & Volume,By Gamma and X-ray Detection, 2023-2030 ($)
Table 28: Geiger Counter Market By Type, Revenue & Volume,By Neutron Detection, 2023-2030 ($)
Table 29: Geiger Counter Market By Type, Revenue & Volume,By Others, 2023-2030 ($)
Table 30: Geiger Counter Market, Revenue & Volume,By Application, 2023-2030 ($)
Table 31: Geiger Counter Market By Application, Revenue & Volume,By Healthcare, 2023-2030 ($)
Table 32: Geiger Counter Market By Application, Revenue & Volume,By Research, 2023-2030 ($)
Table 33: Geiger Counter Market By Application, Revenue & Volume,By Nuclear, 2023-2030 ($)
Table 34: Geiger Counter Market By Application, Revenue & Volume,By Homeland Security, 2023-2030 ($)
Table 35: Geiger Counter Market By Application, Revenue & Volume,By Military, 2023-2030 ($)
Table 36: North America Geiger Counter Market, Revenue & Volume,By Type, 2023-2030 ($)
Table 37: North America Geiger Counter Market, Revenue & Volume,By Application, 2023-2030 ($)
Table 38: South america Geiger Counter Market, Revenue & Volume,By Type, 2023-2030 ($)
Table 39: South america Geiger Counter Market, Revenue & Volume,By Application, 2023-2030 ($)
Table 40: Europe Geiger Counter Market, Revenue & Volume,By Type, 2023-2030 ($)
Table 41: Europe Geiger Counter Market, Revenue & Volume,By Application, 2023-2030 ($)
Table 42: APAC Geiger Counter Market, Revenue & Volume,By Type, 2023-2030 ($)
Table 43: APAC Geiger Counter Market, Revenue & Volume,By Application, 2023-2030 ($)
Table 44: Middle East & Africa Geiger Counter Market, Revenue & Volume,By Type, 2023-2030 ($)
Table 45: Middle East & Africa Geiger Counter Market, Revenue & Volume,By Application, 2023-2030 ($)
Table 46: Russia Geiger Counter Market, Revenue & Volume,By Type, 2023-2030 ($)
Table 47: Russia Geiger Counter Market, Revenue & Volume,By Application, 2023-2030 ($)
Table 48: Israel Geiger Counter Market, Revenue & Volume,By Type, 2023-2030 ($)
Table 49: Israel Geiger Counter Market, Revenue & Volume,By Application, 2023-2030 ($)
Table 50: Top Companies 2023 (US$)Geiger Counter Market, Revenue & Volume
Table 51: Product Launch 2023-2030Geiger Counter Market, Revenue & Volume
Table 52: Mergers & Acquistions 2023-2030Geiger Counter Market, Revenue & Volume
List of Figures
Figure 1: Overview of Geiger Counter Market 2023-2030
Figure 2: Market Share Analysis for Geiger Counter Market 2023 (US$)
Figure 3: Product Comparison in Geiger Counter Market 2023-2030 (US$)
Figure 4: End User Profile for Geiger Counter Market 2023-2030 (US$)
Figure 5: Patent Application and Grant in Geiger Counter Market 2013-2023* (US$)
Figure 6: Top 5 Companies Financial Analysis in Geiger Counter Market 2023-2030 (US$)
Figure 7: Market Entry Strategy in Geiger Counter Market 2023-2030
Figure 8: Ecosystem Analysis in Geiger Counter Market 2023
Figure 9: Average Selling Price in Geiger Counter Market 2023-2030
Figure 10: Top Opportunites in Geiger Counter Market 2023-2030
Figure 11: Market Life Cycle Analysis in Geiger Counter Market
Figure 12: GlobalBy TypeGeiger Counter Market Revenue, 2023-2030 ($)
Figure 13: GlobalBy ApplicationGeiger Counter Market Revenue, 2023-2030 ($)
Figure 14: Global Geiger Counter Market - By Geography
Figure 15: Global Geiger Counter Market Value & Volume, By Geography, 2023-2030 ($)
Figure 16: Global Geiger Counter Market CAGR, By Geography, 2023-2030 (%)
Figure 17: North America Geiger Counter Market Value & Volume, 2023-2030 ($)
Figure 18: US Geiger Counter Market Value & Volume, 2023-2030 ($)
Figure 19: US GDP and Population, 2023-2030 ($)
Figure 20: US GDP – Composition of 2023, By Sector of Origin
Figure 21: US Export and Import Value & Volume, 2023-2030 ($)
Figure 22: Canada Geiger Counter Market Value & Volume, 2023-2030 ($)
Figure 23: Canada GDP and Population, 2023-2030 ($)
Figure 24: Canada GDP – Composition of 2023, By Sector of Origin
Figure 25: Canada Export and Import Value & Volume, 2023-2030 ($)
Figure 26: Mexico Geiger Counter Market Value & Volume, 2023-2030 ($)
Figure 27: Mexico GDP and Population, 2023-2030 ($)
Figure 28: Mexico GDP – Composition of 2023, By Sector of Origin
Figure 29: Mexico Export and Import Value & Volume, 2023-2030 ($)
Figure 30: South America Geiger Counter Market Value & Volume, 2023-2030 ($)
Figure 31: Brazil Geiger Counter Market Value & Volume, 2023-2030 ($)
Figure 32: Brazil GDP and Population, 2023-2030 ($)
Figure 33: Brazil GDP – Composition of 2023, By Sector of Origin
Figure 34: Brazil Export and Import Value & Volume, 2023-2030 ($)
Figure 35: Venezuela Geiger Counter Market Value & Volume, 2023-2030 ($)
Figure 36: Venezuela GDP and Population, 2023-2030 ($)
Figure 37: Venezuela GDP – Composition of 2023, By Sector of Origin
Figure 38: Venezuela Export and Import Value & Volume, 2023-2030 ($)
Figure 39: Argentina Geiger Counter Market Value & Volume, 2023-2030 ($)
Figure 40: Argentina GDP and Population, 2023-2030 ($)
Figure 41: Argentina GDP – Composition of 2023, By Sector of Origin
Figure 42: Argentina Export and Import Value & Volume, 2023-2030 ($)
Figure 43: Ecuador Geiger Counter Market Value & Volume, 2023-2030 ($)
Figure 44: Ecuador GDP and Population, 2023-2030 ($)
Figure 45: Ecuador GDP – Composition of 2023, By Sector of Origin
Figure 46: Ecuador Export and Import Value & Volume, 2023-2030 ($)
Figure 47: Peru Geiger Counter Market Value & Volume, 2023-2030 ($)
Figure 48: Peru GDP and Population, 2023-2030 ($)
Figure 49: Peru GDP – Composition of 2023, By Sector of Origin
Figure 50: Peru Export and Import Value & Volume, 2023-2030 ($)
Figure 51: Colombia Geiger Counter Market Value & Volume, 2023-2030 ($)
Figure 52: Colombia GDP and Population, 2023-2030 ($)
Figure 53: Colombia GDP – Composition of 2023, By Sector of Origin
Figure 54: Colombia Export and Import Value & Volume, 2023-2030 ($)
Figure 55: Costa Rica Geiger Counter Market Value & Volume, 2023-2030 ($)
Figure 56: Costa Rica GDP and Population, 2023-2030 ($)
Figure 57: Costa Rica GDP – Composition of 2023, By Sector of Origin
Figure 58: Costa Rica Export and Import Value & Volume, 2023-2030 ($)
Figure 59: Europe Geiger Counter Market Value & Volume, 2023-2030 ($)
Figure 60: U.K Geiger Counter Market Value & Volume, 2023-2030 ($)
Figure 61: U.K GDP and Population, 2023-2030 ($)
Figure 62: U.K GDP – Composition of 2023, By Sector of Origin
Figure 63: U.K Export and Import Value & Volume, 2023-2030 ($)
Figure 64: Germany Geiger Counter Market Value & Volume, 2023-2030 ($)
Figure 65: Germany GDP and Population, 2023-2030 ($)
Figure 66: Germany GDP – Composition of 2023, By Sector of Origin
Figure 67: Germany Export and Import Value & Volume, 2023-2030 ($)
Figure 68: Italy Geiger Counter Market Value & Volume, 2023-2030 ($)
Figure 69: Italy GDP and Population, 2023-2030 ($)
Figure 70: Italy GDP – Composition of 2023, By Sector of Origin
Figure 71: Italy Export and Import Value & Volume, 2023-2030 ($)
Figure 72: France Geiger Counter Market Value & Volume, 2023-2030 ($)
Figure 73: France GDP and Population, 2023-2030 ($)
Figure 74: France GDP – Composition of 2023, By Sector of Origin
Figure 75: France Export and Import Value & Volume, 2023-2030 ($)
Figure 76: Netherlands Geiger Counter Market Value & Volume, 2023-2030 ($)
Figure 77: Netherlands GDP and Population, 2023-2030 ($)
Figure 78: Netherlands GDP – Composition of 2023, By Sector of Origin
Figure 79: Netherlands Export and Import Value & Volume, 2023-2030 ($)
Figure 80: Belgium Geiger Counter Market Value & Volume, 2023-2030 ($)
Figure 81: Belgium GDP and Population, 2023-2030 ($)
Figure 82: Belgium GDP – Composition of 2023, By Sector of Origin
Figure 83: Belgium Export and Import Value & Volume, 2023-2030 ($)
Figure 84: Spain Geiger Counter Market Value & Volume, 2023-2030 ($)
Figure 85: Spain GDP and Population, 2023-2030 ($)
Figure 86: Spain GDP – Composition of 2023, By Sector of Origin
Figure 87: Spain Export and Import Value & Volume, 2023-2030 ($)
Figure 88: Denmark Geiger Counter Market Value & Volume, 2023-2030 ($)
Figure 89: Denmark GDP and Population, 2023-2030 ($)
Figure 90: Denmark GDP – Composition of 2023, By Sector of Origin
Figure 91: Denmark Export and Import Value & Volume, 2023-2030 ($)
Figure 92: APAC Geiger Counter Market Value & Volume, 2023-2030 ($)
Figure 93: China Geiger Counter Market Value & Volume, 2023-2030
Figure 94: China GDP and Population, 2023-2030 ($)
Figure 95: China GDP – Composition of 2023, By Sector of Origin
Figure 96: China Export and Import Value & Volume, 2023-2030 ($)Geiger Counter Market China Export and Import Value & Volume, 2023-2030 ($)
Figure 97: Australia Geiger Counter Market Value & Volume, 2023-2030 ($)
Figure 98: Australia GDP and Population, 2023-2030 ($)
Figure 99: Australia GDP – Composition of 2023, By Sector of Origin
Figure 100: Australia Export and Import Value & Volume, 2023-2030 ($)
Figure 101: South Korea Geiger Counter Market Value & Volume, 2023-2030 ($)
Figure 102: South Korea GDP and Population, 2023-2030 ($)
Figure 103: South Korea GDP – Composition of 2023, By Sector of Origin
Figure 104: South Korea Export and Import Value & Volume, 2023-2030 ($)
Figure 105: India Geiger Counter Market Value & Volume, 2023-2030 ($)
Figure 106: India GDP and Population, 2023-2030 ($)
Figure 107: India GDP – Composition of 2023, By Sector of Origin
Figure 108: India Export and Import Value & Volume, 2023-2030 ($)
Figure 109: Taiwan Geiger Counter Market Value & Volume, 2023-2030 ($)
Figure 110: Taiwan GDP and Population, 2023-2030 ($)
Figure 111: Taiwan GDP – Composition of 2023, By Sector of Origin
Figure 112: Taiwan Export and Import Value & Volume, 2023-2030 ($)
Figure 113: Malaysia Geiger Counter Market Value & Volume, 2023-2030 ($)
Figure 114: Malaysia GDP and Population, 2023-2030 ($)
Figure 115: Malaysia GDP – Composition of 2023, By Sector of Origin
Figure 116: Malaysia Export and Import Value & Volume, 2023-2030 ($)
Figure 117: Hong Kong Geiger Counter Market Value & Volume, 2023-2030 ($)
Figure 118: Hong Kong GDP and Population, 2023-2030 ($)
Figure 119: Hong Kong GDP – Composition of 2023, By Sector of Origin
Figure 120: Hong Kong Export and Import Value & Volume, 2023-2030 ($)
Figure 121: Middle East & Africa Geiger Counter Market Middle East & Africa 3D Printing Market Value & Volume, 2023-2030 ($)
Figure 122: Russia Geiger Counter Market Value & Volume, 2023-2030 ($)
Figure 123: Russia GDP and Population, 2023-2030 ($)
Figure 124: Russia GDP – Composition of 2023, By Sector of Origin
Figure 125: Russia Export and Import Value & Volume, 2023-2030 ($)
Figure 126: Israel Geiger Counter Market Value & Volume, 2023-2030 ($)
Figure 127: Israel GDP and Population, 2023-2030 ($)
Figure 128: Israel GDP – Composition of 2023, By Sector of Origin
Figure 129: Israel Export and Import Value & Volume, 2023-2030 ($)
Figure 130: Entropy Share, By Strategies, 2023-2030* (%)Geiger Counter Market
Figure 131: Developments, 2023-2030*Geiger Counter Market
Figure 132: Company 1 Geiger Counter Market Net Revenue, By Years, 2023-2030* ($)
Figure 133: Company 1 Geiger Counter Market Net Revenue Share, By Business segments, 2023 (%)
Figure 134: Company 1 Geiger Counter Market Net Sales Share, By Geography, 2023 (%)
Figure 135: Company 2 Geiger Counter Market Net Revenue, By Years, 2023-2030* ($)
Figure 136: Company 2 Geiger Counter Market Net Revenue Share, By Business segments, 2023 (%)
Figure 137: Company 2 Geiger Counter Market Net Sales Share, By Geography, 2023 (%)
Figure 138: Company 3Geiger Counter Market Net Revenue, By Years, 2023-2030* ($)
Figure 139: Company 3Geiger Counter Market Net Revenue Share, By Business segments, 2023 (%)
Figure 140: Company 3Geiger Counter Market Net Sales Share, By Geography, 2023 (%)
Figure 141: Company 4 Geiger Counter Market Net Revenue, By Years, 2023-2030* ($)
Figure 142: Company 4 Geiger Counter Market Net Revenue Share, By Business segments, 2023 (%)
Figure 143: Company 4 Geiger Counter Market Net Sales Share, By Geography, 2023 (%)
Figure 144: Company 5 Geiger Counter Market Net Revenue, By Years, 2023-2030* ($)
Figure 145: Company 5 Geiger Counter Market Net Revenue Share, By Business segments, 2023 (%)
Figure 146: Company 5 Geiger Counter Market Net Sales Share, By Geography, 2023 (%)
Figure 147: Company 6 Geiger Counter Market Net Revenue, By Years, 2023-2030* ($)
Figure 148: Company 6 Geiger Counter Market Net Revenue Share, By Business segments, 2023 (%)
Figure 149: Company 6 Geiger Counter Market Net Sales Share, By Geography, 2023 (%)
Figure 150: Company 7 Geiger Counter Market Net Revenue, By Years, 2023-2030* ($)
Figure 151: Company 7 Geiger Counter Market Net Revenue Share, By Business segments, 2023 (%)
Figure 152: Company 7 Geiger Counter Market Net Sales Share, By Geography, 2023 (%)
Figure 153: Company 8 Geiger Counter Market Net Revenue, By Years, 2023-2030* ($)
Figure 154: Company 8 Geiger Counter Market Net Revenue Share, By Business segments, 2023 (%)
Figure 155: Company 8 Geiger Counter Market Net Sales Share, By Geography, 2023 (%)
Figure 156: Company 9 Geiger Counter Market Net Revenue, By Years, 2023-2030* ($)
Figure 157: Company 9 Geiger Counter Market Net Revenue Share, By Business segments, 2023 (%)
Figure 158: Company 9 Geiger Counter Market Net Sales Share, By Geography, 2023 (%)
Figure 159: Company 10 Geiger Counter Market Net Revenue, By Years, 2023-2030* ($)
Figure 160: Company 10 Geiger Counter Market Net Revenue Share, By Business segments, 2023 (%)
Figure 161: Company 10 Geiger Counter Market Net Sales Share, By Geography, 2023 (%)
Figure 162: Company 11 Geiger Counter Market Net Revenue, By Years, 2023-2030* ($)
Figure 163: Company 11 Geiger Counter Market Net Revenue Share, By Business segments, 2023 (%)
Figure 164: Company 11 Geiger Counter Market Net Sales Share, By Geography, 2023 (%)
Figure 165: Company 12 Geiger Counter Market Net Revenue, By Years, 2023-2030* ($)
Figure 166: Company 12 Geiger Counter Market Net Revenue Share, By Business segments, 2023 (%)
Figure 167: Company 12 Geiger Counter Market Net Sales Share, By Geography, 2023 (%)
Figure 168: Company 13Geiger Counter Market Net Revenue, By Years, 2023-2030* ($)
Figure 169: Company 13Geiger Counter Market Net Revenue Share, By Business segments, 2023 (%)
Figure 170: Company 13Geiger Counter Market Net Sales Share, By Geography, 2023 (%)
Figure 171: Company 14 Geiger Counter Market Net Revenue, By Years, 2023-2030* ($)
Figure 172: Company 14 Geiger Counter Market Net Revenue Share, By Business segments, 2023 (%)
Figure 173: Company 14 Geiger Counter Market Net Sales Share, By Geography, 2023 (%)
Figure 174: Company 15 Geiger Counter Market Net Revenue, By Years, 2023-2030* ($)
Figure 175: Company 15 Geiger Counter Market Net Revenue Share, By Business segments, 2023 (%)
Figure 176: Company 15 Geiger Counter Market Net Sales Share, By Geography, 2023 (%)