 Email
Email Print
Print


Crankshaft Position Sensor Market - Forecast(2025 - 2031)
Crankshaft Position Sensor Market Overview
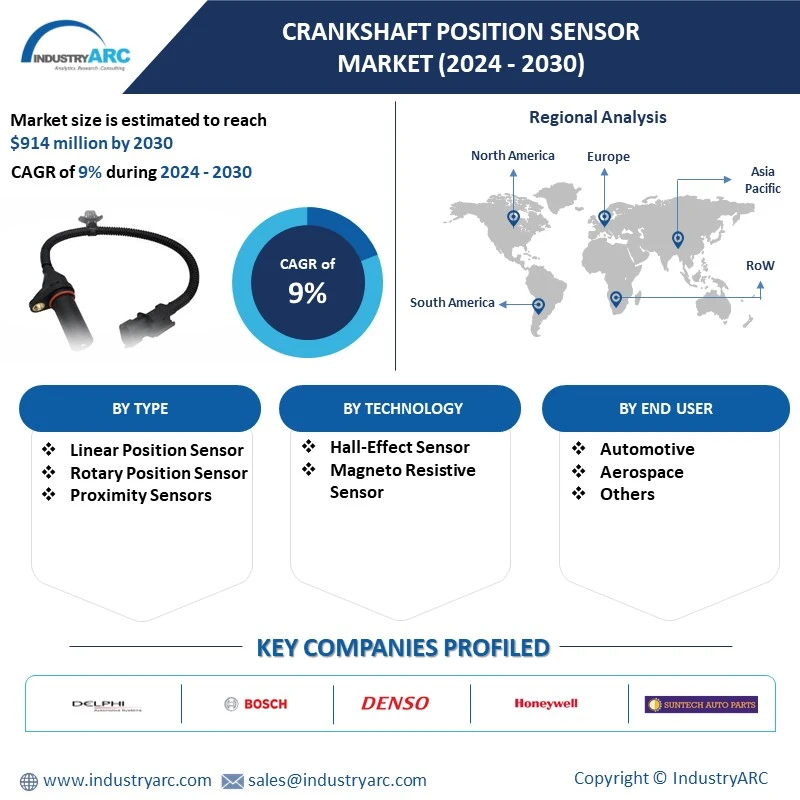
Crankshaft Position Sensor Market is estimated at US$ 914.0 million in 2030 growing at a CAGR of 9% during the forecast period 2024 to 2030. Crankshaft position sensor is used to provide information on the position or rotational speed of the crankshaft in an internal combustion engine to engine management systems. Globally, the rise in the adoption of crankshaft position sensors in vehicles, increasing production volumes of automobiles globally, and stringent vehicle emission regulations around the globe are the prime growth drivers of global crankshaft position sensor market. In addition, increasing usage of crankshaft position sensors in the aerospace industry, and the growing automotive industry in emerging economies such as China, India and others, will create new opportunities for the global crankshaft position sensor market. However, the higher cost of research and development, and lack of standardization for performance measurement are the key restraints for the global crankshaft position sensor market. It also highlights the potential growth opportunities in the coming years, while also reviewing the market drivers, restraints, growth indicators, challenges, market dynamics, competitive landscape, and other key aspects with respect to the global crankshaft position sensor market.
Geographically Asia Pacific dominated the global crankshaft position sensor market in 2023 and is projected to have the fastest growth, owing to the rapidly increasing automotive industry in China and India, and the modernization of vehicles in this region. Among all the types, rotary position sensor has the highest market share in the global crankshaft position sensor market. Automotive application leads the global crankshaft position sensor market among all the end-user industries.
The Crankshaft Position Sensor market is experiencing a surge in demand driven by the automotive industry's increasing focus on Advanced Engine Management Systems. As vehicles strive for improved fuel efficiency, performance, and emissions control, the precision provided by crankshaft position sensors becomes crucial. This trend aligns with the broader industry shift towards integrated sensor technologies, heightened emphasis on electric vehicles, and the ongoing pursuit of reliable and durable automotive components to meet stringent emission standards. The Crankshaft Position Sensor market is witnessing notable growth, propelled by the rising adoption of electric vehicles (EVs). As the automotive industry undergoes a transformative shift towards electric and hybrid technologies, the demand for precise sensor data, including crankshaft position information, is on the rise. These sensors play a pivotal role in ensuring the efficient operation of electric powertrains. The surge in EV production contributes to the evolution of the sensor market, reflecting the broader trend of electrification in the automotive sector.
Market Snapshot:
This report segments the global crankshaft position sensor market on the basis of type, technology, contact type, output, end-user, and regional market as follows:
• Crankshaft Position Sensor Market, By Type: Linear Position Sensor, Rotary Position Sensor, and Proximity Sensors
• Crankshaft Position Sensor Market, By Technology: Hall-Effect Sensor, and Magneto resistive Sensor
• Crankshaft Position Sensor Market, By Contact Type: Contact, and Non-Contact
• Crankshaft Position Sensor Market, By Output: Analog, and Digital
• The report has focused study on the crankshaft position sensor market on the basis of end-users such as Automotive, Aerospace, and Others
• This report has been further segmented into major regions, which includes a detailed analysis of each region such as North America, Europe, Asia-Pacific (APAC), and the Rest of the World (Row) covering all the major country-level markets in each of the regions.
Crankshaft Position Sensor Market by Geography
The Crankshaft Position Sensor market is prominently led by the Asia Pacific region, emerging as the dominant force in the global landscape. The region's supremacy can be attributed to its robust automotive manufacturing sector, characterized by high production volumes and increasing technological advancements. Nations like China, Japan, and India play pivotal roles in this dominance, witnessing substantial demand for crankshaft position sensors due to escalating automobile production. The growing emphasis on electric vehicles further propels the market, with Asia Pacific positioned at the forefront of this transformative shift. The region's strategic importance underscores its key role in shaping the future trajectory of the global Crankshaft Position Sensor market.

For More Details on This Report - Request for Sample
Crankshaft Position Sensor Market Drivers
Rise in the Adoption of Crankshaft Position Sensors in Vehicles
The Crankshaft Position Sensor market is experiencing a notable upswing, primarily driven by the increased adoption of these sensors in vehicles. As automotive technology advances, there is a growing recognition of the critical role played by crankshaft position sensors in optimizing engine performance, fuel efficiency, and emissions control. The expanding use of these sensors underscores their importance in modern vehicle design, reflecting a broader industry trend towards enhanced engine management systems for improved overall vehicle functionality.
Increasing Production Volumes of Automobiles Globally
The Crankshaft Position Sensor market is witnessing significant growth, propelled by the surge in global automobile production volumes. As automotive manufacturers scale up their operations to meet growing demand, the need for precision in engine management becomes paramount. Crankshaft position sensors play a crucial role in this scenario by providing real-time data to optimize engine performance. The increasing integration of these sensors into vehicles reflects their essential contribution to meeting the rising production demands and maintaining high standards of automotive efficiency and reliability.
Crankshaft Position Sensor Market Challenges
The Research and Development Having Higher Cost
The Crankshaft Position Sensor market is influenced by the challenge of higher research and development costs. As manufacturers strive for innovation to meet evolving automotive demands, the investment in R&D for advanced sensor technologies, including crankshaft position sensors, has increased. The cost factor, while driving technological advancements, may impact market dynamics. However, it also underscores the industry's commitment to developing cutting-edge solutions for improved engine management, efficiency, and performance, highlighting the importance of R&D in shaping the future of the Crankshaft Position Sensor market.
Lack of standardization for performance measurement
The Crankshaft Position Sensor market faces a challenge due to the lack of standardization for performance measurement. Variability in performance metrics across different manufacturers can complicate comparisons and decision-making for consumers and industry players. Standardization efforts would not only enhance transparency but also foster confidence in the reliability and accuracy of crankshaft position sensors. Addressing this issue is pivotal for establishing a cohesive and consistent market, ensuring that consumers and stakeholders can make informed choices based on universally recognized performance benchmarks.
Sample Companies profiled in this Report are:
- Delphi Automotive PLC
- Robert Bosch GmbH
- Denso Corporation
- Honeywell International Inc.
- Suntech Auto Spares
- Hitachi Astemo, Ltd.
- Wenzhou Fonan Automotive Electronics Co., Ltd.
- Guangzhou Yaopei Auto Parts Co., Ltd.
- BWD
- Taiwan Ignition System Co., Ltd.
- 10+.
For more Automation and Instrumentation Market reports, please click here
1. Crankshaft Position Sensor Market- Overview
1.1. Definitions and Scope
2. Crankshaft Position Sensor Market- Executive Summary
3. Crankshaft Position Sensor Market–Comparative Analysis
3.1. Company Benchmarking – Key Companies
3.2. Financials Analysis–Key Companies
3.3. Market Share Analysis- Key Companies
3.4. Patent Analysis - Global
3.5. Pricing Analysis–Average Pricing
4. Crankshaft Position Sensor Market– Startup Companies Scenario Premium
4.1. Investments
4.2. Revenue
4.3. Venture Capital and Funding Scenario
5. Crankshaft Position Sensor Market– Industry Market Entry Scenario Premium Premium
5.1. Regulatory Framework Overview
5.2. New Business and Ease of Doing Business Index
5.3. Case studies of successful ventures
6. Crankshaft Position Sensor Market - Forces
6.1. Market Drivers
6.2. Market Constraints & Challenges
6.3. Porters Five Force Model
6.3.1. Bargaining power of suppliers
6.3.2. Bargaining powers of customers
6.3.3. Threat of new entrants
6.3.4. Rivalry among existing players
6.3.5. Threat of substitutes
7. Crankshaft Position Sensor Market- Strategic Analysis
7.1. Value Chain Analysis
7.2. Opportunities Analysis
7.3. Market Life Cycle Analysis
8. Crankshaft Position Sensor Market, By Type
8.1. Linear Position Sensor
8.2. Rotary Position Sensor
8.3. Proximity Sensors
9. Crankshaft Position Sensor Market, By Technology
9.1. Hall-Effect Sensor
9.2. Magneto Resistive Sensor
10. Crankshaft Position Sensor Market, By Contact Type
10.1. Contact
10.2. Non-Contact
11. Crankshaft Position Sensor Market, By Output
11.1. Analog
11.2. Digital
12. Crankshaft Position Sensor Market, By End-User
12.1. Automotive
12.2. Aerospace
12.3. Others
13. Crankshaft Position Sensor Market, By Geography
13.1. North America
13.1.1. U.S.
13.1.2. Canada
13.1.3. Mexico
13.2. Europe
13.2.1. U.K.
13.2.2. Germany
13.2.3. France
13.2.4. Italy
13.2.5. Spain
13.2.6. Russia
13.2.7. Rest of Europe
13.3. Asia-Pacific
13.3.1. China
13.3.2. Japan
13.3.3. South Korea
13.3.4. India
13.3.5. Australia
13.3.6. New Zealand
13.3.7. Rest of Asia-Pacific
13.4. South America
13.4.1. Brazil
13.4.2. Argentina
13.4.3. Chile
13.4.4. Colombia
13.4.5. Rest of South America
13.5. Rest of the World
13.5.1. Middle East
13.5.2. Africa
14. Crankshaft Position Sensor Market – Entropy
15. Crankshaft Position Sensor Market – Industry/Segment Competition Landscape Premium
15.1. Market Share Analysis
15.1.1. Market Share by Region – Key companies
15.1.2. Market Share by Countries – Key Companies
15.2. Competition Matrix
15.3. Best Practices for Companies
16. Crankshaft Position Sensor Market– Key Company List by Country Premium Premium
17. Crankshaft Position Sensor Market Company Analysis (Overview, Financials, Developments, Product Portfolio)
17.1. Delphi Automotive PLC
17.2. Robert Bosch GmbH
17.3. Denso Corporation
17.4. Honeywell International Inc.
17.5. Suntech Auto Spares
17.6. Hitachi Astemo, Ltd.
17.7. Wenzhou Fonan Automotive Electronics Co., Ltd.
17.8. Guangzhou Yaopei Auto Parts Co., Ltd.
17.9. BWD
17.10. Taiwan Ignition System Co., Ltd.
List of Tables:
Table 1: Crankshaft Position Sensor Market Overview 2023-2030
Table 2: Crankshaft Position Sensor Market Leader Analysis 2023-2030 (US$)
Table 3: Crankshaft Position Sensor Market Product Analysis 2023-2030 (US$)
Table 4: Crankshaft Position Sensor Market End User Analysis 2023-2030 (US$)
Table 5: Crankshaft Position Sensor Market Patent Analysis 2013-2023* (US$)
Table 6: Crankshaft Position Sensor Market Financial Analysis 2023-2030 (US$)
Table 7: Crankshaft Position Sensor Market Driver Analysis 2023-2030 (US$)
Table 8: Crankshaft Position Sensor Market Challenges Analysis 2023-2030 (US$)
Table 9: Crankshaft Position Sensor Market Constraint Analysis 2023-2030 (US$)
Table 10: Crankshaft Position Sensor Market Supplier Bargaining Power Analysis 2023-2030 (US$)
Table 11: Crankshaft Position Sensor Market Buyer Bargaining Power Analysis 2023-2030 (US$)
Table 12: Crankshaft Position Sensor Market Threat of Substitutes Analysis 2023-2030 (US$)
Table 13: Crankshaft Position Sensor Market Threat of New Entrants Analysis 2023-2030 (US$)
Table 14: Crankshaft Position Sensor Market Degree of Competition Analysis 2023-2030 (US$)
Table 15: Crankshaft Position Sensor Market Value Chain Analysis 2023-2030 (US$)
Table 16: Crankshaft Position Sensor Market Pricing Analysis 2023-2030 (US$)
Table 17: Crankshaft Position Sensor Market Opportunities Analysis 2023-2030 (US$)
Table 18: Crankshaft Position Sensor Market Product Life Cycle Analysis 2023-2030 (US$)
Table 19: Crankshaft Position Sensor Market Supplier Analysis 2023-2030 (US$)
Table 20: Crankshaft Position Sensor Market Distributor Analysis 2023-2030 (US$)
Table 21: Crankshaft Position Sensor Market Trend Analysis 2023-2030 (US$)
Table 22: Crankshaft Position Sensor Market Size 2023 (US$)
Table 23: Crankshaft Position Sensor Market Forecast Analysis 2023-2030 (US$)
Table 24: Crankshaft Position Sensor Market Sales Forecast Analysis 2023-2030 (Units)
Table 25: Crankshaft Position Sensor Market, Revenue & Volume, By Type, 2023-2030 ($)
Table 26: Crankshaft Position Sensor Market By Type, Revenue & Volume, By Linear Position Sensor, 2023-2030 ($)
Table 27: Crankshaft Position Sensor Market By Type, Revenue & Volume, By Rotary Position Sensor, 2023-2030 ($)
Table 28: Crankshaft Position Sensor Market By Type, Revenue & Volume, By Proximity Sensors, 2023-2030 ($)
Table 29: Crankshaft Position Sensor Market, Revenue & Volume, By Contact Type, 2023-2030 ($)
Table 30: Crankshaft Position Sensor Market By Contact Type, Revenue & Volume, By Contact, 2023-2030 ($)
Table 31: Crankshaft Position Sensor Market By Contact Type, Revenue & Volume, By Non-Contact, 2023-2030 ($)
Table 32: Crankshaft Position Sensor Market, Revenue & Volume, By Technology, 2023-2030 ($)
Table 33: Crankshaft Position Sensor Market By Technology, Revenue & Volume, By Hall-Effect Sensor, 2023-2030 ($)
Table 34: Crankshaft Position Sensor Market By Technology, Revenue & Volume, By Magnetoresistive Sensor, 2023-2030 ($)
Table 35: Crankshaft Position Sensor Market, Revenue & Volume, By Output, 2023-2030 ($)
Table 36: Crankshaft Position Sensor Market By Output, Revenue & Volume, By Analog, 2023-2030 ($)
Table 37: Crankshaft Position Sensor Market By Output, Revenue & Volume, By Digital, 2023-2030 ($)
Table 38: Crankshaft Position Sensor Market, Revenue & Volume, By End-User, 2023-2030 ($)
Table 39: Crankshaft Position Sensor Market By End-User, Revenue & Volume, By Automotive, 2023-2030 ($)
Table 40: Crankshaft Position Sensor Market By End-User, Revenue & Volume, By Aerospace, 2023-2030 ($)
Table 41: Crankshaft Position Sensor Market By End-User, Revenue & Volume, By Others, 2023-2030 ($)
Table 42: North America Crankshaft Position Sensor Market, Revenue & Volume, By Type, 2023-2030 ($)
Table 43: North America Crankshaft Position Sensor Market, Revenue & Volume, By Contact Type, 2023-2030 ($)
Table 44: North America Crankshaft Position Sensor Market, Revenue & Volume, By Technology, 2023-2030 ($)
Table 45: North America Crankshaft Position Sensor Market, Revenue & Volume, By Output, 2023-2030 ($)
Table 46: North America Crankshaft Position Sensor Market, Revenue & Volume, By End-User, 2023-2030 ($)
Table 47: South america Crankshaft Position Sensor Market, Revenue & Volume, By Type, 2023-2030 ($)
Table 48: South america Crankshaft Position Sensor Market, Revenue & Volume, By Contact Type, 2023-2030 ($)
Table 49: South america Crankshaft Position Sensor Market, Revenue & Volume, By Technology, 2023-2030 ($)
Table 50: South america Crankshaft Position Sensor Market, Revenue & Volume, By Output, 2023-2030 ($)
Table 51: South america Crankshaft Position Sensor Market, Revenue & Volume, By End-User, 2023-2030 ($)
Table 52: Europe Crankshaft Position Sensor Market, Revenue & Volume, By Type, 2023-2030 ($)
Table 53: Europe Crankshaft Position Sensor Market, Revenue & Volume, By Contact Type, 2023-2030 ($)
Table 54: Europe Crankshaft Position Sensor Market, Revenue & Volume, By Technology, 2023-2030 ($)
Table 55: Europe Crankshaft Position Sensor Market, Revenue & Volume, By Output, 2023-2030 ($)
Table 56: Europe Crankshaft Position Sensor Market, Revenue & Volume, By End-User, 2023-2030 ($)
Table 57: APAC Crankshaft Position Sensor Market, Revenue & Volume, By Type, 2023-2030 ($)
Table 58: APAC Crankshaft Position Sensor Market, Revenue & Volume, By Contact Type, 2023-2030 ($)
Table 59: APAC Crankshaft Position Sensor Market, Revenue & Volume, By Technology, 2023-2030 ($)
Table 60: APAC Crankshaft Position Sensor Market, Revenue & Volume, By Output, 2023-2030 ($)
Table 61: APAC Crankshaft Position Sensor Market, Revenue & Volume, By End-User, 2023-2030 ($)
Table 62: Middle East & Africa Crankshaft Position Sensor Market, Revenue & Volume, By Type, 2023-2030 ($)
Table 63: Middle East & Africa Crankshaft Position Sensor Market, Revenue & Volume, By Contact Type, 2023-2030 ($)
Table 64: Middle East & Africa Crankshaft Position Sensor Market, Revenue & Volume, By Technology, 2023-2030 ($)
Table 65: Middle East & Africa Crankshaft Position Sensor Market, Revenue & Volume, By Output, 2023-2030 ($)
Table 66: Middle East & Africa Crankshaft Position Sensor Market, Revenue & Volume, By End-User, 2023-2030 ($)
Table 67: Russia Crankshaft Position Sensor Market, Revenue & Volume, By Type, 2023-2030 ($)
Table 68: Russia Crankshaft Position Sensor Market, Revenue & Volume, By Contact Type, 2023-2030 ($)
Table 69: Russia Crankshaft Position Sensor Market, Revenue & Volume, By Technology, 2023-2030 ($)
Table 70: Russia Crankshaft Position Sensor Market, Revenue & Volume, By Output, 2023-2030 ($)
Table 71: Russia Crankshaft Position Sensor Market, Revenue & Volume, By End-User, 2023-2030 ($)
Table 72: Israel Crankshaft Position Sensor Market, Revenue & Volume, By Type, 2023-2030 ($)
Table 73: Israel Crankshaft Position Sensor Market, Revenue & Volume, By Contact Type, 2023-2030 ($)
Table 74: Israel Crankshaft Position Sensor Market, Revenue & Volume, By Technology, 2023-2030 ($)
Table 75: Israel Crankshaft Position Sensor Market, Revenue & Volume, By Output, 2023-2030 ($)
Table 76: Israel Crankshaft Position Sensor Market, Revenue & Volume, By End-User, 2023-2030 ($)
Table 77: Top Companies 2023 (US$)Crankshaft Position Sensor Market, Revenue & Volume
Table 78: Product Launch 2023-2030Crankshaft Position Sensor Market, Revenue & Volume
Table 79: Mergers & Acquistions 2023-2030Crankshaft Position Sensor Market, Revenue & Volume
List of Figures:
Figure 1: Overview of Crankshaft Position Sensor Market 2023-2030
Figure 2: Market Share Analysis for Crankshaft Position Sensor Market 2023 (US$)
Figure 3: Product Comparison in Crankshaft Position Sensor Market 2023-2030 (US$)
Figure 4: End User Profile for Crankshaft Position Sensor Market 2023-2030 (US$)
Figure 5: Patent Application and Grant in Crankshaft Position Sensor Market 2013-2023* (US$)
Figure 6: Top 5 Companies Financial Analysis in Crankshaft Position Sensor Market 2023-2030 (US$)
Figure 7: Market Entry Strategy in Crankshaft Position Sensor Market 2023-2030
Figure 8: Ecosystem Analysis in Crankshaft Position Sensor Market 2023
Figure 9: Average Selling Price in Crankshaft Position Sensor Market 2023-2030
Figure 10: Top Opportunites in Crankshaft Position Sensor Market 2023-2030
Figure 11: Market Life Cycle Analysis in Crankshaft Position Sensor Market
Figure 12: GlobalBy TypeCrankshaft Position Sensor Market Revenue, 2023-2030 ($)
Figure 13: GlobalBy Contact TypeCrankshaft Position Sensor Market Revenue, 2023-2030 ($)
Figure 14: GlobalBy TechnologyCrankshaft Position Sensor Market Revenue, 2023-2030 ($)
Figure 15: GlobalBy OutputCrankshaft Position Sensor Market Revenue, 2023-2030 ($)
Figure 16: GlobalBy End-UserCrankshaft Position Sensor Market Revenue, 2023-2030 ($)
Figure 17: Global Crankshaft Position Sensor Market - By Geography
Figure 18: Global Crankshaft Position Sensor Market Value & Volume, By Geography, 2023-2030 ($)
Figure 19: Global Crankshaft Position Sensor Market CAGR, By Geography, 2023-2030 (%)
Figure 20: North America Crankshaft Position Sensor Market Value & Volume, 2023-2030 ($)
Figure 21: US Crankshaft Position Sensor Market Value & Volume, 2023-2030 ($)
Figure 22: US GDP and Population, 2023-2030 ($)
Figure 23: US GDP – Composition of 2023, By Sector of Origin
Figure 24: US Export and Import Value & Volume, 2023-2030 ($)
Figure 25: Canada Crankshaft Position Sensor Market Value & Volume, 2023-2030 ($)
Figure 26: Canada GDP and Population, 2023-2030 ($)
Figure 27: Canada GDP – Composition of 2023, By Sector of Origin
Figure 28: Canada Export and Import Value & Volume, 2023-2030 ($)
Figure 29: Mexico Crankshaft Position Sensor Market Value & Volume, 2023-2030 ($)
Figure 30: Mexico GDP and Population, 2023-2030 ($)
Figure 31: Mexico GDP – Composition of 2023, By Sector of Origin
Figure 32: Mexico Export and Import Value & Volume, 2023-2030 ($)
Figure 33: South America Crankshaft Position Sensor Market Value & Volume, 2023-2030 ($)
Figure 34: Brazil Crankshaft Position Sensor Market Value & Volume, 2023-2030 ($)
Figure 35: Brazil GDP and Population, 2023-2030 ($)
Figure 36: Brazil GDP – Composition of 2023, By Sector of Origin
Figure 37: Brazil Export and Import Value & Volume, 2023-2030 ($)
Figure 38: Venezuela Crankshaft Position Sensor Market Value & Volume, 2023-2030 ($)
Figure 39: Venezuela GDP and Population, 2023-2030 ($)
Figure 40: Venezuela GDP – Composition of 2023, By Sector of Origin
Figure 41: Venezuela Export and Import Value & Volume, 2023-2030 ($)
Figure 42: Argentina Crankshaft Position Sensor Market Value & Volume, 2023-2030 ($)
Figure 43: Argentina GDP and Population, 2023-2030 ($)
Figure 44: Argentina GDP – Composition of 2023, By Sector of Origin
Figure 45: Argentina Export and Import Value & Volume, 2023-2030 ($)
Figure 46: Ecuador Crankshaft Position Sensor Market Value & Volume, 2023-2030 ($)
Figure 47: Ecuador GDP and Population, 2023-2030 ($)
Figure 48: Ecuador GDP – Composition of 2023, By Sector of Origin
Figure 49: Ecuador Export and Import Value & Volume, 2023-2030 ($)
Figure 50: Peru Crankshaft Position Sensor Market Value & Volume, 2023-2030 ($)
Figure 51: Peru GDP and Population, 2023-2030 ($)
Figure 52: Peru GDP – Composition of 2023, By Sector of Origin
Figure 53: Peru Export and Import Value & Volume, 2023-2030 ($)
Figure 54: Colombia Crankshaft Position Sensor Market Value & Volume, 2023-2030 ($)
Figure 55: Colombia GDP and Population, 2023-2030 ($)
Figure 56: Colombia GDP – Composition of 2023, By Sector of Origin
Figure 57: Colombia Export and Import Value & Volume, 2023-2030 ($)
Figure 58: Costa Rica Crankshaft Position Sensor Market Value & Volume, 2023-2030 ($)
Figure 59: Costa Rica GDP and Population, 2023-2030 ($)
Figure 60: Costa Rica GDP – Composition of 2023, By Sector of Origin
Figure 61: Costa Rica Export and Import Value & Volume, 2023-2030 ($)
Figure 62: Europe Crankshaft Position Sensor Market Value & Volume, 2023-2030 ($)
Figure 63: U.K Crankshaft Position Sensor Market Value & Volume, 2023-2030 ($)
Figure 64: U.K GDP and Population, 2023-2030 ($)
Figure 65: U.K GDP – Composition of 2023, By Sector of Origin
Figure 66: U.K Export and Import Value & Volume, 2023-2030 ($)
Figure 67: Germany Crankshaft Position Sensor Market Value & Volume, 2023-2030 ($)
Figure 68: Germany GDP and Population, 2023-2030 ($)
Figure 69: Germany GDP – Composition of 2023, By Sector of Origin
Figure 70: Germany Export and Import Value & Volume, 2023-2030 ($)
Figure 71: Italy Crankshaft Position Sensor Market Value & Volume, 2023-2030 ($)
Figure 72: Italy GDP and Population, 2023-2030 ($)
Figure 73: Italy GDP – Composition of 2023, By Sector of Origin
Figure 74: Italy Export and Import Value & Volume, 2023-2030 ($)
Figure 75: France Crankshaft Position Sensor Market Value & Volume, 2023-2030 ($)
Figure 76: France GDP and Population, 2023-2030 ($)
Figure 77: France GDP – Composition of 2023, By Sector of Origin
Figure 78: France Export and Import Value & Volume, 2023-2030 ($)
Figure 79: Netherlands Crankshaft Position Sensor Market Value & Volume, 2023-2030 ($)
Figure 80: Netherlands GDP and Population, 2023-2030 ($)
Figure 81: Netherlands GDP – Composition of 2023, By Sector of Origin
Figure 82: Netherlands Export and Import Value & Volume, 2023-2030 ($)
Figure 83: Belgium Crankshaft Position Sensor Market Value & Volume, 2023-2030 ($)
Figure 84: Belgium GDP and Population, 2023-2030 ($)
Figure 85: Belgium GDP – Composition of 2023, By Sector of Origin
Figure 86: Belgium Export and Import Value & Volume, 2023-2030 ($)
Figure 87: Spain Crankshaft Position Sensor Market Value & Volume, 2023-2030 ($)
Figure 88: Spain GDP and Population, 2023-2030 ($)
Figure 89: Spain GDP – Composition of 2023, By Sector of Origin
Figure 90: Spain Export and Import Value & Volume, 2023-2030 ($)
Figure 91: Denmark Crankshaft Position Sensor Market Value & Volume, 2023-2030 ($)
Figure 92: Denmark GDP and Population, 2023-2030 ($)
Figure 93: Denmark GDP – Composition of 2023, By Sector of Origin
Figure 94: Denmark Export and Import Value & Volume, 2023-2030 ($)
Figure 95: APAC Crankshaft Position Sensor Market Value & Volume, 2023-2030 ($)
Figure 96: China Crankshaft Position Sensor Market Value & Volume, 2023-2030
Figure 97: China GDP and Population, 2023-2030 ($)
Figure 98: China GDP – Composition of 2023, By Sector of Origin
Figure 99: China Export and Import Value & Volume, 2023-2030 ($)Crankshaft Position Sensor Market China Export and Import Value & Volume, 2023-2030 ($)
Figure 100: Australia Crankshaft Position Sensor Market Value & Volume, 2023-2030 ($)
Figure 101: Australia GDP and Population, 2023-2030 ($)
Figure 102: Australia GDP – Composition of 2023, By Sector of Origin
Figure 103: Australia Export and Import Value & Volume, 2023-2030 ($)
Figure 104: South Korea Crankshaft Position Sensor Market Value & Volume, 2023-2030 ($)
Figure 105: South Korea GDP and Population, 2023-2030 ($)
Figure 106: South Korea GDP – Composition of 2023, By Sector of Origin
Figure 107: South Korea Export and Import Value & Volume, 2023-2030 ($)
Figure 108: India Crankshaft Position Sensor Market Value & Volume, 2023-2030 ($)
Figure 109: India GDP and Population, 2023-2030 ($)
Figure 110: India GDP – Composition of 2023, By Sector of Origin
Figure 111: India Export and Import Value & Volume, 2023-2030 ($)
Figure 112: Taiwan Crankshaft Position Sensor Market Value & Volume, 2023-2030 ($)
Figure 113: Taiwan GDP and Population, 2023-2030 ($)
Figure 114: Taiwan GDP – Composition of 2023, By Sector of Origin
Figure 115: Taiwan Export and Import Value & Volume, 2023-2030 ($)
Figure 116: Malaysia Crankshaft Position Sensor Market Value & Volume, 2023-2030 ($)
Figure 117: Malaysia GDP and Population, 2023-2030 ($)
Figure 118: Malaysia GDP – Composition of 2023, By Sector of Origin
Figure 119: Malaysia Export and Import Value & Volume, 2023-2030 ($)
Figure 120: Hong Kong Crankshaft Position Sensor Market Value & Volume, 2023-2030 ($)
Figure 121: Hong Kong GDP and Population, 2023-2030 ($)
Figure 122: Hong Kong GDP – Composition of 2023, By Sector of Origin
Figure 123: Hong Kong Export and Import Value & Volume, 2023-2030 ($)
Figure 124: Middle East & Africa Crankshaft Position Sensor Market Middle East & Africa 3D Printing Market Value & Volume, 2023-2030 ($)
Figure 125: Russia Crankshaft Position Sensor Market Value & Volume, 2023-2030 ($)
Figure 126: Russia GDP and Population, 2023-2030 ($)
Figure 127: Russia GDP – Composition of 2023, By Sector of Origin
Figure 128: Russia Export and Import Value & Volume, 2023-2030 ($)
Figure 129: Israel Crankshaft Position Sensor Market Value & Volume, 2023-2030 ($)
Figure 130: Israel GDP and Population, 2023-2030 ($)
Figure 131: Israel GDP – Composition of 2023, By Sector of Origin
Figure 132: Israel Export and Import Value & Volume, 2023-2030 ($)
Figure 133: Entropy Share, By Strategies, 2023-2030* (%)Crankshaft Position Sensor Market
Figure 134: Developments, 2023-2030*Crankshaft Position Sensor Market
Figure 135: Company 1 Crankshaft Position Sensor Market Net Revenue, By Years, 2023-2030* ($)
Figure 136: Company 1 Crankshaft Position Sensor Market Net Revenue Share, By Business segments, 2023 (%)
Figure 137: Company 1 Crankshaft Position Sensor Market Net Sales Share, By Geography, 2023 (%)
Figure 138: Company 2 Crankshaft Position Sensor Market Net Revenue, By Years, 2023-2030* ($)
Figure 139: Company 2 Crankshaft Position Sensor Market Net Revenue Share, By Business segments, 2023 (%)
Figure 140: Company 2 Crankshaft Position Sensor Market Net Sales Share, By Geography, 2023 (%)
Figure 141: Company 3 Crankshaft Position Sensor Market Net Revenue, By Years, 2023-2030* ($)
Figure 142: Company 3 Crankshaft Position Sensor Market Net Revenue Share, By Business segments, 2023 (%)
Figure 143: Company 3 Crankshaft Position Sensor Market Net Sales Share, By Geography, 2023 (%)
Figure 144: Company 4 Crankshaft Position Sensor Market Net Revenue, By Years, 2023-2030* ($)
Figure 145: Company 4 Crankshaft Position Sensor Market Net Revenue Share, By Business segments, 2023 (%)
Figure 146: Company 4 Crankshaft Position Sensor Market Net Sales Share, By Geography, 2023 (%)
Figure 147: Company 5 Crankshaft Position Sensor Market Net Revenue, By Years, 2023-2030* ($)
Figure 148: Company 5 Crankshaft Position Sensor Market Net Revenue Share, By Business segments, 2023 (%)
Figure 149: Company 5 Crankshaft Position Sensor Market Net Sales Share, By Geography, 2023 (%)
Figure 150: Company 6 Crankshaft Position Sensor Market Net Revenue, By Years, 2023-2030* ($)
Figure 151: Company 6 Crankshaft Position Sensor Market Net Revenue Share, By Business segments, 2023 (%)
Figure 152: Company 6 Crankshaft Position Sensor Market Net Sales Share, By Geography, 2023 (%)
Figure 153: Company 7 Crankshaft Position Sensor Market Net Revenue, By Years, 2023-2030* ($)
Figure 154: Company 7 Crankshaft Position Sensor Market Net Revenue Share, By Business segments, 2023 (%)
Figure 155: Company 7 Crankshaft Position Sensor Market Net Sales Share, By Geography, 2023 (%)
Figure 156: Company 8 Crankshaft Position Sensor Market Net Revenue, By Years, 2023-2030* ($)
Figure 157: Company 8 Crankshaft Position Sensor Market Net Revenue Share, By Business segments, 2023 (%)
Figure 158: Company 8 Crankshaft Position Sensor Market Net Sales Share, By Geography, 2023 (%)
Figure 159: Company 9 Crankshaft Position Sensor Market Net Revenue, By Years, 2023-2030* ($)
Figure 160: Company 9 Crankshaft Position Sensor Market Net Revenue Share, By Business segments, 2023 (%)
Figure 161: Company 9 Crankshaft Position Sensor Market Net Sales Share, By Geography, 2023 (%)
Figure 162: Company 10 Crankshaft Position Sensor Market Net Revenue, By Years, 2023-2030* ($)
Figure 163: Company 10 Crankshaft Position Sensor Market Net Revenue Share, By Business segments, 2023 (%)
Figure 164: Company 10 Crankshaft Position Sensor Market Net Sales Share, By Geography, 2023 (%)
Figure 165: Company 11 Crankshaft Position Sensor Market Net Revenue, By Years, 2023-2030* ($)
Figure 166: Company 11 Crankshaft Position Sensor Market Net Revenue Share, By Business segments, 2023 (%)
Figure 167: Company 11 Crankshaft Position Sensor Market Net Sales Share, By Geography, 2023 (%)
Figure 168: Company 12 Crankshaft Position Sensor Market Net Revenue, By Years, 2023-2030* ($)
Figure 169: Company 12 Crankshaft Position Sensor Market Net Revenue Share, By Business segments, 2023 (%)
Figure 170: Company 12 Crankshaft Position Sensor Market Net Sales Share, By Geography, 2023 (%)
Figure 171: Company 13 Crankshaft Position Sensor Market Net Revenue, By Years, 2023-2030* ($)
Figure 172: Company 13 Crankshaft Position Sensor Market Net Revenue Share, By Business segments, 2023 (%)
Figure 173: Company 13 Crankshaft Position Sensor Market Net Sales Share, By Geography, 2023 (%)
Figure 174: Company 14 Crankshaft Position Sensor Market Net Revenue, By Years, 2023-2030* ($)
Figure 175: Company 14 Crankshaft Position Sensor Market Net Revenue Share, By Business segments, 2023 (%)
Figure 176: Company 14 Crankshaft Position Sensor Market Net Sales Share, By Geography, 2023 (%)
Figure 177: Company 15 Crankshaft Position Sensor Market Net Revenue, By Years, 2023-2030* ($)
Figure 178: Company 15 Crankshaft Position Sensor Market Net Revenue Share, By Business segments, 2023 (%)
Figure 179: Company 15 Crankshaft Position Sensor Market Net Sales Share, By Geography, 2023 (%)