 Email
Email Print
Print


Carbon Nanomaterials Market - Forecast(2025 - 2031)
Carbon Nanomaterials Market Overview
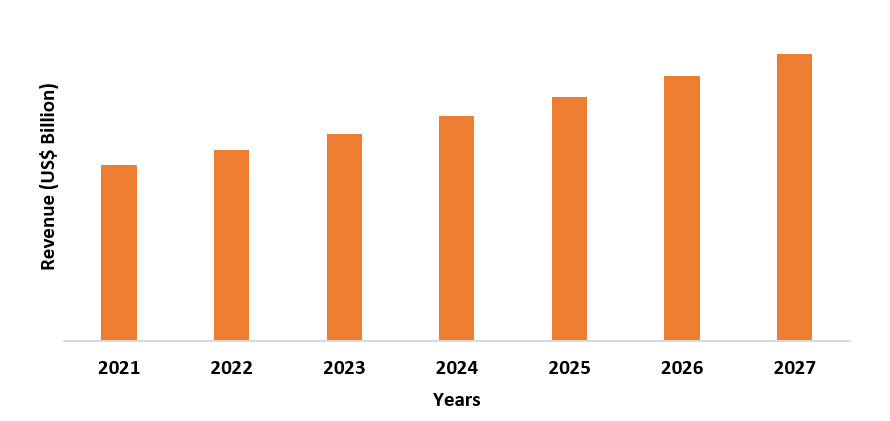
The Carbon Nanomaterials Market size is forecast to reach US$16.3 billion by 2027, after growing at a CAGR of 16.5% during the forecast period 2022-2027. The nanomaterials that are composed of carbon atoms are known as carbon nanomaterials. Carbon-based nanomaterials are classified according to their geometrical structure. The rising automotive sector is driving the carbon nanomaterials market growth. It is utilized as a lubricant additive for its excellent thermal and lubrication characteristics. The growing medical & healthcare industry is anticipated to drive the demand for carbon nanomaterials such as carbon nanofibers, fullerenes, graphene and others in therapeutic, medical devices, drug delivery and other applications. Moreover, the increasing requirement for carbon nanomaterials in the electrical & electronics industry for making transistors, sensors, conductive layers for the touch screen industry and high mobility electronic materials is anticipated to upsurge the growth of the carbon nanomaterials industry in the forecast period. The global economic downturn caused by the COVID-19 pandemic resulted in a huge drop in consumer electronics, construction, automotive and other end-use industries all across the world, which had a significant impact on the growth of the Carbon Nanomaterials market size.
Report Coverage
The “Carbon Nanomaterials Market Report – Forecast (2022 - 2027)” by IndustryARC, covers an in-depth analysis of the following segments in the carbon nanomaterials industry.
Key Takeaways
- The Asia Pacific region dominates the Carbon Nanomaterials market owing to the massive growth in the electrical and electronics industry. For instance, according to Invest India, domestic production of electronics hardware reached US$76 billion in 2019-20 with a CAGR of around 23%. Production-linked incentives of INR 40,951 crores (US$5544 million) are funded for over 5 years.
- Rapidly rising demand for Carbon Nanomaterials in the automotive industry, to be used as lubricant additives for their excellent thermal and lubrication characteristics, has driven the growth of the Carbon Nanomaterials market.
- The increasing demand for Carbon Nanomaterials in the medical and healthcare industry, due to its usage in therapeutic, medical devices, drug delivery and other applications has been a critical factor driving the growth of the Carbon Nanomaterials market in the upcoming years.
- However, the problems associated with carbon nanomaterials can hinder the growth of the Carbon Nanomaterials market.
Carbon
Nanomaterials Market Segment
Analysis – by Type
The Carbon Nanotube (CNT) segment held the largest Carbon Nanomaterials Market share in 2021 and is expected to grow at a CAGR of 16.6% during 2022-2027. Carbon nanotubes are extensively utilized in applications such as medical & healthcare, optical devices, electrical devices and others, which are estimated to increase the growth of the segment during the forecast period. These tubes exhibit good electrical conductivity and are applied in conductive transparent electrodes, conductive nano inks, conductive heating films, nanodevices, chemical sensors, thermal interface material, super batteries, displays, supercapacitors energy storages, solar power cells and other applications. Therefore, the growing electrical & electronics industry is also estimated to drive the demand for carbon nanotubes. Thus, the exhibited characteristics of carbon nanotubes make it a preferred choice over the other Carbon Nanomaterial types, which is driving its segmental growth.
Carbon Nanomaterials Market Segment Analysis – by End-use Industry
The medical and healthcare industry held the largest Carbon Nanomaterials Market share in 2021 and is expected to grow at a CAGR of 16.9% during 2022-2027. The rise in the aging population and advancements in medical devices would increase the usage of carbon nanomaterials, such as in therapeutic, medical devices, drug delivery and other applications. The demand for carbon nanomaterials such as carbon nanofibers, fullerenes, graphene, and others, for selective cancer cell destruction, is driving the market growth. The carbon nanomaterials-based devices are utilized in stem cell-based therapies and tissue engineering applications such as myocardial therapy, muscle and neuronal regeneration and bone formation. The medical and healthcare sector continues to grow. According to International Trade Administration, in Mexico, the total local production of medical devices and equipment increased from US$16.80 billion in 2020 to US$15.12 billion in 2021. Additionally, according to the U.S. Food & Drug Administration, in 2022, the government announced a US$5 million increase towards the improvement in the safety and security of medical devices. Thus, with the growing demand for medical applications such as devices, therapeutic applications and others in the medical and healthcare industry, the Carbon Nanomaterials market would further rise over the forecast period.
Carbon Nanomaterials Market Segment Analysis – by Geography
The Asia-Pacific region dominated the Carbon Nanomaterials Market share by 38% in the year 2021. It was due to the increasing requirement for carbon nanomaterials in developing countries such as China, Japan, India and South Korea. China, India and Taiwan are expected to continue their dominance in the carbon nanomaterials market during the forecast period. This is due to the growth of the medical & healthcare industries in the countries. For instance, according to International Trade Administration, in China, the medical device market is expected to expand by a 2020-2025 CAGR of 6.2%, which should see it rise to US$38.4 billion by 2025. Moreover, according to Invest India, the medical device sector is growing steadily at a CAGR of 15% over the last 3 years and the medical devices industry in India is poised for significant growth with the market size expected to reach US$50 billion by 2025. Thus, the rising growth in the demand for medical devices in the medical & healthcare sector is proving to be a market booster for the Carbon Nanomaterials market size in this region.
Carbon Nanomaterials Market Drivers
Growing Automotive Industry:
In the automotive industry, Carbon Nanomaterials are
used as lubricant additives for their excellent
thermal and lubrication characteristics. These are non-toxic and eco-friendly in
nature, therefore, are utilized as lube additives. Carbon nanomaterials exhibit
superior mechanical characteristics and are lightweight. These nanomaterials such as carbon nanofibers, fullerenes,
graphene and others are applied for designing and producing car
interiors and exteriors. Also, they are extensively used in automobiles to
reduce the aluminum engine weight, in Li-ion batteries to shorten the recharge
time, for better grip and low rolling resistance, to reduce the weight of
automobiles and increase the tensile strength. According to the
European Automobile Manufacturers' Association (ACEA), in 2021, 79.1 million
motor vehicles were produced around the world. It was an increase of 1.3% compared to
2020. Also, according to the Organisation Internationale des Constructeurs
d'Automobiles (OICA), in the USA, the production of motor vehicles increased
from 62,39,401 units in 2020 to 68,57,182 units in the year 2021. Moreover, in
Austria, motor vehicle production increased from 86,300 units in 2020 to 92,000
units in the year 2021. With the increasing production of automobiles, it is
estimated that in the upcoming years the requirement for carbon nanomaterials
in the automotive industry would rise, which would boost the growth of the carbon nanomaterials industry.
Booming Electrical & Electronics Industry:
The electrical and electronics industry uses Carbon Nanomaterials for making transistors, sensors, conductive layers for the touch screen industry and high mobility electronic materials. In the past few years, the electrical and electronics industry has grown significantly. According to the Indian Brand Equity Foundation (IBEF), the Indian electronics manufacturing industry is projected to reach US$520 billion by 2025. Moreover, in 2022, the Government of Canada announced the Semiconductor Challenge Callout to build on Canada’s domestic strengths associated with the development and supply of semiconductors, with a fund of US$150 million through the Strategic Innovation Fund to make targeted investments. Thus, the growing electrical and electronics industry would require more Carbon Nanomaterials for making transistors and sensors, which would drive the Carbon Nanomaterials market growth during the forecast period.
Carbon Nanomaterials Market Challenge:
Problems Associated
with Carbon Nanomaterials:
There are several
benefits of Carbon Nanomaterial. However, the increasing concerns over the
environmental impact, caused by them, have led to the imposition of stringent
regulations for carbon nanomaterial manufacturers. It possesses a huge risk to
human beings and the environment. The toxic effects on human health include
heart attack, kidney damage and an increased risk of high blood pressure. Carbon
nanomaterials are fibrous in nature and may cause health issues on inhalation. The
commercial-grade of carbon nanomaterial contains 60%–70% impurity, by weight, such
as medium & small-sized catalytic metal particles and carbonaceous
materials. Purification and functionalization of carbon nanomaterial, without
damage to their framework for maintaining and transferring their outstanding characteristics,
are challenging for producers. Thus,
the problems associated with Carbon Nanomaterials would create hurdles for the
market's growth.
Carbon Nanomaterials Market Industry Outlook
Technology launches, acquisitions and R&D
activities are key strategies players adopt in the Carbon
Nanomaterials markets. The top 10
companies in the Carbon Nanomaterials market are:
- LG Chemical Limited
- Cabot Corporation
- Showa Denko K.K.
- Jiangsu Cnano Technology Co. Ltd.
- Chengdu Organic Chemicals Co. Ltd.
- Arkema SA
- CHASM Advanced Materials Inc.
- Hyperion Catalysis International
- Jiangsu Tiannai Technology Co. Ltd.
- Klean Industries
Recent Developments
- In April 2022, CEMEX announced that it had successfully tested a process that converted flue gases emitted by the cement kiln into carbon nanomaterials, thereby transforming "bad" carbon into "good" carbon. Due to their unique mechanical, thermal, electrical and chemical properties, Carbon Nanomaterials have several potential applications in a wide array of industries, from construction to biomedicine.
- In March 2021, Cabot Corporation announced the launch of a new product named ENERMAX 6 under its carbon segment. Due to its properties such as its high aspect ratio, it has proven to be the most conductive multi-walled CNT product in the company's portfolio. This product series is expected to effectively enhance battery performance at lower loadings, enabling a higher energy density of batteries.
- In August 2020, ChemSpec North America announced that it entered into a non-exclusive distribution agreement with Belgium-based Nanocyl SA to promote and distribute Nanocyl’s various multiwall carbon nanotube (“MWCNT”) products. ChemSpec would focus its efforts on growing MWCNT products in thermoplastic and elastomer compounding.
Relevant Reports
Report Code: CMR 99741
Report Code: CMR 1046
Report Code: CMR 36583
For more Chemicals and Materials Market reports, please click here
Table 1 Carbon Nanomaterials Market Overview 2023-2030
Table 2 Carbon Nanomaterials Market Leader Analysis 2023-2030 (US$)
Table 3 Carbon Nanomaterials Market Product Analysis 2023-2030 (US$)
Table 4 Carbon Nanomaterials Market End User Analysis 2023-2030 (US$)
Table 5 Carbon Nanomaterials Market Patent Analysis 2013-2023* (US$)
Table 6 Carbon Nanomaterials Market Financial Analysis 2023-2030 (US$)
Table 7 Carbon Nanomaterials Market Driver Analysis 2023-2030 (US$)
Table 8 Carbon Nanomaterials Market Challenges Analysis 2023-2030 (US$)
Table 9 Carbon Nanomaterials Market Constraint Analysis 2023-2030 (US$)
Table 10 Carbon Nanomaterials Market Supplier Bargaining Power Analysis 2023-2030 (US$)
Table 11 Carbon Nanomaterials Market Buyer Bargaining Power Analysis 2023-2030 (US$)
Table 12 Carbon Nanomaterials Market Threat of Substitutes Analysis 2023-2030 (US$)
Table 13 Carbon Nanomaterials Market Threat of New Entrants Analysis 2023-2030 (US$)
Table 14 Carbon Nanomaterials Market Degree of Competition Analysis 2023-2030 (US$)
Table 15 Carbon Nanomaterials Market Value Chain Analysis 2023-2030 (US$)
Table 16 Carbon Nanomaterials Market Pricing Analysis 2023-2030 (US$)
Table 17 Carbon Nanomaterials Market Opportunities Analysis 2023-2030 (US$)
Table 18 Carbon Nanomaterials Market Product Life Cycle Analysis 2023-2030 (US$)
Table 19 Carbon Nanomaterials Market Supplier Analysis 2023-2030 (US$)
Table 20 Carbon Nanomaterials Market Distributor Analysis 2023-2030 (US$)
Table 21 Carbon Nanomaterials Market Trend Analysis 2023-2030 (US$)
Table 22 Carbon Nanomaterials Market Size 2023 (US$)
Table 23 Carbon Nanomaterials Market Forecast Analysis 2023-2030 (US$)
Table 24 Carbon Nanomaterials Market Sales Forecast Analysis 2023-2030 (Units)
Table 25 Carbon Nanomaterials Market, Revenue & Volume, By Material Type, 2023-2030 ($)
Table 26 Carbon Nanomaterials Market By Material Type, Revenue & Volume, By Carbon Nanotubes, 2023-2030 ($)
Table 27 Carbon Nanomaterials Market By Material Type, Revenue & Volume, By Carbon Nanofibres, 2023-2030 ($)
Table 28 Carbon Nanomaterials Market By Material Type, Revenue & Volume, By Graphene, 2023-2030 ($)
Table 29 Carbon Nanomaterials Market By Material Type, Revenue & Volume, By Fullerenes, 2023-2030 ($)
Table 30 Carbon Nanomaterials Market By Material Type, Revenue & Volume, By Polyhedral Oligomeric Silsesquioxane (POSS), 2023-2030 ($)
Table 31 Carbon Nanomaterials Market, Revenue & Volume, By Application, 2023-2030 ($)
Table 32 Carbon Nanomaterials Market By Application, Revenue & Volume, By Aerospace & Defence, 2023-2030 ($)
Table 33 Carbon Nanomaterials Market By Application, Revenue & Volume, By Automotive, 2023-2030 ($)
Table 34 Carbon Nanomaterials Market By Application, Revenue & Volume, By Energy, 2023-2030 ($)
Table 35 Carbon Nanomaterials Market By Application, Revenue & Volume, By Electronics & Telecommunications, 2023-2030 ($)
Table 36 Carbon Nanomaterials Market By Application, Revenue & Volume, By Medical, 2023-2030 ($)
Table 37 North America Carbon Nanomaterials Market, Revenue & Volume, By Material Type, 2023-2030 ($)
Table 38 North America Carbon Nanomaterials Market, Revenue & Volume, By Application, 2023-2030 ($)
Table 39 South america Carbon Nanomaterials Market, Revenue & Volume, By Material Type, 2023-2030 ($)
Table 40 South america Carbon Nanomaterials Market, Revenue & Volume, By Application, 2023-2030 ($)
Table 41 Europe Carbon Nanomaterials Market, Revenue & Volume, By Material Type, 2023-2030 ($)
Table 42 Europe Carbon Nanomaterials Market, Revenue & Volume, By Application, 2023-2030 ($)
Table 43 APAC Carbon Nanomaterials Market, Revenue & Volume, By Material Type, 2023-2030 ($)
Table 44 APAC Carbon Nanomaterials Market, Revenue & Volume, By Application, 2023-2030 ($)
Table 45 Middle East & Africa Carbon Nanomaterials Market, Revenue & Volume, By Material Type, 2023-2030 ($)
Table 46 Middle East & Africa Carbon Nanomaterials Market, Revenue & Volume, By Application, 2023-2030 ($)
Table 47 Russia Carbon Nanomaterials Market, Revenue & Volume, By Material Type, 2023-2030 ($)
Table 48 Russia Carbon Nanomaterials Market, Revenue & Volume, By Application, 2023-2030 ($)
Table 49 Israel Carbon Nanomaterials Market, Revenue & Volume, By Material Type, 2023-2030 ($)
Table 50 Israel Carbon Nanomaterials Market, Revenue & Volume, By Application, 2023-2030 ($)
Table 51 Top Companies 2023 (US$)Carbon Nanomaterials Market, Revenue & Volume
Table 52 Product Launch 2023-2030Carbon Nanomaterials Market, Revenue & Volume
Table 53 Mergers & Acquistions 2023-2030Carbon Nanomaterials Market, Revenue & Volume
List of Figures:
Figure 1 Overview of Carbon Nanomaterials Market 2023-2030
Figure 2 Market Share Analysis for Carbon Nanomaterials Market 2023 (US$)
Figure 3 Product Comparison in Carbon Nanomaterials Market 2023-2030 (US$)
Figure 4 End User Profile for Carbon Nanomaterials Market 2023-2030 (US$)
Figure 5 Patent Application and Grant in Carbon Nanomaterials Market 2013-2023* (US$)
Figure 6 Top 5 Companies Financial Analysis in Carbon Nanomaterials Market 2023-2030 (US$)
Figure 7 Market Entry Strategy in Carbon Nanomaterials Market 2023-2030
Figure 8 Ecosystem Analysis in Carbon Nanomaterials Market 2023
Figure 9 Average Selling Price in Carbon Nanomaterials Market 2023-2030
Figure 10 Top Opportunites in Carbon Nanomaterials Market 2023-2030
Figure 11 Market Life Cycle Analysis in Carbon Nanomaterials Market
Figure 12 GlobalBy Material TypeCarbon Nanomaterials Market Revenue, 2023-2030 ($)
Figure 13 GlobalBy ApplicationCarbon Nanomaterials Market Revenue, 2023-2030 ($)
Figure 14 Global Carbon Nanomaterials Market - By Geography
Figure 15 Global Carbon Nanomaterials Market Value & Volume, By Geography, 2023-2030 ($)
Figure 16 Global Carbon Nanomaterials Market CAGR, By Geography, 2023-2030 (%)
Figure 17 North America Carbon Nanomaterials Market Value & Volume, 2023-2030 ($)
Figure 18 US Carbon Nanomaterials Market Value & Volume, 2023-2030 ($)
Figure 19 US GDP and Population, 2023-2030 ($)
Figure 20 US GDP – Composition of 2023, By Sector of Origin
Figure 21 US Export and Import Value & Volume, 2023-2030 ($)
Figure 22 Canada Carbon Nanomaterials Market Value & Volume, 2023-2030 ($)
Figure 23 Canada GDP and Population, 2023-2030 ($)
Figure 24 Canada GDP – Composition of 2023, By Sector of Origin
Figure 25 Canada Export and Import Value & Volume, 2023-2030 ($)
Figure 26 Mexico Carbon Nanomaterials Market Value & Volume, 2023-2030 ($)
Figure 27 Mexico GDP and Population, 2023-2030 ($)
Figure 28 Mexico GDP – Composition of 2023, By Sector of Origin
Figure 29 Mexico Export and Import Value & Volume, 2023-2030 ($)
Figure 30 South America Carbon Nanomaterials Market Value & Volume, 2023-2030 ($)
Figure 31 Brazil Carbon Nanomaterials Market Value & Volume, 2023-2030 ($)
Figure 32 Brazil GDP and Population, 2023-2030 ($)
Figure 33 Brazil GDP – Composition of 2023, By Sector of Origin
Figure 34 Brazil Export and Import Value & Volume, 2023-2030 ($)
Figure 35 Venezuela Carbon Nanomaterials Market Value & Volume, 2023-2030 ($)
Figure 36 Venezuela GDP and Population, 2023-2030 ($)
Figure 37 Venezuela GDP – Composition of 2023, By Sector of Origin
Figure 38 Venezuela Export and Import Value & Volume, 2023-2030 ($)
Figure 39 Argentina Carbon Nanomaterials Market Value & Volume, 2023-2030 ($)
Figure 40 Argentina GDP and Population, 2023-2030 ($)
Figure 41 Argentina GDP – Composition of 2023, By Sector of Origin
Figure 42 Argentina Export and Import Value & Volume, 2023-2030 ($)
Figure 43 Ecuador Carbon Nanomaterials Market Value & Volume, 2023-2030 ($)
Figure 44 Ecuador GDP and Population, 2023-2030 ($)
Figure 45 Ecuador GDP – Composition of 2023, By Sector of Origin
Figure 46 Ecuador Export and Import Value & Volume, 2023-2030 ($)
Figure 47 Peru Carbon Nanomaterials Market Value & Volume, 2023-2030 ($)
Figure 48 Peru GDP and Population, 2023-2030 ($)
Figure 49 Peru GDP – Composition of 2023, By Sector of Origin
Figure 50 Peru Export and Import Value & Volume, 2023-2030 ($)
Figure 51 Colombia Carbon Nanomaterials Market Value & Volume, 2023-2030 ($)
Figure 52 Colombia GDP and Population, 2023-2030 ($)
Figure 53 Colombia GDP – Composition of 2023, By Sector of Origin
Figure 54 Colombia Export and Import Value & Volume, 2023-2030 ($)
Figure 55 Costa Rica Carbon Nanomaterials Market Value & Volume, 2023-2030 ($)
Figure 56 Costa Rica GDP and Population, 2023-2030 ($)
Figure 57 Costa Rica GDP – Composition of 2023, By Sector of Origin
Figure 58 Costa Rica Export and Import Value & Volume, 2023-2030 ($)
Figure 59 Europe Carbon Nanomaterials Market Value & Volume, 2023-2030 ($)
Figure 60 U.K Carbon Nanomaterials Market Value & Volume, 2023-2030 ($)
Figure 61 U.K GDP and Population, 2023-2030 ($)
Figure 62 U.K GDP – Composition of 2023, By Sector of Origin
Figure 63 U.K Export and Import Value & Volume, 2023-2030 ($)
Figure 64 Germany Carbon Nanomaterials Market Value & Volume, 2023-2030 ($)
Figure 65 Germany GDP and Population, 2023-2030 ($)
Figure 66 Germany GDP – Composition of 2023, By Sector of Origin
Figure 67 Germany Export and Import Value & Volume, 2023-2030 ($)
Figure 68 Italy Carbon Nanomaterials Market Value & Volume, 2023-2030 ($)
Figure 69 Italy GDP and Population, 2023-2030 ($)
Figure 70 Italy GDP – Composition of 2023, By Sector of Origin
Figure 71 Italy Export and Import Value & Volume, 2023-2030 ($)
Figure 72 France Carbon Nanomaterials Market Value & Volume, 2023-2030 ($)
Figure 73 France GDP and Population, 2023-2030 ($)
Figure 74 France GDP – Composition of 2023, By Sector of Origin
Figure 75 France Export and Import Value & Volume, 2023-2030 ($)
Figure 76 Netherlands Carbon Nanomaterials Market Value & Volume, 2023-2030 ($)
Figure 77 Netherlands GDP and Population, 2023-2030 ($)
Figure 78 Netherlands GDP – Composition of 2023, By Sector of Origin
Figure 79 Netherlands Export and Import Value & Volume, 2023-2030 ($)
Figure 80 Belgium Carbon Nanomaterials Market Value & Volume, 2023-2030 ($)
Figure 81 Belgium GDP and Population, 2023-2030 ($)
Figure 82 Belgium GDP – Composition of 2023, By Sector of Origin
Figure 83 Belgium Export and Import Value & Volume, 2023-2030 ($)
Figure 84 Spain Carbon Nanomaterials Market Value & Volume, 2023-2030 ($)
Figure 85 Spain GDP and Population, 2023-2030 ($)
Figure 86 Spain GDP – Composition of 2023, By Sector of Origin
Figure 87 Spain Export and Import Value & Volume, 2023-2030 ($)
Figure 88 Denmark Carbon Nanomaterials Market Value & Volume, 2023-2030 ($)
Figure 89 Denmark GDP and Population, 2023-2030 ($)
Figure 90 Denmark GDP – Composition of 2023, By Sector of Origin
Figure 91 Denmark Export and Import Value & Volume, 2023-2030 ($)
Figure 92 APAC Carbon Nanomaterials Market Value & Volume, 2023-2030 ($)
Figure 93 China Carbon Nanomaterials Market Value & Volume, 2023-2030
Figure 94 China GDP and Population, 2023-2030 ($)
Figure 95 China GDP – Composition of 2023, By Sector of Origin
Figure 96 China Export and Import Value & Volume, 2023-2030 ($)Carbon Nanomaterials Market China Export and Import Value & Volume, 2023-2030 ($)
Figure 97 Australia Carbon Nanomaterials Market Value & Volume, 2023-2030 ($)
Figure 98 Australia GDP and Population, 2023-2030 ($)
Figure 99 Australia GDP – Composition of 2023, By Sector of Origin
Figure 100 Australia Export and Import Value & Volume, 2023-2030 ($)
Figure 101 South Korea Carbon Nanomaterials Market Value & Volume, 2023-2030 ($)
Figure 102 South Korea GDP and Population, 2023-2030 ($)
Figure 103 South Korea GDP – Composition of 2023, By Sector of Origin
Figure 104 South Korea Export and Import Value & Volume, 2023-2030 ($)
Figure 105 India Carbon Nanomaterials Market Value & Volume, 2023-2030 ($)
Figure 106 India GDP and Population, 2023-2030 ($)
Figure 107 India GDP – Composition of 2023, By Sector of Origin
Figure 108 India Export and Import Value & Volume, 2023-2030 ($)
Figure 109 Taiwan Carbon Nanomaterials Market Value & Volume, 2023-2030 ($)
Figure 110 Taiwan GDP and Population, 2023-2030 ($)
Figure 111 Taiwan GDP – Composition of 2023, By Sector of Origin
Figure 112 Taiwan Export and Import Value & Volume, 2023-2030 ($)
Figure 113 Malaysia Carbon Nanomaterials Market Value & Volume, 2023-2030 ($)
Figure 114 Malaysia GDP and Population, 2023-2030 ($)
Figure 115 Malaysia GDP – Composition of 2023, By Sector of Origin
Figure 116 Malaysia Export and Import Value & Volume, 2023-2030 ($)
Figure 117 Hong Kong Carbon Nanomaterials Market Value & Volume, 2023-2030 ($)
Figure 118 Hong Kong GDP and Population, 2023-2030 ($)
Figure 119 Hong Kong GDP – Composition of 2023, By Sector of Origin
Figure 120 Hong Kong Export and Import Value & Volume, 2023-2030 ($)
Figure 121 Middle East & Africa Carbon Nanomaterials Market Middle East & Africa 3D Printing Market Value & Volume, 2023-2030 ($)
Figure 122 Russia Carbon Nanomaterials Market Value & Volume, 2023-2030 ($)
Figure 123 Russia GDP and Population, 2023-2030 ($)
Figure 124 Russia GDP – Composition of 2023, By Sector of Origin
Figure 125 Russia Export and Import Value & Volume, 2023-2030 ($)
Figure 126 Israel Carbon Nanomaterials Market Value & Volume, 2023-2030 ($)
Figure 127 Israel GDP and Population, 2023-2030 ($)
Figure 128 Israel GDP – Composition of 2023, By Sector of Origin
Figure 129 Israel Export and Import Value & Volume, 2023-2030 ($)
Figure 130 Entropy Share, By Strategies, 2023-2030* (%)Carbon Nanomaterials Market
Figure 131 Developments, 2023-2030*Carbon Nanomaterials Market
Figure 132 Company 1 Carbon Nanomaterials Market Net Revenue, By Years, 2023-2030* ($)
Figure 133 Company 1 Carbon Nanomaterials Market Net Revenue Share, By Business segments, 2023 (%)
Figure 134 Company 1 Carbon Nanomaterials Market Net Sales Share, By Geography, 2023 (%)
Figure 135 Company 2 Carbon Nanomaterials Market Net Revenue, By Years, 2023-2030* ($)
Figure 136 Company 2 Carbon Nanomaterials Market Net Revenue Share, By Business segments, 2023 (%)
Figure 137 Company 2 Carbon Nanomaterials Market Net Sales Share, By Geography, 2023 (%)
Figure 138 Company 3 Carbon Nanomaterials Market Net Revenue, By Years, 2023-2030* ($)
Figure 139 Company 3 Carbon Nanomaterials Market Net Revenue Share, By Business segments, 2023 (%)
Figure 140 Company 3 Carbon Nanomaterials Market Net Sales Share, By Geography, 2023 (%)
Figure 141 Company 4 Carbon Nanomaterials Market Net Revenue, By Years, 2023-2030* ($)
Figure 142 Company 4 Carbon Nanomaterials Market Net Revenue Share, By Business segments, 2023 (%)
Figure 143 Company 4 Carbon Nanomaterials Market Net Sales Share, By Geography, 2023 (%)
Figure 144 Company 5 Carbon Nanomaterials Market Net Revenue, By Years, 2023-2030* ($)
Figure 145 Company 5 Carbon Nanomaterials Market Net Revenue Share, By Business segments, 2023 (%)
Figure 146 Company 5 Carbon Nanomaterials Market Net Sales Share, By Geography, 2023 (%)
Figure 147 Company 6 Carbon Nanomaterials Market Net Revenue, By Years, 2023-2030* ($)
Figure 148 Company 6 Carbon Nanomaterials Market Net Revenue Share, By Business segments, 2023 (%)
Figure 149 Company 6 Carbon Nanomaterials Market Net Sales Share, By Geography, 2023 (%)
Figure 150 Company 7 Carbon Nanomaterials Market Net Revenue, By Years, 2023-2030* ($)
Figure 151 Company 7 Carbon Nanomaterials Market Net Revenue Share, By Business segments, 2023 (%)
Figure 152 Company 7 Carbon Nanomaterials Market Net Sales Share, By Geography, 2023 (%)
Figure 153 Company 8 Carbon Nanomaterials Market Net Revenue, By Years, 2023-2030* ($)
Figure 154 Company 8 Carbon Nanomaterials Market Net Revenue Share, By Business segments, 2023 (%)
Figure 155 Company 8 Carbon Nanomaterials Market Net Sales Share, By Geography, 2023 (%)
Figure 156 Company 9 Carbon Nanomaterials Market Net Revenue, By Years, 2023-2030* ($)
Figure 157 Company 9 Carbon Nanomaterials Market Net Revenue Share, By Business segments, 2023 (%)
Figure 158 Company 9 Carbon Nanomaterials Market Net Sales Share, By Geography, 2023 (%)
Figure 159 Company 10 Carbon Nanomaterials Market Net Revenue, By Years, 2023-2030* ($)
Figure 160 Company 10 Carbon Nanomaterials Market Net Revenue Share, By Business segments, 2023 (%)
Figure 161 Company 10 Carbon Nanomaterials Market Net Sales Share, By Geography, 2023 (%)
Figure 162 Company 11 Carbon Nanomaterials Market Net Revenue, By Years, 2023-2030* ($)
Figure 163 Company 11 Carbon Nanomaterials Market Net Revenue Share, By Business segments, 2023 (%)
Figure 164 Company 11 Carbon Nanomaterials Market Net Sales Share, By Geography, 2023 (%)
Figure 165 Company 12 Carbon Nanomaterials Market Net Revenue, By Years, 2023-2030* ($)
Figure 166 Company 12 Carbon Nanomaterials Market Net Revenue Share, By Business segments, 2023 (%)
Figure 167 Company 12 Carbon Nanomaterials Market Net Sales Share, By Geography, 2023 (%)
Figure 168 Company 13 Carbon Nanomaterials Market Net Revenue, By Years, 2023-2030* ($)
Figure 169 Company 13 Carbon Nanomaterials Market Net Revenue Share, By Business segments, 2023 (%)
Figure 170 Company 13 Carbon Nanomaterials Market Net Sales Share, By Geography, 2023 (%)
Figure 171 Company 14 Carbon Nanomaterials Market Net Revenue, By Years, 2023-2030* ($)
Figure 172 Company 14 Carbon Nanomaterials Market Net Revenue Share, By Business segments, 2023 (%)
Figure 173 Company 14 Carbon Nanomaterials Market Net Sales Share, By Geography, 2023 (%)
Figure 174 Company 15 Carbon Nanomaterials Market Net Revenue, By Years, 2023-2030* ($)
Figure 175 Company 15 Carbon Nanomaterials Market Net Revenue Share, By Business segments, 2023 (%)
Figure 176 Company 15 Carbon Nanomaterials Market Net Sales Share, By Geography, 2023 (%)