 Email
Email Print
Print


Home Infusion Therapy Market - Forecast(2025 - 2031)
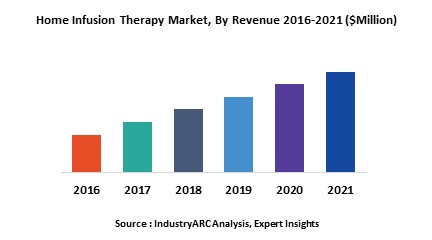
The benefit of cost containment when compared to in-patient treatment is one of the major factors driving the growth of the home infusion therapy market. Technological advances are also another factor impacting the home infusion therapy market. Wireless infusion pumps with remote programmability ensure that healthcare professionals can closely monitor their patients. Innovations in products and initiatives to increase safety levels of home infusion therapy are also bolstering the demand for this market. Increasing incidences of chronic disorders and hospital-acquired diseases are making people opt for home infusion therapies. The world is witnessing a significant increase in geriatric population, especially in developed nations and this is expected to further the home infusion therapy market.
The Home Infusion Therapy Market can be segmented as
- on the basis of product
- Infusion pumps, intravenous sets, needleless connectors, IV cannulas, and Others
- Infusion pumps have been further segmented into
- Enteral infusion pump, Volumetric infusion pump, Insulin infusion pump, Patient-controlled analgesia (PCA) infusion pump, Syringe infusion pump, Ambulatory infusion pump, and Implantable infusion pump
- In terms of applications
- Chemotherapy, Specialty Pharmaceuticals, Pain Management, Enteral Nutrition, Parenteral Nutrition, Hydration Therapy, Anti-infective and Others
While all regions are expected to exhibit a healthy double digit growth rate, North America accounts for the largest share of the market and Asia Pacific is expected to witness the highest growth rate till the end of the forecast period considered in this report. Japan has the largest geriatric population in the Asia Pacific region and in countries like India and China; the healthcare infrastructure is currently undergoing significant development.
- By Geography
- North America, South America, APAC, Europe, Middle East and Africa
There are a limited number of players in this market, but it is still highly competitive with companies focusing on new product launches regularly.
- Smith’s Medical
- CareFusion Corporation
- Baxter, Inc.,
- Caesarea Medical Electronics
- ICU Medical Inc.
Key Market Players:
The Top 5 companies in the Home Infusion Therapy Market are:
1 Baxter
2. Fresenius Kabi AG
3. Medline Industries
4 ICU Medical, inc.
5 Smiths Group
List of Tables:
Table 1 Home Infusion Therapy Market Overview 2023-2030
Table 2 Home Infusion Therapy Market Leader Analysis 2023-2030 (US$)
Table 3 Home Infusion Therapy Market Product Analysis 2023-2030 (US$)
Table 4 Home Infusion Therapy Market End User Analysis 2023-2030 (US$)
Table 5 Home Infusion Therapy Market Patent Analysis 2013-2023* (US$)
Table 6 Home Infusion Therapy Market Financial Analysis 2023-2030 (US$)
Table 7 Home Infusion Therapy Market Driver Analysis 2023-2030 (US$)
Table 8 Home Infusion Therapy Market Challenges Analysis 2023-2030 (US$)
Table 9 Home Infusion Therapy Market Constraint Analysis 2023-2030 (US$)
Table 10 Home Infusion Therapy Market Supplier Bargaining Power Analysis 2023-2030 (US$)
Table 11 Home Infusion Therapy Market Buyer Bargaining Power Analysis 2023-2030 (US$)
Table 12 Home Infusion Therapy Market Threat of Substitutes Analysis 2023-2030 (US$)
Table 13 Home Infusion Therapy Market Threat of New Entrants Analysis 2023-2030 (US$)
Table 14 Home Infusion Therapy Market Degree of Competition Analysis 2023-2030 (US$)
Table 15 Home Infusion Therapy Market Value Chain Analysis 2023-2030 (US$)
Table 16 Home Infusion Therapy Market Pricing Analysis 2023-2030 (US$)
Table 17 Home Infusion Therapy Market Opportunities Analysis 2023-2030 (US$)
Table 18 Home Infusion Therapy Market Product Life Cycle Analysis 2023-2030 (US$)
Table 19 Home Infusion Therapy Market Supplier Analysis 2023-2030 (US$)
Table 20 Home Infusion Therapy Market Distributor Analysis 2023-2030 (US$)
Table 21 Home Infusion Therapy Market Trend Analysis 2023-2030 (US$)
Table 22 Home Infusion Therapy Market Size 2023 (US$)
Table 23 Home Infusion Therapy Market Forecast Analysis 2023-2030 (US$)
Table 24 Home Infusion Therapy Market Sales Forecast Analysis 2023-2030 (Units)
Table 25 Home Infusion Therapy Market, Revenue & Volume, By Product, 2023-2030 ($)
Table 26 Home Infusion Therapy Market By Product, Revenue & Volume, By Infusion Pumps, 2023-2030 ($)
Table 27 Home Infusion Therapy Market By Product, Revenue & Volume, By Intravenous Sets, 2023-2030 ($)
Table 28 Home Infusion Therapy Market By Product, Revenue & Volume, By IV Cannulas, 2023-2030 ($)
Table 29 Home Infusion Therapy Market By Product, Revenue & Volume, By Needleless Connectors, 2023-2030 ($)
Table 30 Home Infusion Therapy Market By Product, Revenue & Volume, By Others, 2023-2030 ($)
Table 31 Home Infusion Therapy Market, Revenue & Volume, By Application, 2023-2030 ($)
Table 32 Home Infusion Therapy Market By Application, Revenue & Volume, By Chemotherapy, 2023-2030 ($)
Table 33 Home Infusion Therapy Market By Application, Revenue & Volume, By Hydration Therapy, 2023-2030 ($)
Table 34 Home Infusion Therapy Market By Application, Revenue & Volume, By Anti-infective, 2023-2030 ($)
Table 35 Home Infusion Therapy Market By Application, Revenue & Volume, By Enteral Nutrition, 2023-2030 ($)
Table 36 Home Infusion Therapy Market By Application, Revenue & Volume, By Parenteral Nutrition, 2023-2030 ($)
Table 37 North America Home Infusion Therapy Market, Revenue & Volume, By Product, 2023-2030 ($)
Table 38 North America Home Infusion Therapy Market, Revenue & Volume, By Application, 2023-2030 ($)
Table 39 South america Home Infusion Therapy Market, Revenue & Volume, By Product, 2023-2030 ($)
Table 40 South america Home Infusion Therapy Market, Revenue & Volume, By Application, 2023-2030 ($)
Table 41 Europe Home Infusion Therapy Market, Revenue & Volume, By Product, 2023-2030 ($)
Table 42 Europe Home Infusion Therapy Market, Revenue & Volume, By Application, 2023-2030 ($)
Table 43 APAC Home Infusion Therapy Market, Revenue & Volume, By Product, 2023-2030 ($)
Table 44 APAC Home Infusion Therapy Market, Revenue & Volume, By Application, 2023-2030 ($)
Table 45 Middle East & Africa Home Infusion Therapy Market, Revenue & Volume, By Product, 2023-2030 ($)
Table 46 Middle East & Africa Home Infusion Therapy Market, Revenue & Volume, By Application, 2023-2030 ($)
Table 47 Russia Home Infusion Therapy Market, Revenue & Volume, By Product, 2023-2030 ($)
Table 48 Russia Home Infusion Therapy Market, Revenue & Volume, By Application, 2023-2030 ($)
Table 49 Israel Home Infusion Therapy Market, Revenue & Volume, By Product, 2023-2030 ($)
Table 50 Israel Home Infusion Therapy Market, Revenue & Volume, By Application, 2023-2030 ($)
Table 51 Top Companies 2023 (US$)Home Infusion Therapy Market, Revenue & Volume
Table 52 Product Launch 2023-2030Home Infusion Therapy Market, Revenue & Volume
Table 53 Mergers & Acquistions 2023-2030Home Infusion Therapy Market, Revenue & Volume
List of Figures:
Figure 1 Overview of Home Infusion Therapy Market 2023-2030
Figure 2 Market Share Analysis for Home Infusion Therapy Market 2023 (US$)
Figure 3 Product Comparison in Home Infusion Therapy Market 2023-2030 (US$)
Figure 4 End User Profile for Home Infusion Therapy Market 2023-2030 (US$)
Figure 5 Patent Application and Grant in Home Infusion Therapy Market 2013-2023* (US$)
Figure 6 Top 5 Companies Financial Analysis in Home Infusion Therapy Market 2023-2030 (US$)
Figure 7 Market Entry Strategy in Home Infusion Therapy Market 2023-2030
Figure 8 Ecosystem Analysis in Home Infusion Therapy Market 2023
Figure 9 Average Selling Price in Home Infusion Therapy Market 2023-2030
Figure 10 Top Opportunites in Home Infusion Therapy Market 2023-2030
Figure 11 Market Life Cycle Analysis in Home Infusion Therapy Market
Figure 12 GlobalBy ProductHome Infusion Therapy Market Revenue, 2023-2030 ($)
Figure 13 GlobalBy ApplicationHome Infusion Therapy Market Revenue, 2023-2030 ($)
Figure 14 Global Home Infusion Therapy Market - By Geography
Figure 15 Global Home Infusion Therapy Market Value & Volume, By Geography, 2023-2030 ($)
Figure 16 Global Home Infusion Therapy Market CAGR, By Geography, 2023-2030 (%)
Figure 17 North America Home Infusion Therapy Market Value & Volume, 2023-2030 ($)
Figure 18 US Home Infusion Therapy Market Value & Volume, 2023-2030 ($)
Figure 19 US GDP and Population, 2023-2030 ($)
Figure 20 US GDP – Composition of 2023, By Sector of Origin
Figure 21 US Export and Import Value & Volume, 2023-2030 ($)
Figure 22 Canada Home Infusion Therapy Market Value & Volume, 2023-2030 ($)
Figure 23 Canada GDP and Population, 2023-2030 ($)
Figure 24 Canada GDP – Composition of 2023, By Sector of Origin
Figure 25 Canada Export and Import Value & Volume, 2023-2030 ($)
Figure 26 Mexico Home Infusion Therapy Market Value & Volume, 2023-2030 ($)
Figure 27 Mexico GDP and Population, 2023-2030 ($)
Figure 28 Mexico GDP – Composition of 2023, By Sector of Origin
Figure 29 Mexico Export and Import Value & Volume, 2023-2030 ($)
Figure 30 South America Home Infusion Therapy Market Value & Volume, 2023-2030 ($)
Figure 31 Brazil Home Infusion Therapy Market Value & Volume, 2023-2030 ($)
Figure 32 Brazil GDP and Population, 2023-2030 ($)
Figure 33 Brazil GDP – Composition of 2023, By Sector of Origin
Figure 34 Brazil Export and Import Value & Volume, 2023-2030 ($)
Figure 35 Venezuela Home Infusion Therapy Market Value & Volume, 2023-2030 ($)
Figure 36 Venezuela GDP and Population, 2023-2030 ($)
Figure 37 Venezuela GDP – Composition of 2023, By Sector of Origin
Figure 38 Venezuela Export and Import Value & Volume, 2023-2030 ($)
Figure 39 Argentina Home Infusion Therapy Market Value & Volume, 2023-2030 ($)
Figure 40 Argentina GDP and Population, 2023-2030 ($)
Figure 41 Argentina GDP – Composition of 2023, By Sector of Origin
Figure 42 Argentina Export and Import Value & Volume, 2023-2030 ($)
Figure 43 Ecuador Home Infusion Therapy Market Value & Volume, 2023-2030 ($)
Figure 44 Ecuador GDP and Population, 2023-2030 ($)
Figure 45 Ecuador GDP – Composition of 2023, By Sector of Origin
Figure 46 Ecuador Export and Import Value & Volume, 2023-2030 ($)
Figure 47 Peru Home Infusion Therapy Market Value & Volume, 2023-2030 ($)
Figure 48 Peru GDP and Population, 2023-2030 ($)
Figure 49 Peru GDP – Composition of 2023, By Sector of Origin
Figure 50 Peru Export and Import Value & Volume, 2023-2030 ($)
Figure 51 Colombia Home Infusion Therapy Market Value & Volume, 2023-2030 ($)
Figure 52 Colombia GDP and Population, 2023-2030 ($)
Figure 53 Colombia GDP – Composition of 2023, By Sector of Origin
Figure 54 Colombia Export and Import Value & Volume, 2023-2030 ($)
Figure 55 Costa Rica Home Infusion Therapy Market Value & Volume, 2023-2030 ($)
Figure 56 Costa Rica GDP and Population, 2023-2030 ($)
Figure 57 Costa Rica GDP – Composition of 2023, By Sector of Origin
Figure 58 Costa Rica Export and Import Value & Volume, 2023-2030 ($)
Figure 59 Europe Home Infusion Therapy Market Value & Volume, 2023-2030 ($)
Figure 60 U.K Home Infusion Therapy Market Value & Volume, 2023-2030 ($)
Figure 61 U.K GDP and Population, 2023-2030 ($)
Figure 62 U.K GDP – Composition of 2023, By Sector of Origin
Figure 63 U.K Export and Import Value & Volume, 2023-2030 ($)
Figure 64 Germany Home Infusion Therapy Market Value & Volume, 2023-2030 ($)
Figure 65 Germany GDP and Population, 2023-2030 ($)
Figure 66 Germany GDP – Composition of 2023, By Sector of Origin
Figure 67 Germany Export and Import Value & Volume, 2023-2030 ($)
Figure 68 Italy Home Infusion Therapy Market Value & Volume, 2023-2030 ($)
Figure 69 Italy GDP and Population, 2023-2030 ($)
Figure 70 Italy GDP – Composition of 2023, By Sector of Origin
Figure 71 Italy Export and Import Value & Volume, 2023-2030 ($)
Figure 72 France Home Infusion Therapy Market Value & Volume, 2023-2030 ($)
Figure 73 France GDP and Population, 2023-2030 ($)
Figure 74 France GDP – Composition of 2023, By Sector of Origin
Figure 75 France Export and Import Value & Volume, 2023-2030 ($)
Figure 76 Netherlands Home Infusion Therapy Market Value & Volume, 2023-2030 ($)
Figure 77 Netherlands GDP and Population, 2023-2030 ($)
Figure 78 Netherlands GDP – Composition of 2023, By Sector of Origin
Figure 79 Netherlands Export and Import Value & Volume, 2023-2030 ($)
Figure 80 Belgium Home Infusion Therapy Market Value & Volume, 2023-2030 ($)
Figure 81 Belgium GDP and Population, 2023-2030 ($)
Figure 82 Belgium GDP – Composition of 2023, By Sector of Origin
Figure 83 Belgium Export and Import Value & Volume, 2023-2030 ($)
Figure 84 Spain Home Infusion Therapy Market Value & Volume, 2023-2030 ($)
Figure 85 Spain GDP and Population, 2023-2030 ($)
Figure 86 Spain GDP – Composition of 2023, By Sector of Origin
Figure 87 Spain Export and Import Value & Volume, 2023-2030 ($)
Figure 88 Denmark Home Infusion Therapy Market Value & Volume, 2023-2030 ($)
Figure 89 Denmark GDP and Population, 2023-2030 ($)
Figure 90 Denmark GDP – Composition of 2023, By Sector of Origin
Figure 91 Denmark Export and Import Value & Volume, 2023-2030 ($)
Figure 92 APAC Home Infusion Therapy Market Value & Volume, 2023-2030 ($)
Figure 93 China Home Infusion Therapy Market Value & Volume, 2023-2030
Figure 94 China GDP and Population, 2023-2030 ($)
Figure 95 China GDP – Composition of 2023, By Sector of Origin
Figure 96 China Export and Import Value & Volume, 2023-2030 ($)Home Infusion Therapy Market China Export and Import Value & Volume, 2023-2030 ($)
Figure 97 Australia Home Infusion Therapy Market Value & Volume, 2023-2030 ($)
Figure 98 Australia GDP and Population, 2023-2030 ($)
Figure 99 Australia GDP – Composition of 2023, By Sector of Origin
Figure 100 Australia Export and Import Value & Volume, 2023-2030 ($)
Figure 101 South Korea Home Infusion Therapy Market Value & Volume, 2023-2030 ($)
Figure 102 South Korea GDP and Population, 2023-2030 ($)
Figure 103 South Korea GDP – Composition of 2023, By Sector of Origin
Figure 104 South Korea Export and Import Value & Volume, 2023-2030 ($)
Figure 105 India Home Infusion Therapy Market Value & Volume, 2023-2030 ($)
Figure 106 India GDP and Population, 2023-2030 ($)
Figure 107 India GDP – Composition of 2023, By Sector of Origin
Figure 108 India Export and Import Value & Volume, 2023-2030 ($)
Figure 109 Taiwan Home Infusion Therapy Market Value & Volume, 2023-2030 ($)
Figure 110 Taiwan GDP and Population, 2023-2030 ($)
Figure 111 Taiwan GDP – Composition of 2023, By Sector of Origin
Figure 112 Taiwan Export and Import Value & Volume, 2023-2030 ($)
Figure 113 Malaysia Home Infusion Therapy Market Value & Volume, 2023-2030 ($)
Figure 114 Malaysia GDP and Population, 2023-2030 ($)
Figure 115 Malaysia GDP – Composition of 2023, By Sector of Origin
Figure 116 Malaysia Export and Import Value & Volume, 2023-2030 ($)
Figure 117 Hong Kong Home Infusion Therapy Market Value & Volume, 2023-2030 ($)
Figure 118 Hong Kong GDP and Population, 2023-2030 ($)
Figure 119 Hong Kong GDP – Composition of 2023, By Sector of Origin
Figure 120 Hong Kong Export and Import Value & Volume, 2023-2030 ($)
Figure 121 Middle East & Africa Home Infusion Therapy Market Middle East & Africa 3D Printing Market Value & Volume, 2023-2030 ($)
Figure 122 Russia Home Infusion Therapy Market Value & Volume, 2023-2030 ($)
Figure 123 Russia GDP and Population, 2023-2030 ($)
Figure 124 Russia GDP – Composition of 2023, By Sector of Origin
Figure 125 Russia Export and Import Value & Volume, 2023-2030 ($)
Figure 126 Israel Home Infusion Therapy Market Value & Volume, 2023-2030 ($)
Figure 127 Israel GDP and Population, 2023-2030 ($)
Figure 128 Israel GDP – Composition of 2023, By Sector of Origin
Figure 129 Israel Export and Import Value & Volume, 2023-2030 ($)
Figure 130 Entropy Share, By Strategies, 2023-2030* (%)Home Infusion Therapy Market
Figure 131 Developments, 2023-2030*Home Infusion Therapy Market
Figure 132 Company 1 Home Infusion Therapy Market Net Revenue, By Years, 2023-2030* ($)
Figure 133 Company 1 Home Infusion Therapy Market Net Revenue Share, By Business segments, 2023 (%)
Figure 134 Company 1 Home Infusion Therapy Market Net Sales Share, By Geography, 2023 (%)
Figure 135 Company 2 Home Infusion Therapy Market Net Revenue, By Years, 2023-2030* ($)
Figure 136 Company 2 Home Infusion Therapy Market Net Revenue Share, By Business segments, 2023 (%)
Figure 137 Company 2 Home Infusion Therapy Market Net Sales Share, By Geography, 2023 (%)
Figure 138 Company 3 Home Infusion Therapy Market Net Revenue, By Years, 2023-2030* ($)
Figure 139 Company 3 Home Infusion Therapy Market Net Revenue Share, By Business segments, 2023 (%)
Figure 140 Company 3 Home Infusion Therapy Market Net Sales Share, By Geography, 2023 (%)
Figure 141 Company 4 Home Infusion Therapy Market Net Revenue, By Years, 2023-2030* ($)
Figure 142 Company 4 Home Infusion Therapy Market Net Revenue Share, By Business segments, 2023 (%)
Figure 143 Company 4 Home Infusion Therapy Market Net Sales Share, By Geography, 2023 (%)
Figure 144 Company 5 Home Infusion Therapy Market Net Revenue, By Years, 2023-2030* ($)
Figure 145 Company 5 Home Infusion Therapy Market Net Revenue Share, By Business segments, 2023 (%)
Figure 146 Company 5 Home Infusion Therapy Market Net Sales Share, By Geography, 2023 (%)
Figure 147 Company 6 Home Infusion Therapy Market Net Revenue, By Years, 2023-2030* ($)
Figure 148 Company 6 Home Infusion Therapy Market Net Revenue Share, By Business segments, 2023 (%)
Figure 149 Company 6 Home Infusion Therapy Market Net Sales Share, By Geography, 2023 (%)
Figure 150 Company 7 Home Infusion Therapy Market Net Revenue, By Years, 2023-2030* ($)
Figure 151 Company 7 Home Infusion Therapy Market Net Revenue Share, By Business segments, 2023 (%)
Figure 152 Company 7 Home Infusion Therapy Market Net Sales Share, By Geography, 2023 (%)
Figure 153 Company 8 Home Infusion Therapy Market Net Revenue, By Years, 2023-2030* ($)
Figure 154 Company 8 Home Infusion Therapy Market Net Revenue Share, By Business segments, 2023 (%)
Figure 155 Company 8 Home Infusion Therapy Market Net Sales Share, By Geography, 2023 (%)
Figure 156 Company 9 Home Infusion Therapy Market Net Revenue, By Years, 2023-2030* ($)
Figure 157 Company 9 Home Infusion Therapy Market Net Revenue Share, By Business segments, 2023 (%)
Figure 158 Company 9 Home Infusion Therapy Market Net Sales Share, By Geography, 2023 (%)
Figure 159 Company 10 Home Infusion Therapy Market Net Revenue, By Years, 2023-2030* ($)
Figure 160 Company 10 Home Infusion Therapy Market Net Revenue Share, By Business segments, 2023 (%)
Figure 161 Company 10 Home Infusion Therapy Market Net Sales Share, By Geography, 2023 (%)
Figure 162 Company 11 Home Infusion Therapy Market Net Revenue, By Years, 2023-2030* ($)
Figure 163 Company 11 Home Infusion Therapy Market Net Revenue Share, By Business segments, 2023 (%)
Figure 164 Company 11 Home Infusion Therapy Market Net Sales Share, By Geography, 2023 (%)
Figure 165 Company 12 Home Infusion Therapy Market Net Revenue, By Years, 2023-2030* ($)
Figure 166 Company 12 Home Infusion Therapy Market Net Revenue Share, By Business segments, 2023 (%)
Figure 167 Company 12 Home Infusion Therapy Market Net Sales Share, By Geography, 2023 (%)
Figure 168 Company 13 Home Infusion Therapy Market Net Revenue, By Years, 2023-2030* ($)
Figure 169 Company 13 Home Infusion Therapy Market Net Revenue Share, By Business segments, 2023 (%)
Figure 170 Company 13 Home Infusion Therapy Market Net Sales Share, By Geography, 2023 (%)
Figure 171 Company 14 Home Infusion Therapy Market Net Revenue, By Years, 2023-2030* ($)
Figure 172 Company 14 Home Infusion Therapy Market Net Revenue Share, By Business segments, 2023 (%)
Figure 173 Company 14 Home Infusion Therapy Market Net Sales Share, By Geography, 2023 (%)
Figure 174 Company 15 Home Infusion Therapy Market Net Revenue, By Years, 2023-2030* ($)
Figure 175 Company 15 Home Infusion Therapy Market Net Revenue Share, By Business segments, 2023 (%)
Figure 176 Company 15 Home Infusion Therapy Market Net Sales Share, By Geography, 2023 (%)