 Email
Email Print
Print


In the olden days, i.e., before the development of intraocular lenses (IOLs), people had to wear special contact lenses or very thick eyeglasses to be able to see after a cataract surgery, since no device was implanted in the eye to replace the focusing power of the natural lens. With the development of intraocular lens, several types of IOL implants are available to help people enjoy improved vision. Intraocular lenses (IOL) are medical devices that are implanted in the eye in order to treat cataracts or myopia. It replaces the eye's natural lens when it is removed during cataract surgery. Most IOLs are made of a foldable and flexible material that focuses the light coming into the eye through the cornea and pupil onto the retina, the sensitive tissue at the back of the eye that relays images through the optic nerve to the brain.
Globally, growing aging population and lowering costs of cataract surgeries are drivers of intraocular lenses market. However, the high cost of advanced IOL’s is the key restraint for the intraocular lens market. This report identifies the global Intraocular Lens Market size in for the year 2014-2016, and forecast of the same for year 2021. It also highlights the potential growth opportunities in the coming years, while also reviewing the market drivers, restraints, growth indicators, challenges, market dynamics, competitive landscape, and other key aspects with respect to Intraocular Lens Market.
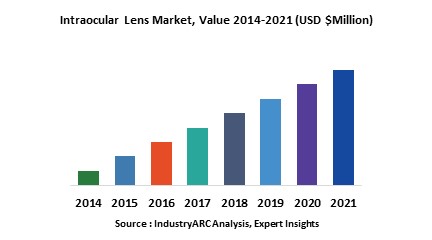
Geographically Asia Pacific dominated global Intraocular Lens Market, and is projected to have fastest growth followed by North America, Europe and Rest of the World (RoW).
This report segments global Intraocular Lens market By Lens Type, By Material, By Type of Implantation, By Optics Shape and By Geography as follows:
This report identifies all the major companies operating in the Intraocular Lens market. Some of the major companies’ profiles in detail are as follows:
Globally, growing aging population and lowering costs of cataract surgeries are drivers of intraocular lenses market. However, the high cost of advanced IOL’s is the key restraint for the intraocular lens market. This report identifies the global Intraocular Lens Market size in for the year 2014-2016, and forecast of the same for year 2021. It also highlights the potential growth opportunities in the coming years, while also reviewing the market drivers, restraints, growth indicators, challenges, market dynamics, competitive landscape, and other key aspects with respect to Intraocular Lens Market.
Geographically Asia Pacific dominated global Intraocular Lens Market, and is projected to have fastest growth followed by North America, Europe and Rest of the World (RoW).
This report segments global Intraocular Lens market By Lens Type, By Material, By Type of Implantation, By Optics Shape and By Geography as follows:
- Intraocular Lens Market, By Lens Type: Monofocal Lens, Toric Lens, Multifocal Lens and Others
- Intraocular Lens Market, By Material: PMMA, Silicone, Collamer and Others
- Intraocular Lens Market, By Type of Implantations: Injectable, Non-Injectable
- Intraocular Lens Market, By Optics Shape: Biconvex, Plano-convex and Meniscus
- This report has been further segmented into major regions, which includes detailed analysis of each region such as: North America, Europe, Asia-Pacific (APAC), and Rest of the World (RoW) covering all the major country level markets in each of the region.
This report identifies all the major companies operating in the Intraocular Lens market. Some of the major companies’ profiles in detail are as follows:
- Rayner Intraocular Lenses Limited
- Bausch & Lomb Incorporated
- Carl Zeiss Meditec AG
- Abbott Medical Optics, Inc.
- STAAR Surgical Company
1. Intraocular Lens – Market Overview
2. Executive Summary
3. Intraocular Lens Market Landscape
3.1. Market Share Analysis
3.2. Comparative Analysis
3.3. Product Benchmarking
3.4. End User Profiling
3.5. Top 5 Financials Analysis
4. Intraocular Lens – Market Forces
4.1. Drivers
4.1.1. Growing aging population
4.1.2. Lowering costs of cataract surgeries
4.2. Restraints
4.2.1. High cost of advanced IOL’s
4.3. Opportunities
4.3.1. Innovations in Toric Intraocular Lens
4.4. Challenges
4.4.1. Safety concerns in regards to cataract surgical medical devices and lenses
4.5. Porter’s Five Forces Analysis
4.5.1. Bargaining Power of Suppliers
4.5.2. Bargaining Power of Buyers
4.5.3. Threat of New Entrants
4.5.4. Threat of Substitutes
4.5.5. Degree of Competition
5. Intraocular Lens Market, By Lens Type
5.1. Monofocal Lens
5.2. Toric Lens
5.3. Multifocal Lens and
5.4. Others
6. Intraocular Lens Market, By Material
6.1. Polymethyl Methacrylate (PMMA)
6.2. Silicone
6.3. Collamer and
6.4. Others
7. Intraocular Lens Market, By Type of Implantation
7.1. Injectable
7.2. Non-Injectable
8. Intraocular Lens Market, By Optics Shape
8.1. Biconvex
8.2. Plano-convex and
8.3. Meniscus
9. Global Intraocular Lens Market, By Geography
9.1. Europe
9.1.1. Germany
9.1.2. France
9.1.3. Italy
9.1.4. Spain
9.1.5. Russia
9.1.6. U.K.
9.1.7. Rest of Europe
9.2. Asia Pacific
9.2.1. China
9.2.2. India
9.2.3. Japan
9.2.4. South Korea
9.2.5. Rest of Asia-Pacific
9.3. North America
9.3.1. U.S.
9.3.2. Canada
9.3.3. Mexico
9.4. Rest of the World (RoW)
9.4.1. Brazil
9.4.2. Rest of RoW
10. Intraocular Lens – Market Entropy
10.1. Expansion
10.2. Technological Developments
10.3. Merger & Acquisitions, and Joint Ventures
10.4. Supply- Contract
11. Company Profiles
11.1. Alcon, Inc.
11.1.1. Introduction
11.1.2. Financials
11.1.3. Key Insights
11.1.4. Key Strategy
11.1.5. Product Portfolio
11.1.6. SWOT Analysis
11.2. Abbott Medical Optics, Inc.
11.2.1. Introduction
11.2.2. Financials
11.2.3. Key Insights
11.2.4. Key Strategy
11.2.5. Product Portfolio
11.2.6. SWOT Analysis
11.3. Bausch & Lomb Incorporated
11.3.1. Introduction
11.3.2. Financials
11.3.3. Key Insights
11.3.4. Key Strategy
11.3.5. Product Portfolio
11.3.6. SWOT Analysis
11.4. Carl Zeiss Meditec AG
11.4.1. Introduction
11.4.2. Financials
11.4.3. Key Insights
11.4.4. Key Strategy
11.4.5. Product Portfolio
11.4.6. SWOT Analysis
11.5. Rayner Intraocular Lenses Limited
11.5.1. Introduction
11.5.2. Financials
11.5.3. Key Insights
11.5.4. Key Strategy
11.5.5. Product Portfolio
11.5.6. SWOT Analysis
11.6. Eyekon Medical
11.6.1. Introduction
11.6.2. Financials
11.6.3. Key Insights
11.6.4. Key Strategy
11.6.5. Product Portfolio
11.6.6. SWOT Analysis
11.7. Lenstec
11.7.1. Introduction
11.7.2. Financials
11.7.3. Key Insights
11.7.4. Key Strategy
11.7.5. Product Portfolio
11.7.6. SWOT Analysis
11.8. HumanOptics AG
11.8.1. Introduction
11.8.2. Financials
11.8.3. Key Insights
11.8.4. Key Strategy
11.8.5. Product Portfolio
11.8.6. SWOT Analysis
11.9. STAAR Surgical Company
11.9.1. Introduction
11.9.2. Financials
11.9.3. Key Insights
11.9.4. Key Strategy
11.9.5. Product Portfolio
11.9.6. SWOT Analysis
11.10. Hoya Corporation
11.10.1. Introduction
11.10.2. Financials
11.10.3. Key Insights
11.10.4. Key Strategy
11.10.5. Product Portfolio
11.10.6. SWOT Analysis
*More than 40 Companies are profiled in this Research Report, Complete List available on Request*
"*Financials would be provided on a best efforts basis for private companies"
12. Appendix
12.1. Abbreviations
12.2. Sources
12.3. Research Methodology
12.4. Expert Insights
List of Tables:
Table 1: Intraocular Lens Market Overview 2023-2030
Table 2: Intraocular Lens Market Leader Analysis 2023-2030 (US$)
Table 3: Intraocular Lens Market Product Analysis 2023-2030 (US$)
Table 4: Intraocular Lens Market End User Analysis 2023-2030 (US$)
Table 5: Intraocular Lens Market Patent Analysis 2013-2023* (US$)
Table 6: Intraocular Lens Market Financial Analysis 2023-2030 (US$)
Table 7: Intraocular Lens Market Driver Analysis 2023-2030 (US$)
Table 8: Intraocular Lens Market Challenges Analysis 2023-2030 (US$)
Table 9: Intraocular Lens Market Constraint Analysis 2023-2030 (US$)
Table 10: Intraocular Lens Market Supplier Bargaining Power Analysis 2023-2030 (US$)
Table 11: Intraocular Lens Market Buyer Bargaining Power Analysis 2023-2030 (US$)
Table 12: Intraocular Lens Market Threat of Substitutes Analysis 2023-2030 (US$)
Table 13: Intraocular Lens Market Threat of New Entrants Analysis 2023-2030 (US$)
Table 14: Intraocular Lens Market Degree of Competition Analysis 2023-2030 (US$)
Table 15: Intraocular Lens Market Value Chain Analysis 2023-2030 (US$)
Table 16: Intraocular Lens Market Pricing Analysis 2023-2030 (US$)
Table 17: Intraocular Lens Market Opportunities Analysis 2023-2030 (US$)
Table 18: Intraocular Lens Market Product Life Cycle Analysis 2023-2030 (US$)
Table 19: Intraocular Lens Market Supplier Analysis 2023-2030 (US$)
Table 20: Intraocular Lens Market Distributor Analysis 2023-2030 (US$)
Table 21: Intraocular Lens Market Trend Analysis 2023-2030 (US$)
Table 22: Intraocular Lens Market Size 2023 (US$)
Table 23: Intraocular Lens Market Forecast Analysis 2023-2030 (US$)
Table 24: Intraocular Lens Market Sales Forecast Analysis 2023-2030 (Units)
Table 25: Intraocular Lens Market, Revenue & Volume, By Lens Type, 2023-2030 ($)
Table 26: Intraocular Lens Market By Lens Type, Revenue & Volume, By Monofocal Lens, 2023-2030 ($)
Table 27: Intraocular Lens Market By Lens Type, Revenue & Volume, By Toric Lens, 2023-2030 ($)
Table 28: Intraocular Lens Market By Lens Type, Revenue & Volume, By Multifocal Lens, 2023-2030 ($)
Table 29: Intraocular Lens Market, Revenue & Volume, By Material, 2023-2030 ($)
Table 30: Intraocular Lens Market By Material, Revenue & Volume, By Polymethyl Methacrylate (PMMA), 2023-2030 ($)
Table 31: Intraocular Lens Market By Material, Revenue & Volume, By Silicone, 2023-2030 ($)
Table 32: Intraocular Lens Market By Material, Revenue & Volume, By Collamer, 2023-2030 ($)
Table 33: Intraocular Lens Market, Revenue & Volume, By Type of Implantation, 2023-2030 ($)
Table 34: Intraocular Lens Market By Type of Implantation, Revenue & Volume, By InjecTable, 2023-2030 ($)
Table 35: Intraocular Lens Market By Type of Implantation, Revenue & Volume, By Non-InjecTable, 2023-2030 ($)
Table 36: Intraocular Lens Market, Revenue & Volume, By Optics Shape, 2023-2030 ($)
Table 37: Intraocular Lens Market By Optics Shape, Revenue & Volume, By Biconvex, 2023-2030 ($)
Table 38: Intraocular Lens Market By Optics Shape, Revenue & Volume, By Plano-convex, 2023-2030 ($)
Table 39: North America Intraocular Lens Market, Revenue & Volume, By Lens Type, 2023-2030 ($)
Table 40: North America Intraocular Lens Market, Revenue & Volume, By Material, 2023-2030 ($)
Table 41: North America Intraocular Lens Market, Revenue & Volume, By Type of Implantation, 2023-2030 ($)
Table 42: North America Intraocular Lens Market, Revenue & Volume, By Optics Shape, 2023-2030 ($)
Table 43: South america Intraocular Lens Market, Revenue & Volume, By Lens Type, 2023-2030 ($)
Table 44: South america Intraocular Lens Market, Revenue & Volume, By Material, 2023-2030 ($)
Table 45: South america Intraocular Lens Market, Revenue & Volume, By Type of Implantation, 2023-2030 ($)
Table 46: South america Intraocular Lens Market, Revenue & Volume, By Optics Shape, 2023-2030 ($)
Table 47: Europe Intraocular Lens Market, Revenue & Volume, By Lens Type, 2023-2030 ($)
Table 48: Europe Intraocular Lens Market, Revenue & Volume, By Material, 2023-2030 ($)
Table 49: Europe Intraocular Lens Market, Revenue & Volume, By Type of Implantation, 2023-2030 ($)
Table 50: Europe Intraocular Lens Market, Revenue & Volume, By Optics Shape, 2023-2030 ($)
Table 51: APAC Intraocular Lens Market, Revenue & Volume, By Lens Type, 2023-2030 ($)
Table 52: APAC Intraocular Lens Market, Revenue & Volume, By Material, 2023-2030 ($)
Table 53: APAC Intraocular Lens Market, Revenue & Volume, By Type of Implantation, 2023-2030 ($)
Table 54: APAC Intraocular Lens Market, Revenue & Volume, By Optics Shape, 2023-2030 ($)
Table 55: Middle East & Africa Intraocular Lens Market, Revenue & Volume, By Lens Type, 2023-2030 ($)
Table 56: Middle East & Africa Intraocular Lens Market, Revenue & Volume, By Material, 2023-2030 ($)
Table 57: Middle East & Africa Intraocular Lens Market, Revenue & Volume, By Type of Implantation, 2023-2030 ($)
Table 58: Middle East & Africa Intraocular Lens Market, Revenue & Volume, By Optics Shape, 2023-2030 ($)
Table 59: Russia Intraocular Lens Market, Revenue & Volume, By Lens Type, 2023-2030 ($)
Table 60: Russia Intraocular Lens Market, Revenue & Volume, By Material, 2023-2030 ($)
Table 61: Russia Intraocular Lens Market, Revenue & Volume, By Type of Implantation, 2023-2030 ($)
Table 62: Russia Intraocular Lens Market, Revenue & Volume, By Optics Shape, 2023-2030 ($)
Table 63: Israel Intraocular Lens Market, Revenue & Volume, By Lens Type, 2023-2030 ($)
Table 64: Israel Intraocular Lens Market, Revenue & Volume, By Material, 2023-2030 ($)
Table 65: Israel Intraocular Lens Market, Revenue & Volume, By Type of Implantation, 2023-2030 ($)
Table 66: Israel Intraocular Lens Market, Revenue & Volume, By Optics Shape, 2023-2030 ($)
Table 67: Top Companies 2023 (US$) Intraocular Lens Market, Revenue & Volume
Table 68: Product Launch 2023-2030 Intraocular Lens Market, Revenue & Volume
Table 69: Mergers & Acquistions 2023-2030 Intraocular Lens Market, Revenue & Volume
List of Figures:
Figure 1: Overview of Intraocular Lens Market 2023-2030
Figure 2: Market Share Analysis for Intraocular Lens Market 2023 (US$)
Figure 3: Product Comparison in Intraocular Lens Market 2023-2030 (US$)
Figure 4: End User Profile for Intraocular Lens Market 2023-2030 (US$)
Figure 5: Patent Application and Grant in Intraocular Lens Market 2013-2023* (US$)
Figure 6: Top 5 Companies Financial Analysis in Intraocular Lens Market 2023-2030 (US$)
Figure 7: Market Entry Strategy in Intraocular Lens Market 2023-2030
Figure 8: Ecosystem Analysis in Intraocular Lens Market 2023
Figure 9: Average Selling Price in Intraocular Lens Market 2023-2030
Figure 10: Top Opportunites in Intraocular Lens Market 2023-2030
Figure 11: Market Life Cycle Analysis in Intraocular Lens Market
Figure 12: GlobalBy Lens Type Intraocular Lens Market Revenue, 2023-2030 ($)
Figure 13: GlobalBy Material Intraocular Lens Market Revenue, 2023-2030 ($)
Figure 14: GlobalBy Type of Implantation Intraocular Lens Market Revenue, 2023-2030 ($)
Figure 15: GlobalBy Optics Shape Intraocular Lens Market Revenue, 2023-2030 ($)
Figure 16: Global Intraocular Lens Market - By Geography
Figure 17: Global Intraocular Lens Market Value & Volume, By Geography, 2023-2030 ($)
Figure 18: Global Intraocular Lens Market CAGR, By Geography, 2023-2030 (%)
Figure 19: North America Intraocular Lens Market Value & Volume, 2023-2030 ($)
Figure 20: US Intraocular Lens Market Value & Volume, 2023-2030 ($)
Figure 21: US GDP and Population, 2023-2030 ($)
Figure 22: US GDP – Composition of 2023, By Sector of Origin
Figure 23: US Export and Import Value & Volume, 2023-2030 ($)
Figure 24: Canada Intraocular Lens Market Value & Volume, 2023-2030 ($)
Figure 25: Canada GDP and Population, 2023-2030 ($)
Figure 26: Canada GDP – Composition of 2023, By Sector of Origin
Figure 27: Canada Export and Import Value & Volume, 2023-2030 ($)
Figure 28: Mexico Intraocular Lens Market Value & Volume, 2023-2030 ($)
Figure 29: Mexico GDP and Population, 2023-2030 ($)
Figure 30: Mexico GDP – Composition of 2023, By Sector of Origin
Figure 31: Mexico Export and Import Value & Volume, 2023-2030 ($)
Figure 32: South America Intraocular Lens Market Value & Volume, 2023-2030 ($)
Figure 33: Brazil Intraocular Lens Market Value & Volume, 2023-2030 ($)
Figure 34: Brazil GDP and Population, 2023-2030 ($)
Figure 35: Brazil GDP – Composition of 2023, By Sector of Origin
Figure 36: Brazil Export and Import Value & Volume, 2023-2030 ($)
Figure 37: Venezuela Intraocular Lens Market Value & Volume, 2023-2030 ($)
Figure 38: Venezuela GDP and Population, 2023-2030 ($)
Figure 39: Venezuela GDP – Composition of 2023, By Sector of Origin
Figure 40: Venezuela Export and Import Value & Volume, 2023-2030 ($)
Figure 41: Argentina Intraocular Lens Market Value & Volume, 2023-2030 ($)
Figure 42: Argentina GDP and Population, 2023-2030 ($)
Figure 43: Argentina GDP – Composition of 2023, By Sector of Origin
Figure 44: Argentina Export and Import Value & Volume, 2023-2030 ($)
Figure 45: Ecuador Intraocular Lens Market Value & Volume, 2023-2030 ($)
Figure 46: Ecuador GDP and Population, 2023-2030 ($)
Figure 47: Ecuador GDP – Composition of 2023, By Sector of Origin
Figure 48: Ecuador Export and Import Value & Volume, 2023-2030 ($)
Figure 49: Peru Intraocular Lens Market Value & Volume, 2023-2030 ($)
Figure 50: Peru GDP and Population, 2023-2030 ($)
Figure 51: Peru GDP – Composition of 2023, By Sector of Origin
Figure 52: Peru Export and Import Value & Volume, 2023-2030 ($)
Figure 53: Colombia Intraocular Lens Market Value & Volume, 2023-2030 ($)
Figure 54: Colombia GDP and Population, 2023-2030 ($)
Figure 55: Colombia GDP – Composition of 2023, By Sector of Origin
Figure 56: Colombia Export and Import Value & Volume, 2023-2030 ($)
Figure 57: Costa Rica Intraocular Lens Market Value & Volume, 2023-2030 ($)
Figure 58: Costa Rica GDP and Population, 2023-2030 ($)
Figure 59: Costa Rica GDP – Composition of 2023, By Sector of Origin
Figure 60: Costa Rica Export and Import Value & Volume, 2023-2030 ($)
Figure 61: Europe Intraocular Lens Market Value & Volume, 2023-2030 ($)
Figure 62: U.K Intraocular Lens Market Value & Volume, 2023-2030 ($)
Figure 63: U.K GDP and Population, 2023-2030 ($)
Figure 64: U.K GDP – Composition of 2023, By Sector of Origin
Figure 65: U.K Export and Import Value & Volume, 2023-2030 ($)
Figure 66: Germany Intraocular Lens Market Value & Volume, 2023-2030 ($)
Figure 67: Germany GDP and Population, 2023-2030 ($)
Figure 68: Germany GDP – Composition of 2023, By Sector of Origin
Figure 69: Germany Export and Import Value & Volume, 2023-2030 ($)
Figure 70: Italy Intraocular Lens Market Value & Volume, 2023-2030 ($)
Figure 71: Italy GDP and Population, 2023-2030 ($)
Figure 72: Italy GDP – Composition of 2023, By Sector of Origin
Figure 73: Italy Export and Import Value & Volume, 2023-2030 ($)
Figure 74: France Intraocular Lens Market Value & Volume, 2023-2030 ($)
Figure 75: France GDP and Population, 2023-2030 ($)
Figure 76: France GDP – Composition of 2023, By Sector of Origin
Figure 77: France Export and Import Value & Volume, 2023-2030 ($)
Figure 78: Netherlands Intraocular Lens Market Value & Volume, 2023-2030 ($)
Figure 79: Netherlands GDP and Population, 2023-2030 ($)
Figure 80: Netherlands GDP – Composition of 2023, By Sector of Origin
Figure 81: Netherlands Export and Import Value & Volume, 2023-2030 ($)
Figure 82: Belgium Intraocular Lens Market Value & Volume, 2023-2030 ($)
Figure 83: Belgium GDP and Population, 2023-2030 ($)
Figure 84: Belgium GDP – Composition of 2023, By Sector of Origin
Figure 85: Belgium Export and Import Value & Volume, 2023-2030 ($)
Figure 86: Spain Intraocular Lens Market Value & Volume, 2023-2030 ($)
Figure 87: Spain GDP and Population, 2023-2030 ($)
Figure 88: Spain GDP – Composition of 2023, By Sector of Origin
Figure 89: Spain Export and Import Value & Volume, 2023-2030 ($)
Figure 90: Denmark Intraocular Lens Market Value & Volume, 2023-2030 ($)
Figure 91: Denmark GDP and Population, 2023-2030 ($)
Figure 92: Denmark GDP – Composition of 2023, By Sector of Origin
Figure 93: Denmark Export and Import Value & Volume, 2023-2030 ($)
Figure 94: APAC Intraocular Lens Market Value & Volume, 2023-2030 ($)
Figure 95: China Intraocular Lens Market Value & Volume, 2023-2030
Figure 96: China GDP and Population, 2023-2030 ($)
Figure 97: China GDP – Composition of 2023, By Sector of Origin
Figure 98: China Export and Import Value & Volume, 2023-2030 ($) Intraocular Lens Market China Export and Import Value & Volume, 2023-2030 ($)
Figure 99: Australia Intraocular Lens Market Value & Volume, 2023-2030 ($)
Figure 100: Australia GDP and Population, 2023-2030 ($)
Figure 101: Australia GDP – Composition of 2023, By Sector of Origin
Figure 102: Australia Export and Import Value & Volume, 2023-2030 ($)
Figure 103: South Korea Intraocular Lens Market Value & Volume, 2023-2030 ($)
Figure 104: South Korea GDP and Population, 2023-2030 ($)
Figure 105: South Korea GDP – Composition of 2023, By Sector of Origin
Figure 106: South Korea Export and Import Value & Volume, 2023-2030 ($)
Figure 107: India Intraocular Lens Market Value & Volume, 2023-2030 ($)
Figure 108: India GDP and Population, 2023-2030 ($)
Figure 109: India GDP – Composition of 2023, By Sector of Origin
Figure 110: India Export and Import Value & Volume, 2023-2030 ($)
Figure 111: Taiwan Intraocular Lens Market Value & Volume, 2023-2030 ($)
Figure 112: Taiwan GDP and Population, 2023-2030 ($)
Figure 113: Taiwan GDP – Composition of 2023, By Sector of Origin
Figure 114: Taiwan Export and Import Value & Volume, 2023-2030 ($)
Figure 115: Malaysia Intraocular Lens Market Value & Volume, 2023-2030 ($)
Figure 116: Malaysia GDP and Population, 2023-2030 ($)
Figure 117: Malaysia GDP – Composition of 2023, By Sector of Origin
Figure 118: Malaysia Export and Import Value & Volume, 2023-2030 ($)
Figure 119: Hong Kong Intraocular Lens Market Value & Volume, 2023-2030 ($)
Figure 120: Hong Kong GDP and Population, 2023-2030 ($)
Figure 121: Hong Kong GDP – Composition of 2023, By Sector of Origin
Figure 122: Hong Kong Export and Import Value & Volume, 2023-2030 ($)
Figure 123: Middle East & Africa Intraocular Lens Market Middle East & Africa 3D Printing Market Value & Volume, 2023-2030 ($)
Figure 124: Russia Intraocular Lens Market Value & Volume, 2023-2030 ($)
Figure 125: Russia GDP and Population, 2023-2030 ($)
Figure 126: Russia GDP – Composition of 2023, By Sector of Origin
Figure 127: Russia Export and Import Value & Volume, 2023-2030 ($)
Figure 128: Israel Intraocular Lens Market Value & Volume, 2023-2030 ($)
Figure 129: Israel GDP and Population, 2023-2030 ($)
Figure 130: Israel GDP – Composition of 2023, By Sector of Origin
Figure 131: Israel Export and Import Value & Volume, 2023-2030 ($)
Figure 132: Entropy Share, By Strategies, 2023-2030* (%) Intraocular Lens Market
Figure 133: Developments, 2023-2030* Intraocular Lens Market
Figure 134: Company 1 Intraocular Lens Market Net Revenue, By Years, 2023-2030* ($)
Figure 135: Company 1 Intraocular Lens Market Net Revenue Share, By Business segments, 2023 (%)
Figure 136: Company 1 Intraocular Lens Market Net Sales Share, By Geography, 2023 (%)
Figure 137: Company 2 Intraocular Lens Market Net Revenue, By Years, 2023-2030* ($)
Figure 138: Company 2 Intraocular Lens Market Net Revenue Share, By Business segments, 2023 (%)
Figure 139: Company 2 Intraocular Lens Market Net Sales Share, By Geography, 2023 (%)
Figure 140: Company 3 Intraocular Lens Market Net Revenue, By Years, 2023-2030* ($)
Figure 141: Company 3 Intraocular Lens Market Net Revenue Share, By Business segments, 2023 (%)
Figure 142: Company 3 Intraocular Lens Market Net Sales Share, By Geography, 2023 (%)
Figure 143: Company 4 Intraocular Lens Market Net Revenue, By Years, 2023-2030* ($)
Figure 144: Company 4 Intraocular Lens Market Net Revenue Share, By Business segments, 2023 (%)
Figure 145: Company 4 Intraocular Lens Market Net Sales Share, By Geography, 2023 (%)
Figure 146: Company 5 Intraocular Lens Market Net Revenue, By Years, 2023-2030* ($)
Figure 147: Company 5 Intraocular Lens Market Net Revenue Share, By Business segments, 2023 (%)
Figure 148: Company 5 Intraocular Lens Market Net Sales Share, By Geography, 2023 (%)
Figure 149: Company 6 Intraocular Lens Market Net Revenue, By Years, 2023-2030* ($)
Figure 150: Company 6 Intraocular Lens Market Net Revenue Share, By Business segments, 2023 (%)
Figure 151: Company 6 Intraocular Lens Market Net Sales Share, By Geography, 2023 (%)
Figure 152: Company 7 Intraocular Lens Market Net Revenue, By Years, 2023-2030* ($)
Figure 153: Company 7 Intraocular Lens Market Net Revenue Share, By Business segments, 2023 (%)
Figure 154: Company 7 Intraocular Lens Market Net Sales Share, By Geography, 2023 (%)
Figure 155: Company 8 Intraocular Lens Market Net Revenue, By Years, 2023-2030* ($)
Figure 156: Company 8 Intraocular Lens Market Net Revenue Share, By Business segments, 2023 (%)
Figure 157: Company 8 Intraocular Lens Market Net Sales Share, By Geography, 2023 (%)
Figure 158: Company 9 Intraocular Lens Market Net Revenue, By Years, 2023-2030* ($)
Figure 159: Company 9 Intraocular Lens Market Net Revenue Share, By Business segments, 2023 (%)
Figure 160: Company 9 Intraocular Lens Market Net Sales Share, By Geography, 2023 (%)
Figure 161: Company 10 Intraocular Lens Market Net Revenue, By Years, 2023-2030* ($)
Figure 162: Company 10 Intraocular Lens Market Net Revenue Share, By Business segments, 2023 (%)
Figure 163: Company 10 Intraocular Lens Market Net Sales Share, By Geography, 2023 (%)
Figure 164: Company 11 Intraocular Lens Market Net Revenue, By Years, 2023-2030* ($)
Figure 165: Company 11 Intraocular Lens Market Net Revenue Share, By Business segments, 2023 (%)
Figure 166: Company 11 Intraocular Lens Market Net Sales Share, By Geography, 2023 (%)
Figure 167: Company 12 Intraocular Lens Market Net Revenue, By Years, 2023-2030* ($)
Figure 168: Company 12 Intraocular Lens Market Net Revenue Share, By Business segments, 2023 (%)
Figure 169: Company 12 Intraocular Lens Market Net Sales Share, By Geography, 2023 (%)
Figure 170: Company 13 Intraocular Lens Market Net Revenue, By Years, 2023-2030* ($)
Figure 171: Company 13 Intraocular Lens Market Net Revenue Share, By Business segments, 2023 (%)
Figure 172: Company 13 Intraocular Lens Market Net Sales Share, By Geography, 2023 (%)
Figure 173: Company 14 Intraocular Lens Market Net Revenue, By Years, 2023-2030* ($)
Figure 174: Company 14 Intraocular Lens Market Net Revenue Share, By Business segments, 2023 (%)
Figure 175: Company 14 Intraocular Lens Market Net Sales Share, By Geography, 2023 (%)
Figure 176: Company 15 Intraocular Lens Market Net Revenue, By Years, 2023-2030* ($)
Figure 177: Company 15 Intraocular Lens Market Net Revenue Share, By Business segments, 2023 (%)
Figure 178: Company 15 Intraocular Lens Market Net Sales Share, By Geography, 2023 (%)