 Email
Email Print
Print


Magnetic Compass Market - By Type Category Mounting Orientation - Forecast(2024 - 2030)
Magnetic Compass Market Overview
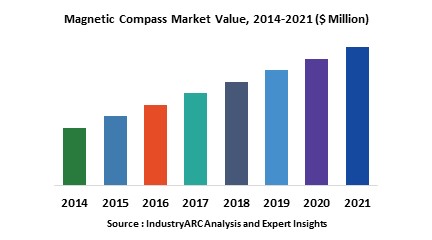
Magnetic Compass Market Size is forecast to reach $ 6205 Million by 2030, at a CAGR of 3% during forecast period 2024-2030. Magnetic compass is a navigational tool containing a magnetic needle which orients itself with the earth's magnetic field. Globally, technological advancement leading to higher consumption, rise in the demand for magnetic compass for geological survey, and increasing military expansion in Middle East & Asia are the prime growth drivers of global magnetic compass market. In addition, increase in adoption of magnetic compass for newer applications, and emerging economies such as China, India and others will create new opportunities for global magnetic compass market. However, growing counterfeit products market, and lack of efficiency in stringent and harsh working environment are the key restraints for global magnetic compass market.
This report identifies the global magnetic compass market size in for the year 2014-2016, and forecast of the same for year 2021. It also highlights the potential growth opportunities in the coming years, while also reviewing the market drivers, restraints, growth indicators, challenges, market dynamics, competitive landscape and other key aspects with respect to global magnetic compass market.
Geographically North America dominated global magnetic compass market, and Asia Pacific is projected to have fastest growth, owing to rapidly expanding military in emerging economies such as China, India, and Bangladesh in this region. Among all the end-users, aerospace segment has the highest market share in global magnetic compass market.
This report segments global magnetic compass market on the basis of type, category, mounting, orientation, output, end-user, and regional market as follows:
- Magnetic Compass Market, By Type: Fixed-Dial Compass, Floating-Dial Compass, Orienteering Compass, and Cruiser Compass
- Magnetic Compass Market, By Category: Steering Compasses, Dive Compasses, Bearing Compasses, and Tactical Compasses
- Magnetic Compass Market, By Mounting: Built-In, Binnacle-Mounted, With Mounting Bracket, and Portable
- Magnetic Compass Market, By Orientation: Horizontal, and Vertical
- Magnetic Compass Market, By Output: Analog, and Digital
- The report has focused study on magnetic compass market by basis of end-user industry such as: Aerospace, Maritime, Space Application, Military Application, Geological Survey, Leisure Activities, and Others
- This report has been further segmented into major regions, which includes detailed analysis of each region such as: North America, Europe, Asia-Pacific (APAC) and Rest of the World (RoW) covering all the major country level markets in each of the regio
Key Market Players:
The Top 5 companies in the Magnetic Compass Market are:
- Silva Sweden AB
- Suunto Oy
- Brunton, Inc.
- Cammenga & Associates, Inc.
- Ritchie Navigation
For more Automation and Instrumentation Market reports, please click here
List of Tables:
Table1: Magnetic Compass Market Overview 2023-2030
Table2: Magnetic Compass Market Leader Analysis 2023-2030 (US$)
Table3: Magnetic Compass Market Product Analysis 2023-2030 (US$)
Table4: Magnetic Compass Market End User Analysis 2023-2030 (US$)
Table5: Magnetic Compass Market Patent Analysis 2013-2023* (US$)
Table6: Magnetic Compass Market Financial Analysis 2023-2030 (US$)
Table7: Magnetic Compass Market Driver Analysis 2023-2030 (US$)
Table8: Magnetic Compass Market Challenges Analysis 2023-2030 (US$)
Table9: Magnetic Compass Market Constraint Analysis 2023-2030 (US$)
Table10: Magnetic Compass Market Supplier Bargaining Power Analysis 2023-2030 (US$)
Table11: Magnetic Compass Market Buyer Bargaining Power Analysis 2023-2030 (US$)
Table12: Magnetic Compass Market Threat of Substitutes Analysis 2023-2030 (US$)
Table13: Magnetic Compass Market Threat of New Entrants Analysis 2023-2030 (US$)
Table14: Magnetic Compass Market Degree of Competition Analysis 2023-2030 (US$)
Table15: Magnetic Compass Market Value Chain Analysis 2023-2030 (US$)
Table16: Magnetic Compass Market Pricing Analysis 2023-2030 (US$)
Table17: Magnetic Compass Market Opportunities Analysis 2023-2030 (US$)
Table18: Magnetic Compass Market Product Life Cycle Analysis 2023-2030 (US$)
Table19: Magnetic Compass Market Supplier Analysis 2023-2030 (US$)
Table20: Magnetic Compass Market Distributor Analysis 2023-2030 (US$)
Table21: Magnetic Compass Market Trend Analysis 2023-2030 (US$)
Table22: Magnetic Compass Market Size 2023 (US$)
Table23: Magnetic Compass Market Forecast Analysis 2023-2030 (US$)
Table24: Magnetic Compass Market Sales Forecast Analysis 2023-2030 (Units)
Table25: Magnetic Compass Market, Revenue & Volume, By Type, 2023-2030 ($)
Table26: Magnetic Compass Market By Type, Revenue & Volume, By Fixed-Dial Compass, 2023-2030 ($)
Table27: Magnetic Compass Market By Type, Revenue & Volume, By Floating-Dial Compass, 2023-2030 ($)
Table28: Magnetic Compass Market By Type, Revenue & Volume, By Orienteering Compass, 2023-2030 ($)
Table29: Magnetic Compass Market By Type, Revenue & Volume, By Cruiser Compass, 2023-2030 ($)
Table30: Magnetic Compass Market, Revenue & Volume, By Category, 2023-2030 ($)
Table31: Magnetic Compass Market By Category, Revenue & Volume, By Steering Compasses, 2023-2030 ($)
Table32: Magnetic Compass Market By Category, Revenue & Volume, By Dive Compasses, 2023-2030 ($)
Table33: Magnetic Compass Market By Category, Revenue & Volume, By Bearing Compasses, 2023-2030 ($)
Table34: Magnetic Compass Market By Category, Revenue & Volume, By Tactical Compasses, 2023-2030 ($)
Table35: Magnetic Compass Market, Revenue & Volume, By Mounting, 2023-2030 ($)
Table36: Magnetic Compass Market By Mounting, Revenue & Volume, By Built-In, 2023-2030 ($)
Table37: Magnetic Compass Market By Mounting, Revenue & Volume, By Binnacle-Mounted, 2023-2030 ($)
Table38: Magnetic Compass Market By Mounting, Revenue & Volume, By With Mounting Bracket, 2023-2030 ($)
Table39: Magnetic Compass Market By Mounting, Revenue & Volume, By Portable, 2023-2030 ($)
Table40: Magnetic Compass Market, Revenue & Volume, By Orientation, 2023-2030 ($)
Table41: Magnetic Compass Market By Orientation, Revenue & Volume, By Horizontal, 2023-2030 ($)
Table42: Magnetic Compass Market By Orientation, Revenue & Volume, By Vertical, 2023-2030 ($)
Table43: Magnetic Compass Market By Orientation, Revenue & Volume, By Output, 2023-2030 ($)
Table44: Magnetic Compass Market By Orientation, Revenue & Volume, By Analog, 2023-2030 ($)
Table45: Magnetic Compass Market By Orientation, Revenue & Volume, By Digital, 2023-2030 ($)
Table46: Magnetic Compass Market, Revenue & Volume, By End Use, 2023-2030 ($)
Table47: Magnetic Compass Market By End Use, Revenue & Volume, By Aerospace, 2023-2030 ($)
Table48: Magnetic Compass Market By End Use, Revenue & Volume, By Maritime, 2023-2030 ($)
Table49: Magnetic Compass Market By End Use, Revenue & Volume, By Space Application, 2023-2030 ($)
Table50: Magnetic Compass Market By End Use, Revenue & Volume, By Military Application, 2023-2030 ($)
Table51: Magnetic Compass Market By End Use, Revenue & Volume, By Geological Survey, 2023-2030 ($)
Table52: North America Magnetic Compass Market, Revenue & Volume, By Type, 2023-2030 ($)
Table53: North America Magnetic Compass Market, Revenue & Volume, By Category, 2023-2030 ($)
Table54: North America Magnetic Compass Market, Revenue & Volume, By Mounting, 2023-2030 ($)
Table55: North America Magnetic Compass Market, Revenue & Volume, By Orientation, 2023-2030 ($)
Table56: North America Magnetic Compass Market, Revenue & Volume, By End Use, 2023-2030 ($)
Table57: South america Magnetic Compass Market, Revenue & Volume, By Type, 2023-2030 ($)
Table58: South america Magnetic Compass Market, Revenue & Volume, By Category, 2023-2030 ($)
Table59: South america Magnetic Compass Market, Revenue & Volume, By Mounting, 2023-2030 ($)
Table60: South america Magnetic Compass Market, Revenue & Volume, By Orientation, 2023-2030 ($)
Table61: South america Magnetic Compass Market, Revenue & Volume, By End Use, 2023-2030 ($)
Table62: Europe Magnetic Compass Market, Revenue & Volume, By Type, 2023-2030 ($)
Table63: Europe Magnetic Compass Market, Revenue & Volume, By Category, 2023-2030 ($)
Table64: Europe Magnetic Compass Market, Revenue & Volume, By Mounting, 2023-2030 ($)
Table65: Europe Magnetic Compass Market, Revenue & Volume, By Orientation, 2023-2030 ($)
Table66: Europe Magnetic Compass Market, Revenue & Volume, By End Use, 2023-2030 ($)
Table67: APAC Magnetic Compass Market, Revenue & Volume, By Type, 2023-2030 ($)
Table68: APAC Magnetic Compass Market, Revenue & Volume, By Category, 2023-2030 ($)
Table69: APAC Magnetic Compass Market, Revenue & Volume, By Mounting, 2023-2030 ($)
Table70: APAC Magnetic Compass Market, Revenue & Volume, By Orientation, 2023-2030 ($)
Table71: APAC Magnetic Compass Market, Revenue & Volume, By End Use, 2023-2030 ($)
Table72: Middle East & Africa Magnetic Compass Market, Revenue & Volume, By Type, 2023-2030 ($)
Table73: Middle East & Africa Magnetic Compass Market, Revenue & Volume, By Category, 2023-2030 ($)
Table74: Middle East & Africa Magnetic Compass Market, Revenue & Volume, By Mounting, 2023-2030 ($)
Table75: Middle East & Africa Magnetic Compass Market, Revenue & Volume, By Orientation, 2023-2030 ($)
Table76: Middle East & Africa Magnetic Compass Market, Revenue & Volume, By End Use, 2023-2030 ($)
Table77: Russia Magnetic Compass Market, Revenue & Volume, By Type, 2023-2030 ($)
Table78: Russia Magnetic Compass Market, Revenue & Volume, By Category, 2023-2030 ($)
Table79: Russia Magnetic Compass Market, Revenue & Volume, By Mounting, 2023-2030 ($)
Table80: Russia Magnetic Compass Market, Revenue & Volume, By Orientation, 2023-2030 ($)
Table81: Russia Magnetic Compass Market, Revenue & Volume, By End Use, 2023-2030 ($)
Table82: Israel Magnetic Compass Market, Revenue & Volume, By Type, 2023-2030 ($)
Table83: Israel Magnetic Compass Market, Revenue & Volume, By Category, 2023-2030 ($)
Table84: Israel Magnetic Compass Market, Revenue & Volume, By Mounting, 2023-2030 ($)
Table85: Israel Magnetic Compass Market, Revenue & Volume, By Orientation, 2023-2030 ($)
Table86: Israel Magnetic Compass Market, Revenue & Volume, By End Use, 2023-2030 ($)
Table87: Top Companies 2023 (US$)Magnetic Compass Market, Revenue & Volume
Table88: Product Launch 2023-2030Magnetic Compass Market, Revenue & Volume
Table89: Mergers & Acquistions 2023-2030Magnetic Compass Market, Revenue & Volume
List of Figures:
Figure 1: Overview of Magnetic Compass Market 2023-2030
Figure 2: Market Share Analysis for Magnetic Compass Market 2023 (US$)
Figure 3: Product Comparison in Magnetic Compass Market 2023-2030 (US$)
Figure 4: End User Profile for Magnetic Compass Market 2023-2030 (US$)
Figure 5: Patent Application and Grant in Magnetic Compass Market 2013-2023* (US$)
Figure 6: Top 5 Companies Financial Analysis in Magnetic Compass Market 2023-2030 (US$)
Figure 7: Market Entry Strategy in Magnetic Compass Market 2023-2030
Figure 8: Ecosystem Analysis in Magnetic Compass Market 2023
Figure 9: Average Selling Price in Magnetic Compass Market 2023-2030
Figure 10: Top Opportunites in Magnetic Compass Market 2023-2030
Figure 11: Market Life Cycle Analysis in Magnetic Compass Market
Figure 12: GlobalBy TypeMagnetic Compass Market Revenue, 2023-2030 ($)
Figure 13: GlobalBy Category Magnetic Compass Market Revenue, 2023-2030 ($)
Figure 14: GlobalBy Mounting Magnetic Compass Market Revenue, 2023-2030 ($)
Figure 15: GlobalBy Orientation Magnetic Compass Market Revenue, 2023-2030 ($)
Figure 16: GlobalBy End UseMagnetic Compass Market Revenue, 2023-2030 ($)
Figure 17: Global Magnetic Compass Market - By Geography
Figure 18: Global Magnetic Compass Market Value & Volume, By Geography, 2023-2030 ($)
Figure 19: Global Magnetic Compass Market CAGR, By Geography, 2023-2030 (%)
Figure 20: North America Magnetic Compass Market Value & Volume, 2023-2030 ($)
Figure 21: US Magnetic Compass Market Value & Volume, 2023-2030 ($)
Figure 22: US GDP and Population, 2023-2030 ($)
Figure 23: US GDP – Composition of 2023, By Sector of Origin
Figure 24: US Export and Import Value & Volume, 2023-2030 ($)
Figure 25: Canada Magnetic Compass Market Value & Volume, 2023-2030 ($)
Figure 26: Canada GDP and Population, 2023-2030 ($)
Figure 27: Canada GDP – Composition of 2023, By Sector of Origin
Figure 28: Canada Export and Import Value & Volume, 2023-2030 ($)
Figure 29: Mexico Magnetic Compass Market Value & Volume, 2023-2030 ($)
Figure 30: Mexico GDP and Population, 2023-2030 ($)
Figure 31: Mexico GDP – Composition of 2023, By Sector of Origin
Figure 32: Mexico Export and Import Value & Volume, 2023-2030 ($)
Figure 33: South America Magnetic Compass Market Value & Volume, 2023-2030 ($)
Figure 34: Brazil Magnetic Compass Market Value & Volume, 2023-2030 ($)
Figure 35: Brazil GDP and Population, 2023-2030 ($)
Figure 36: Brazil GDP – Composition of 2023, By Sector of Origin
Figure 37: Brazil Export and Import Value & Volume, 2023-2030 ($)
Figure 38: Venezuela Magnetic Compass Market Value & Volume, 2023-2030 ($)
Figure 39: Venezuela GDP and Population, 2023-2030 ($)
Figure 40: Venezuela GDP – Composition of 2023, By Sector of Origin
Figure 41: Venezuela Export and Import Value & Volume, 2023-2030 ($)
Figure 42: Argentina Magnetic Compass Market Value & Volume, 2023-2030 ($)
Figure 43: Argentina GDP and Population, 2023-2030 ($)
Figure 44: Argentina GDP – Composition of 2023, By Sector of Origin
Figure 45: Argentina Export and Import Value & Volume, 2023-2030 ($)
Figure 46: Ecuador Magnetic Compass Market Value & Volume, 2023-2030 ($)
Figure 47: Ecuador GDP and Population, 2023-2030 ($)
Figure 48: Ecuador GDP – Composition of 2023, By Sector of Origin
Figure 49: Ecuador Export and Import Value & Volume, 2023-2030 ($)
Figure 50: Peru Magnetic Compass Market Value & Volume, 2023-2030 ($)
Figure 51: Peru GDP and Population, 2023-2030 ($)
Figure 52: Peru GDP – Composition of 2023, By Sector of Origin
Figure 53: Peru Export and Import Value & Volume, 2023-2030 ($)
Figure 54: Colombia Magnetic Compass Market Value & Volume, 2023-2030 ($)
Figure 55: Colombia GDP and Population, 2023-2030 ($)
Figure 56: Colombia GDP – Composition of 2023, By Sector of Origin
Figure 57: Colombia Export and Import Value & Volume, 2023-2030 ($)
Figure 58: Costa Rica Magnetic Compass Market Value & Volume, 2023-2030 ($)
Figure 59: Costa Rica GDP and Population, 2023-2030 ($)
Figure 60: Costa Rica GDP – Composition of 2023, By Sector of Origin
Figure 61: Costa Rica Export and Import Value & Volume, 2023-2030 ($)
Figure 62: Europe Magnetic Compass Market Value & Volume, 2023-2030 ($)
Figure 63: U.K Magnetic Compass Market Value & Volume, 2023-2030 ($)
Figure 64: U.K GDP and Population, 2023-2030 ($)
Figure 65: U.K GDP – Composition of 2023, By Sector of Origin
Figure 66: U.K Export and Import Value & Volume, 2023-2030 ($)
Figure 67: Germany Magnetic Compass Market Value & Volume, 2023-2030 ($)
Figure 68: Germany GDP and Population, 2023-2030 ($)
Figure 69: Germany GDP – Composition of 2023, By Sector of Origin
Figure 70: Germany Export and Import Value & Volume, 2023-2030 ($)
Figure 71: Italy Magnetic Compass Market Value & Volume, 2023-2030 ($)
Figure 72: Italy GDP and Population, 2023-2030 ($)
Figure 73: Italy GDP – Composition of 2023, By Sector of Origin
Figure 74: Italy Export and Import Value & Volume, 2023-2030 ($)
Figure 75: France Magnetic Compass Market Value & Volume, 2023-2030 ($)
Figure 76: France GDP and Population, 2023-2030 ($)
Figure 77: France GDP – Composition of 2023, By Sector of Origin
Figure 78: France Export and Import Value & Volume, 2023-2030 ($)
Figure 79: Netherlands Magnetic Compass Market Value & Volume, 2023-2030 ($)
Figure 80: Netherlands GDP and Population, 2023-2030 ($)
Figure 81: Netherlands GDP – Composition of 2023, By Sector of Origin
Figure 82: Netherlands Export and Import Value & Volume, 2023-2030 ($)
Figure 83: Belgium Magnetic Compass Market Value & Volume, 2023-2030 ($)
Figure 84: Belgium GDP and Population, 2023-2030 ($)
Figure 85: Belgium GDP – Composition of 2023, By Sector of Origin
Figure 86: Belgium Export and Import Value & Volume, 2023-2030 ($)
Figure 87: Spain Magnetic Compass Market Value & Volume, 2023-2030 ($)
Figure 88: Spain GDP and Population, 2023-2030 ($)
Figure 89: Spain GDP – Composition of 2023, By Sector of Origin
Figure 90: Spain Export and Import Value & Volume, 2023-2030 ($)
Figure 91: Denmark Magnetic Compass Market Value & Volume, 2023-2030 ($)
Figure 92: Denmark GDP and Population, 2023-2030 ($)
Figure 93: Denmark GDP – Composition of 2023, By Sector of Origin
Figure 94: Denmark Export and Import Value & Volume, 2023-2030 ($)
Figure 95: APAC Magnetic Compass Market Value & Volume, 2023-2030 ($)
Figure 96: China Magnetic Compass Market Value & Volume, 2023-2030
Figure 97: China GDP and Population, 2023-2030 ($)
Figure 98: China GDP – Composition of 2023, By Sector of Origin
Figure 99: China Export and Import Value & Volume, 2023-2030 ($)Magnetic Compass Market China Export and Import Value & Volume, 2023-2030 ($)
Figure 100: Australia Magnetic Compass Market Value & Volume, 2023-2030 ($)
Figure 101: Australia GDP and Population, 2023-2030 ($)
Figure 102: Australia GDP – Composition of 2023, By Sector of Origin
Figure 103: Australia Export and Import Value & Volume, 2023-2030 ($)
Figure 104: South Korea Magnetic Compass Market Value & Volume, 2023-2030 ($)
Figure 105: South Korea GDP and Population, 2023-2030 ($)
Figure 106: South Korea GDP – Composition of 2023, By Sector of Origin
Figure 107: South Korea Export and Import Value & Volume, 2023-2030 ($)
Figure 108: India Magnetic Compass Market Value & Volume, 2023-2030 ($)
Figure 109: India GDP and Population, 2023-2030 ($)
Figure 110: India GDP – Composition of 2023, By Sector of Origin
Figure 111: India Export and Import Value & Volume, 2023-2030 ($)
Figure 112: Taiwan Magnetic Compass Market Value & Volume, 2023-2030 ($)
Figure 113: Taiwan GDP and Population, 2023-2030 ($)
Figure 114: Taiwan GDP – Composition of 2023, By Sector of Origin
Figure 115: Taiwan Export and Import Value & Volume, 2023-2030 ($)
Figure 116: Malaysia Magnetic Compass Market Value & Volume, 2023-2030 ($)
Figure 117: Malaysia GDP and Population, 2023-2030 ($)
Figure 118: Malaysia GDP – Composition of 2023, By Sector of Origin
Figure 119: Malaysia Export and Import Value & Volume, 2023-2030 ($)
Figure 120: Hong Kong Magnetic Compass Market Value & Volume, 2023-2030 ($)
Figure 121: Hong Kong GDP and Population, 2023-2030 ($)
Figure 122: Hong Kong GDP – Composition of 2023, By Sector of Origin
Figure 123: Hong Kong Export and Import Value & Volume, 2023-2030 ($)
Figure 124: Middle East & Africa Magnetic Compass Market Middle East & Africa 3D Printing Market Value & Volume, 2023-2030 ($)
Figure 125: Russia Magnetic Compass Market Value & Volume, 2023-2030 ($)
Figure 126: Russia GDP and Population, 2023-2030 ($)
Figure 127: Russia GDP – Composition of 2023, By Sector of Origin
Figure 128: Russia Export and Import Value & Volume, 2023-2030 ($)
Figure 129: Israel Magnetic Compass Market Value & Volume, 2023-2030 ($)
Figure 130: Israel GDP and Population, 2023-2030 ($)
Figure 131: Israel GDP – Composition of 2023, By Sector of Origin
Figure 132: Israel Export and Import Value & Volume, 2023-2030 ($)
Figure 133: Entropy Share, By Strategies, 2023-2030* (%)Magnetic Compass Market
Figure 134: Developments, 2023-2030*Magnetic Compass Market
Figure 135: Company 1 Magnetic Compass Market Net Revenue, By Years, 2023-2030* ($)
Figure 136: Company 1 Magnetic Compass Market Net Revenue Share, By Business segments, 2023 (%)
Figure 137: Company 1 Magnetic Compass Market Net Sales Share, By Geography, 2023 (%)
Figure 138: Company 2 Magnetic Compass Market Net Revenue, By Years, 2023-2030* ($)
Figure 139: Company 2 Magnetic Compass Market Net Revenue Share, By Business segments, 2023 (%)
Figure 140: Company 2 Magnetic Compass Market Net Sales Share, By Geography, 2023 (%)
Figure 141: Company 3 Magnetic Compass Market Net Revenue, By Years, 2023-2030* ($)
Figure 142: Company 3 Magnetic Compass Market Net Revenue Share, By Business segments, 2023 (%)
Figure 143: Company 3 Magnetic Compass Market Net Sales Share, By Geography, 2023 (%)
Figure 144: Company 4 Magnetic Compass Market Net Revenue, By Years, 2023-2030* ($)
Figure 145: Company 4 Magnetic Compass Market Net Revenue Share, By Business segments, 2023 (%)
Figure 146: Company 4 Magnetic Compass Market Net Sales Share, By Geography, 2023 (%)
Figure 147: Company 5 Magnetic Compass Market Net Revenue, By Years, 2023-2030* ($)
Figure 148: Company 5 Magnetic Compass Market Net Revenue Share, By Business segments, 2023 (%)
Figure 149: Company 5 Magnetic Compass Market Net Sales Share, By Geography, 2023 (%)
Figure 150: Company 6 Magnetic Compass Market Net Revenue, By Years, 2023-2030* ($)
Figure 151: Company 6 Magnetic Compass Market Net Revenue Share, By Business segments, 2023 (%)
Figure 152: Company 6 Magnetic Compass Market Net Sales Share, By Geography, 2023 (%)
Figure 153: Company 7 Magnetic Compass Market Net Revenue, By Years, 2023-2030* ($)
Figure 154: Company 7 Magnetic Compass Market Net Revenue Share, By Business segments, 2023 (%)
Figure 155: Company 7 Magnetic Compass Market Net Sales Share, By Geography, 2023 (%)
Figure 156: Company 8 Magnetic Compass Market Net Revenue, By Years, 2023-2030* ($)
Figure 157: Company 8 Magnetic Compass Market Net Revenue Share, By Business segments, 2023 (%)
Figure 158: Company 8 Magnetic Compass Market Net Sales Share, By Geography, 2023 (%)
Figure 159: Company 9 Magnetic Compass Market Net Revenue, By Years, 2023-2030* ($)
Figure 160: Company 9 Magnetic Compass Market Net Revenue Share, By Business segments, 2023 (%)
Figure 161: Company 9 Magnetic Compass Market Net Sales Share, By Geography, 2023 (%)
Figure 162: Company 10 Magnetic Compass Market Net Revenue, By Years, 2023-2030* ($)
Figure 163: Company 10 Magnetic Compass Market Net Revenue Share, By Business segments, 2023 (%)
Figure 164: Company 10 Magnetic Compass Market Net Sales Share, By Geography, 2023 (%)
Figure 165: Company 11 Magnetic Compass Market Net Revenue, By Years, 2023-2030* ($)
Figure 166: Company 11 Magnetic Compass Market Net Revenue Share, By Business segments, 2023 (%)
Figure 167: Company 11 Magnetic Compass Market Net Sales Share, By Geography, 2023 (%)
Figure 168: Company 12 Magnetic Compass Market Net Revenue, By Years, 2023-2030* ($)
Figure 169: Company 12 Magnetic Compass Market Net Revenue Share, By Business segments, 2023 (%)
Figure 170: Company 12 Magnetic Compass Market Net Sales Share, By Geography, 2023 (%)
Figure 171: Company 13 Magnetic Compass Market Net Revenue, By Years, 2023-2030* ($)
Figure 172: Company 13 Magnetic Compass Market Net Revenue Share, By Business segments, 2023 (%)
Figure 173: Company 13 Magnetic Compass Market Net Sales Share, By Geography, 2023 (%)
Figure 174: Company 14 Magnetic Compass Market Net Revenue, By Years, 2023-2030* ($)
Figure 175: Company 14 Magnetic Compass Market Net Revenue Share, By Business segments, 2023 (%)
Figure 176: Company 14 Magnetic Compass Market Net Sales Share, By Geography, 2023 (%)
Figure 177: Company 15 Magnetic Compass Market Net Revenue, By Years, 2023-2030* ($)
Figure 178: Company 15 Magnetic Compass Market Net Revenue Share, By Business segments, 2023 (%)
Figure 179: Company 15 Magnetic Compass Market Net Sales Share, By Geography, 2023 (%)