 Email
Email Print
Print


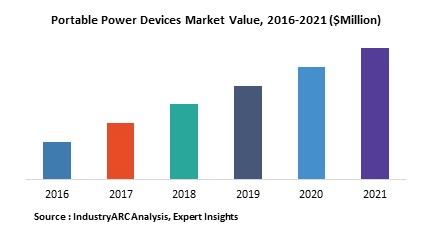
Portable Power Devices Market - Forecast(2025 - 2031)
However, in spite of all these advancements, the usage of these consumer electronic devices is high especially with everything now being “connected”. What this translates to is that even if the device is not being used, by the user, there will still be a power drain by virtue of the device being connected to the net. With battery drain imminent, it is still not always possible for individuals to have their devise powered at a power socket all the time. In such scenarios, portable power devices have been introduced into the market wherein power is already stored in these devices and they can be used to power any other device whenever required. The power retention of the portable power devices will have to be high since these devices are often purchased to completely charge a consumer electronic device, such as a smartphone or tablet.
As of 2015, the APAC market accounts for the highest share of portable power devices and this is expected to be the scenario till the end of the forecast period. A key reason for this is that the number of consumer electronic devices in the region is the highest and hence the demand for portable power devices is the highest in terms of sheer volume.
- on the basis of product
- Smartphone, Tablet, Portable Devices and Others
- In terms of technology
- Li-ion, Nickel Metal Hydride, Li-Polymer, and Nickel Cadmium
- By Geography
- North America, South America, APAC, Europe, Middle East and Africa
- Altair Nanomaterials
- Angstrom Power
- Asahi Glass
- Ballard
- BASF
- Ceramic Fuel Cells
Key Market Players:
The Top 5 companies in Portable Power Devices Market are:
- RAVPower
- Anker Innovations
- Xiaomi Corp.
- Samsung
- EcoFlow
14.9.Anker Innovations
14.10.Xiaomi Corp.
14.11.Samsung
14.12.EcoFlow
List of Tables:
Table 1: Portable Power Devices Market Overview 2023-2030
Table 2: Portable Power Devices Market Leader Analysis 2023-2030 (US$)
Table 3: Portable Power Devices Market Product Analysis 2023-2030 (US$)
Table 4: Portable Power Devices Market End User Analysis 2023-2030 (US$)
Table 5: Portable Power Devices Market Patent Analysis 2013-2023* (US$)
Table 6: Portable Power Devices Market Financial Analysis 2023-2030 (US$)
Table 7: Portable Power Devices Market Driver Analysis 2023-2030 (US$)
Table 8: Portable Power Devices Market Challenges Analysis 2023-2030 (US$)
Table 9: Portable Power Devices Market Constraint Analysis 2023-2030 (US$)
Table 10: Portable Power Devices Market Supplier Bargaining Power Analysis 2023-2030 (US$)
Table 11: Portable Power Devices Market Buyer Bargaining Power Analysis 2023-2030 (US$)
Table 12: Portable Power Devices Market Threat of Substitutes Analysis 2023-2030 (US$)
Table 13: Portable Power Devices Market Threat of New Entrants Analysis 2023-2030 (US$)
Table 14: Portable Power Devices Market Degree of Competition Analysis 2023-2030 (US$)
Table 15: Portable Power Devices Market Value Chain Analysis 2023-2030 (US$)
Table 16: Portable Power Devices Market Pricing Analysis 2023-2030 (US$)
Table 17: Portable Power Devices Market Opportunities Analysis 2023-2030 (US$)
Table 18: Portable Power Devices Market Product Life Cycle Analysis 2023-2030 (US$)
Table 19: Portable Power Devices Market Supplier Analysis 2023-2030 (US$)
Table 20: Portable Power Devices Market Distributor Analysis 2023-2030 (US$)
Table 21: Portable Power Devices Market Trend Analysis 2023-2030 (US$)
Table 22: Portable Power Devices Market Size 2023 (US$)
Table 23: Portable Power Devices Market Forecast Analysis 2023-2030 (US$)
Table 24: Portable Power Devices Market Sales Forecast Analysis 2023-2030 (Units)
Table 25: Portable Power Devices Market, Revenue & Volume, By Product, 2023-2030 ($)
Table 26: Portable Power Devices Market By Product, Revenue & Volume, By Smartphone, 2023-2030 ($)
Table 27: Portable Power Devices Market By Product, Revenue & Volume, By Tablet, 2023-2030 ($)
Table 28: Portable Power Devices Market By Product, Revenue & Volume, By Portable Devices, 2023-2030 ($)
Table 29: Portable Power Devices Market, Revenue & Volume, By Technology, 2023-2030 ($)
Table 30: Portable Power Devices Market By Technology, Revenue & Volume, By Li-ion, 2023-2030 ($)
Table 31: Portable Power Devices Market By Technology, Revenue & Volume, By Nickel Metal Hydride, 2023-2030 ($)
Table 32: Portable Power Devices Market By Technology, Revenue & Volume, By Li-Polymer, 2023-2030 ($)
Table 33: Portable Power Devices Market By Technology, Revenue & Volume, By Nickel Cadmium, 2023-2030 ($)
Table 34: North America Portable Power Devices Market, Revenue & Volume, By Product, 2023-2030 ($)
Table 35: North America Portable Power Devices Market, Revenue & Volume, By Technology, 2023-2030 ($)
Table 36: South america Portable Power Devices Market, Revenue & Volume, By Product, 2023-2030 ($)
Table 37: South america Portable Power Devices Market, Revenue & Volume, By Technology, 2023-2030 ($)
Table 38: Europe Portable Power Devices Market, Revenue & Volume, By Product, 2023-2030 ($)
Table 39: Europe Portable Power Devices Market, Revenue & Volume, By Technology, 2023-2030 ($)
Table 40: APAC Portable Power Devices Market, Revenue & Volume, By Product, 2023-2030 ($)
Table 41: APAC Portable Power Devices Market, Revenue & Volume, By Technology, 2023-2030 ($)
Table 42: Middle East & Africa Portable Power Devices Market, Revenue & Volume, By Product, 2023-2030 ($)
Table 43: Middle East & Africa Portable Power Devices Market, Revenue & Volume, By Technology, 2023-2030 ($)
Table 44: Russia Portable Power Devices Market, Revenue & Volume, By Product, 2023-2030 ($)
Table 45: Russia Portable Power Devices Market, Revenue & Volume, By Technology, 2023-2030 ($)
Table 46: Israel Portable Power Devices Market, Revenue & Volume, By Product, 2023-2030 ($)
Table 47: Israel Portable Power Devices Market, Revenue & Volume, By Technology, 2023-2030 ($)
Table 48: Top Companies 2023 (US$)Portable Power Devices Market, Revenue & Volume
Table 49: Product Launch 2023-2030Portable Power Devices Market, Revenue & Volume
Table 50: Mergers & Acquistions 2023-2030Portable Power Devices Market, Revenue & Volume
List of Figures:
Figure 1: Overview of Portable Power Devices Market 2023-2030
Figure 2: Market Share Analysis for Portable Power Devices Market 2023 (US$)
Figure 3: Product Comparison in Portable Power Devices Market 2023-2030 (US$)
Figure 4: End User Profile for Portable Power Devices Market 2023-2030 (US$)
Figure 5: Patent Application and Grant in Portable Power Devices Market 2013-2023* (US$)
Figure 6: Top 5 Companies Financial Analysis in Portable Power Devices Market 2023-2030 (US$)
Figure 7: Market Entry Strategy in Portable Power Devices Market 2023-2030
Figure 8: Ecosystem Analysis in Portable Power Devices Market 2023
Figure 9: Average Selling Price in Portable Power Devices Market 2023-2030
Figure 10: Top Opportunites in Portable Power Devices Market 2023-2030
Figure 11: Market Life Cycle Analysis in Portable Power Devices Market
Figure 12: GlobalBy ProductPortable Power Devices Market Revenue, 2023-2030 ($)
Figure 13: GlobalBy TechnologyPortable Power Devices Market Revenue, 2023-2030 ($)
Figure 14: Global Portable Power Devices Market - By Geography
Figure 15: Global Portable Power Devices Market Value & Volume, By Geography, 2023-2030 ($)
Figure 16: Global Portable Power Devices Market CAGR, By Geography, 2023-2030 (%)
Figure 17: North America Portable Power Devices Market Value & Volume, 2023-2030 ($)
Figure 18: US Portable Power Devices Market Value & Volume, 2023-2030 ($)
Figure 19: US GDP and Population, 2023-2030 ($)
Figure 20: US GDP – Composition of 2023, By Sector of Origin
Figure 21: US Export and Import Value & Volume, 2023-2030 ($)
Figure 22: Canada Portable Power Devices Market Value & Volume, 2023-2030 ($)
Figure 23: Canada GDP and Population, 2023-2030 ($)
Figure 24: Canada GDP – Composition of 2023, By Sector of Origin
Figure 25: Canada Export and Import Value & Volume, 2023-2030 ($)
Figure 26: Mexico Portable Power Devices Market Value & Volume, 2023-2030 ($)
Figure 27: Mexico GDP and Population, 2023-2030 ($)
Figure 28: Mexico GDP – Composition of 2023, By Sector of Origin
Figure 29: Mexico Export and Import Value & Volume, 2023-2030 ($)
Figure 30: South America Portable Power Devices Market Value & Volume, 2023-2030 ($)
Figure 31: Brazil Portable Power Devices Market Value & Volume, 2023-2030 ($)
Figure 32: Brazil GDP and Population, 2023-2030 ($)
Figure 33: Brazil GDP – Composition of 2023, By Sector of Origin
Figure 34: Brazil Export and Import Value & Volume, 2023-2030 ($)
Figure 35: Venezuela Portable Power Devices Market Value & Volume, 2023-2030 ($)
Figure 36: Venezuela GDP and Population, 2023-2030 ($)
Figure 37: Venezuela GDP – Composition of 2023, By Sector of Origin
Figure 38: Venezuela Export and Import Value & Volume, 2023-2030 ($)
Figure 39: Argentina Portable Power Devices Market Value & Volume, 2023-2030 ($)
Figure 40: Argentina GDP and Population, 2023-2030 ($)
Figure 41: Argentina GDP – Composition of 2023, By Sector of Origin
Figure 42: Argentina Export and Import Value & Volume, 2023-2030 ($)
Figure 43: Ecuador Portable Power Devices Market Value & Volume, 2023-2030 ($)
Figure 44: Ecuador GDP and Population, 2023-2030 ($)
Figure 45: Ecuador GDP – Composition of 2023, By Sector of Origin
Figure 46: Ecuador Export and Import Value & Volume, 2023-2030 ($)
Figure 47: Peru Portable Power Devices Market Value & Volume, 2023-2030 ($)
Figure 48: Peru GDP and Population, 2023-2030 ($)
Figure 49: Peru GDP – Composition of 2023, By Sector of Origin
Figure 50: Peru Export and Import Value & Volume, 2023-2030 ($)
Figure 51: Colombia Portable Power Devices Market Value & Volume, 2023-2030 ($)
Figure 52: Colombia GDP and Population, 2023-2030 ($)
Figure 53: Colombia GDP – Composition of 2023, By Sector of Origin
Figure 54: Colombia Export and Import Value & Volume, 2023-2030 ($)
Figure 55: Costa Rica Portable Power Devices Market Value & Volume, 2023-2030 ($)
Figure 56: Costa Rica GDP and Population, 2023-2030 ($)
Figure 57: Costa Rica GDP – Composition of 2023, By Sector of Origin
Figure 58: Costa Rica Export and Import Value & Volume, 2023-2030 ($)
Figure 59: Europe Portable Power Devices Market Value & Volume, 2023-2030 ($)
Figure 60: U.K Portable Power Devices Market Value & Volume, 2023-2030 ($)
Figure 61: U.K GDP and Population, 2023-2030 ($)
Figure 62: U.K GDP – Composition of 2023, By Sector of Origin
Figure 63: U.K Export and Import Value & Volume, 2023-2030 ($)
Figure 64: Germany Portable Power Devices Market Value & Volume, 2023-2030 ($)
Figure 65: Germany GDP and Population, 2023-2030 ($)
Figure 66: Germany GDP – Composition of 2023, By Sector of Origin
Figure 67: Germany Export and Import Value & Volume, 2023-2030 ($)
Figure 68: Italy Portable Power Devices Market Value & Volume, 2023-2030 ($)
Figure 69: Italy GDP and Population, 2023-2030 ($)
Figure 70: Italy GDP – Composition of 2023, By Sector of Origin
Figure 71: Italy Export and Import Value & Volume, 2023-2030 ($)
Figure 72: France Portable Power Devices Market Value & Volume, 2023-2030 ($)
Figure 73: France GDP and Population, 2023-2030 ($)
Figure 74: France GDP – Composition of 2023, By Sector of Origin
Figure 75: France Export and Import Value & Volume, 2023-2030 ($)
Figure 76: Netherlands Portable Power Devices Market Value & Volume, 2023-2030 ($)
Figure 77: Netherlands GDP and Population, 2023-2030 ($)
Figure 78: Netherlands GDP – Composition of 2023, By Sector of Origin
Figure 79: Netherlands Export and Import Value & Volume, 2023-2030 ($)
Figure 80: Belgium Portable Power Devices Market Value & Volume, 2023-2030 ($)
Figure 81: Belgium GDP and Population, 2023-2030 ($)
Figure 82: Belgium GDP – Composition of 2023, By Sector of Origin
Figure 83: Belgium Export and Import Value & Volume, 2023-2030 ($)
Figure 84: Spain Portable Power Devices Market Value & Volume, 2023-2030 ($)
Figure 85: Spain GDP and Population, 2023-2030 ($)
Figure 86: Spain GDP – Composition of 2023, By Sector of Origin
Figure 87: Spain Export and Import Value & Volume, 2023-2030 ($)
Figure 88: Denmark Portable Power Devices Market Value & Volume, 2023-2030 ($)
Figure 89: Denmark GDP and Population, 2023-2030 ($)
Figure 90: Denmark GDP – Composition of 2023, By Sector of Origin
Figure 91: Denmark Export and Import Value & Volume, 2023-2030 ($)
Figure 92: APAC Portable Power Devices Market Value & Volume, 2023-2030 ($)
Figure 93: China Portable Power Devices Market Value & Volume, 2023-2030
Figure 94: China GDP and Population, 2023-2030 ($)
Figure 95: China GDP – Composition of 2023, By Sector of Origin
Figure 96: China Export and Import Value & Volume, 2023-2030 ($)Portable Power Devices Market China Export and Import Value & Volume, 2023-2030 ($)
Figure 97: Australia Portable Power Devices Market Value & Volume, 2023-2030 ($)
Figure 98: Australia GDP and Population, 2023-2030 ($)
Figure 99: Australia GDP – Composition of 2023, By Sector of Origin
Figure 100: Australia Export and Import Value & Volume, 2023-2030 ($)
Figure 101: South Korea Portable Power Devices Market Value & Volume, 2023-2030 ($)
Figure 102: South Korea GDP and Population, 2023-2030 ($)
Figure 103: South Korea GDP – Composition of 2023, By Sector of Origin
Figure 104: South Korea Export and Import Value & Volume, 2023-2030 ($)
Figure 105: India Portable Power Devices Market Value & Volume, 2023-2030 ($)
Figure 106: India GDP and Population, 2023-2030 ($)
Figure 107: India GDP – Composition of 2023, By Sector of Origin
Figure 108: India Export and Import Value & Volume, 2023-2030 ($)
Figure 109: Taiwan Portable Power Devices Market Value & Volume, 2023-2030 ($)
Figure 110: Taiwan GDP and Population, 2023-2030 ($)
Figure 111: Taiwan GDP – Composition of 2023, By Sector of Origin
Figure 112: Taiwan Export and Import Value & Volume, 2023-2030 ($)
Figure 113: Malaysia Portable Power Devices Market Value & Volume, 2023-2030 ($)
Figure 114: Malaysia GDP and Population, 2023-2030 ($)
Figure 115: Malaysia GDP – Composition of 2023, By Sector of Origin
Figure 116: Malaysia Export and Import Value & Volume, 2023-2030 ($)
Figure 117: Hong Kong Portable Power Devices Market Value & Volume, 2023-2030 ($)
Figure 118: Hong Kong GDP and Population, 2023-2030 ($)
Figure 119: Hong Kong GDP – Composition of 2023, By Sector of Origin
Figure 120: Hong Kong Export and Import Value & Volume, 2023-2030 ($)
Figure 121: Middle East & Africa Portable Power Devices Market Middle East & Africa 3D Printing Market Value & Volume, 2023-2030 ($)
Figure 122: Russia Portable Power Devices Market Value & Volume, 2023-2030 ($)
Figure 123: Russia GDP and Population, 2023-2030 ($)
Figure 124: Russia GDP – Composition of 2023, By Sector of Origin
Figure 125: Russia Export and Import Value & Volume, 2023-2030 ($)
Figure 126: Israel Portable Power Devices Market Value & Volume, 2023-2030 ($)
Figure 127: Israel GDP and Population, 2023-2030 ($)
Figure 128: Israel GDP – Composition of 2023, By Sector of Origin
Figure 129: Israel Export and Import Value & Volume, 2023-2030 ($)
Figure 130: Entropy Share, By Strategies, 2023-2030* (%)Portable Power Devices Market
Figure 131: Developments, 2023-2030*Portable Power Devices Market
Figure 132: Company 1 Portable Power Devices Market Net Revenue, By Years, 2023-2030* ($)
Figure 133: Company 1 Portable Power Devices Market Net Revenue Share, By Business segments, 2023 (%)
Figure 134: Company 1 Portable Power Devices Market Net Sales Share, By Geography, 2023 (%)
Figure 135: Company 2 Portable Power Devices Market Net Revenue, By Years, 2023-2030* ($)
Figure 136: Company 2 Portable Power Devices Market Net Revenue Share, By Business segments, 2023 (%)
Figure 137: Company 2 Portable Power Devices Market Net Sales Share, By Geography, 2023 (%)
Figure 138: Company 3 Portable Power Devices Market Net Revenue, By Years, 2023-2030* ($)
Figure 139: Company 3 Portable Power Devices Market Net Revenue Share, By Business segments, 2023 (%)
Figure 140: Company 3 Portable Power Devices Market Net Sales Share, By Geography, 2023 (%)
Figure 141: Company 4 Portable Power Devices Market Net Revenue, By Years, 2023-2030* ($)
Figure 142: Company 4 Portable Power Devices Market Net Revenue Share, By Business segments, 2023 (%)
Figure 143: Company 4 Portable Power Devices Market Net Sales Share, By Geography, 2023 (%)
Figure 144: Company 5 Portable Power Devices Market Net Revenue, By Years, 2023-2030* ($)
Figure 145: Company 5 Portable Power Devices Market Net Revenue Share, By Business segments, 2023 (%)
Figure 146: Company 5 Portable Power Devices Market Net Sales Share, By Geography, 2023 (%)
Figure 147: Company 6 Portable Power Devices Market Net Revenue, By Years, 2023-2030* ($)
Figure 148: Company 6 Portable Power Devices Market Net Revenue Share, By Business segments, 2023 (%)
Figure 149: Company 6 Portable Power Devices Market Net Sales Share, By Geography, 2023 (%)
Figure 150: Company 7 Portable Power Devices Market Net Revenue, By Years, 2023-2030* ($)
Figure 151: Company 7 Portable Power Devices Market Net Revenue Share, By Business segments, 2023 (%)
Figure 152: Company 7 Portable Power Devices Market Net Sales Share, By Geography, 2023 (%)
Figure 153: Company 8 Portable Power Devices Market Net Revenue, By Years, 2023-2030* ($)
Figure 154: Company 8 Portable Power Devices Market Net Revenue Share, By Business segments, 2023 (%)
Figure 155: Company 8 Portable Power Devices Market Net Sales Share, By Geography, 2023 (%)
Figure 156: Company 9 Portable Power Devices Market Net Revenue, By Years, 2023-2030* ($)
Figure 157: Company 9 Portable Power Devices Market Net Revenue Share, By Business segments, 2023 (%)
Figure 158: Company 9 Portable Power Devices Market Net Sales Share, By Geography, 2023 (%)
Figure 159: Company 10 Portable Power Devices Market Net Revenue, By Years, 2023-2030* ($)
Figure 160: Company 10 Portable Power Devices Market Net Revenue Share, By Business segments, 2023 (%)
Figure 161: Company 10 Portable Power Devices Market Net Sales Share, By Geography, 2023 (%)
Figure 162: Company 11 Portable Power Devices Market Net Revenue, By Years, 2023-2030* ($)
Figure 163: Company 11 Portable Power Devices Market Net Revenue Share, By Business segments, 2023 (%)
Figure 164: Company 11 Portable Power Devices Market Net Sales Share, By Geography, 2023 (%)
Figure 165: Company 12 Portable Power Devices Market Net Revenue, By Years, 2023-2030* ($)
Figure 166: Company 12 Portable Power Devices Market Net Revenue Share, By Business segments, 2023 (%)
Figure 167: Company 12 Portable Power Devices Market Net Sales Share, By Geography, 2023 (%)
Figure 168: Company 13 Portable Power Devices Market Net Revenue, By Years, 2023-2030* ($)
Figure 169: Company 13 Portable Power Devices Market Net Revenue Share, By Business segments, 2023 (%)
Figure 170: Company 13 Portable Power Devices Market Net Sales Share, By Geography, 2023 (%)
Figure 171: Company 14 Portable Power Devices Market Net Revenue, By Years, 2023-2030* ($)
Figure 172: Company 14 Portable Power Devices Market Net Revenue Share, By Business segments, 2023 (%)
Figure 173: Company 14 Portable Power Devices Market Net Sales Share, By Geography, 2023 (%)
Figure 174: Company 15 Portable Power Devices Market Net Revenue, By Years, 2023-2030* ($)
Figure 175: Company 15 Portable Power Devices Market Net Revenue Share, By Business segments, 2023 (%)
Figure 176: Company 15 Portable Power Devices Market Net Sales Share, By Geography, 2023 (%)