 Email
Email Print
Print


Ethylenediamine Market Overview
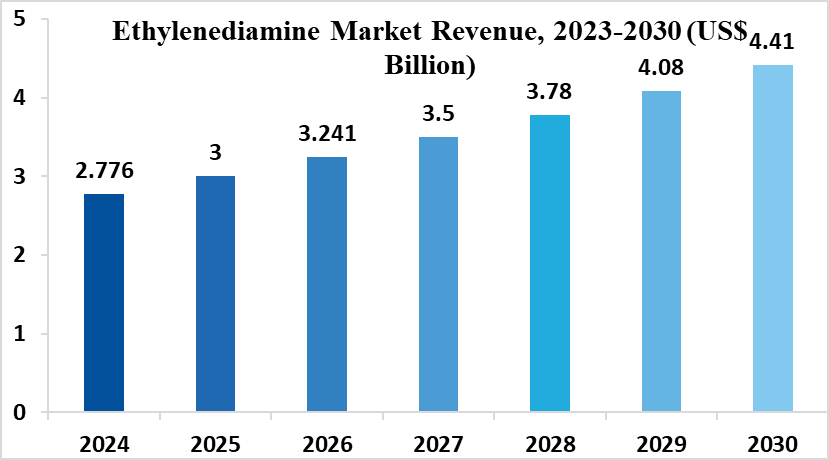
Ethylenediamine Market size is forecast to reach $4.41 billion by 2030, after growing at a CAGR of 8.05% during 2024-2030. With rise in elastomeric fibres, plastic lubricants, chelating agents, rubber processing additives, bleach activators, corrosion inhibitors, fungicides, and textile additives among others. On the other hand, bio-accumulation potential, toxicity to aquatic life, low flashpoint, and prone to catching fire are some of the hazardous factors that is hindering the growth rate of the global ethylenediamine market.
Research and development efforts are underway to explore greener production methods and identify less hazardous derivatives. Furthermore, the unique properties of ethylenediamine make it difficult to completely replace in many applications. Manufacturers are likely to focus on innovation and optimizing production processes to ensure its continued viability. Overall, the ethylenediamine market presents a complex picture. While growth is anticipated, navigating environmental concerns and competition will be crucial for its long-term success.
Ethylenediamine Market Report Coverage
The report: “Ethylenediamine Market – Forecast (2024-2030)”, by IndustryARC, covers an in-depth analysis of the following segments of the Ethylenediamine Industry.
By Type – Ethylenediamine and Heavy Ethyleneamines
By Application - Bleach Activators, Chelating Agents, Corrosion Inhibitors, Elastomeric Fibres, Fungicides, Fuel Additives and Lubricating Oils, Mineral Processing Aids, Pharmaceuticals, Plastic Lubricants, Polyamide Resins, Rubber Processing Additives, Textile Additives, Urethan e Chemicals, and Others.
By End Use – Agrochemical, Pharmaceutical, Paints and Coatings, Fuel and Energy, Mining, Textile and Apparel, and Others.
By Geography – North America, South America, Europe, APAC, and RoW.
Key Takeaways
• Asia-Pacific dominates the Ethylenediamine market owing to increasing demand from applications such as fuel additives, lubricating oils, chelating agents, corrosion inhibitors among others.
• The growing use of corrosion inhibitors, is likely to aid in the market growth of Ethylenediamine will increase the market demand for Ethylenediamine in the near future.
For More Details on This Report - Request for Sample
Ethylenediamine Market Segment Analysis - By Type
Ethylenediamine is the simplest diamine with two amino groups and is the precursor to various ethyleneamines. It is a colourless, strongly alkaline liquid with an ammonia-like odor. Ethylenediamine used in the production of various chemicals, including chelating agents, corrosion inhibitors, and fungicides. EDA is employed in the synthesis of polymers, fuel additives, and pharmaceuticals. Ethylenediamine in the preparation of epoxy resins and in the refining of edible oils.
Heavy ethyleneamines are higher homologs with longer carbon chains and multiple amine groups, offering a range of chemical functionalities. These compounds have longer carbon chains and multiple amine groups. As the molecular weight increases, the viscosity and boiling points also increase. DETA, TETA, and other heavy ethyleneamines find applications in various industries, including adhesives, coatings, fuel additives, and as curing agents for epoxy resins. Used in the production of detergents, fabric softeners, and as intermediates in the synthesis of specialty chemicals.
Ethylenediamine Market Segment Analysis - By Application
Corrosion inhibitors segment holds the largest share in the Ethylenediamine market. Ethylene diamine was evaluated as a short-term inhibitor for aluminium alloys in hydrochloric acid. At 43.5 ml/l concentration, it afforded complete protection to all the alloys in 1.0 N hydrochloric acid for up to three hours in the temperature range 35–55°c. At higher concentrations of hydrochloric acid, its efficiency was 97–99.5%. Ethylenediamine reduced the external cathodic protective current, gave cathodic protection and inhibition by lowering the potential requirements and by increasing the anodic and cathodic polarization characteristics of the metal surface. At concentrations up to 17.4 ml/l, ethylenediamine accelerated corrosion of the 2S alloy. The electrochemical behavior of steel alloy in 30% ethylene glycol‐water solution at different solution rotating speeds was investigated by polarization curves and AC impedance measurements. The results obtained showed that corrosion rate was not changed significantly in different rotating speed. The effect of ethylenediamine as inhibitor was studied and high inhibition efficiency was obtained. It was found that inhibitor adsorption was occurred in presence of inhibitor.
Ethylenediamine Market Segment Analysis - By End Use
Textile and apparel hold the largest segment for the ethylenediamine market. In textiles synthetic fiber known for its exceptional elasticity and durability. EDA (ethylenediamine) is a vital part of making the fiber strong yet flexible. It plays an important role in the fabric industry. It is widely applied in clothing, especially in the sports apparel such as swimsuit, bicycle shorts and other tight garments where flexibility and strength is needed, and also in everyday products from socks to safety belts. Nouryon Ethylene Amines is a key supplier to the textile industry with our EDA. EDA acts as a chain extender in the It manufacturing reaction and "holds" the rigid segment and soft segment in It. This enables the specific properties of – strength and durability. AEEA (aminoethylethanolamine) and DETA (diethylenetriamine) are two more products from the Ethylene Amines portfolio which we supply to the textile industry. A soft sweater or fluffy towel are made of rough cotton or chemical fibers. The fabric needs pre-treatment or after-treatment and this is where fabric softeners are applied.
Ethylenediamine Market Segment Analysis - By Geography
APAC dominated the Ethylenediamine market with a share of more than 24%, followed by North America and Europe. Countries such as China and India are the major market in this region. APAC consist a very dominant part in the world’s roadway network because of the large area it acquired. Whereas AH1 is the longest route of the Asian Highway Network, running from Tokyo, Japan via Korea, China, Southeast Asia, Bangladesh, India, Pakistan, Afghanistan and Iran to the border between Turkey and Bulgaria west of Istanbul where it joins end-on with European route E80. Roadways networks were always built because of the increase in number of vehicles and as the no. of vehicles increases the market for Ethylenediamine will also grow, owing to the increasing usage of corrosion inhibitors.
Ethylenediamine Market Drivers
Growing demand for light- weighted and efficient automobiles
In countries such as China, India, Japan are the huge market for automobiles sector. As, in these countries there is continuous growth in the automobile manufacturing sector. Because of the feature of carbon fiber to make vehicles more efficient by reducing weight, vibration, noise of the vehicles. Ethylenediamine materials boast outstanding characteristics, making them increasingly valuable in many sectors as a substitute to metal. The objective is to develop lighter, less fuel-intensive vehicles emitting less CO2. Owing to this the demand for ethylenediamine will increase.
Stringent Environment Regulations by Governments
Governments globally are focusing on giving boost to the electric and solar vehicles on road to lower down pollution. By increasing more and more eco-friendly vehicles the market for ethylenediamine will grow. For an example Tata Motors launched Hybrid and electric Starbus from manufacturing facility in Pune under its zero-emission mass transport solution. Owing to this, Governments regulations will indirectly promote the ethylenediamine market.
Ethylenediamine Market Challenges
Impact of COVID 19
The rapid spread of coronavirus has had a major impact on global markets as, major economies of the world are completely lockdown due to this pandemic. Because of this major lockdown, suddenly all the consumer market has started to show zero interest towards purchasing any goods. One of the major difficulties, market is facing are the shutdown of all kinds of International transportation. Global crisis for all sectors including shipping, which was hit by slowing demand in goods’ production and exports had slowdown the market for ethylenediamine.
Ethylenediamine Market Landscape
Technology launches, acquisitions and R&D activities are key strategies adopted by players in the Ethylenediamine market. Major players in the Ethylenediamine Market are:
1. Dow Chemical Company
2. Mitsubishi Gas Chemical Company
3. BASF SE
4. AkzoNobel N.V.
5. Arkema SA
6. Alkyl Amines Chemicals Ltd.
7. Neostar United
8. Triveni Chemicals
9. Alliance Chemicals
10. Hubei Jusheng Haihang
For more Chemicals and Materials related reports, please click here
1. Ethylenediamine Market- Market Overview
1.1 Definitions and Scope
2. Ethylenediamine Market- Executive Summary
2.1 Market Revenue, Market Size and Key Trends by Company
2.2 Key Trends by Types
2.3 Key Trends by Application
2.4 Key Trends by End-Use
2.5 Key Trends by Geography
3. Ethylenediamine Market- Landscape
3.1 Comparative analysis
3.1.1 Market Share Analysis- Top Companies
3.1.2 Product Benchmarking- Top Companies
3.1.3 Top 5 Financials Analysis
3.1.4 Patent Analysis- Top Companies
3.1.5 Pricing Analysis
4. Ethylenediamine Market - Startup companies Scenario Premium
4.1 Top startup company Analysis by
4.1.1 Investment
4.1.2 Revenue
4.1.3 Market Shares
4.1.4 Market Size and Application Analysis
4.1.5 Venture Capital and Funding Scenario
5. Ethylenediamine Market– Industry Market Entry Scenario Premium
5.1 Regulatory Framework Overview
5.2 New Business and Ease of Doing business index
5.3 Case studies of successful ventures
5.4 Customer Analysis - Top companies
6. Ethylenediamine Market- Market Forces
6.1 Market Drivers
6.2 Market Constraints
6.3 Market Opportunities
6.4 Porters five force model
6.4.1 Bargaining power of suppliers
6.4.2 Bargaining powers of customers
6.4.3 Threat of new entrants
6.4.4 Rivalry among existing players
6.4.5 Threat of substitutes
7. Ethylenediamine Market -Strategic analysis
7.1 Value chain analysis
7.2 Opportunities analysis
7.3 Market life cycle
7.4 Suppliers and distributors Analysis
8. Ethylenediamine Market– By Application (Market Size -$Million)
8.1 Bleach Activators
8.2 Chelating Agents
8.3 Corrosion Inhibitors
8.4 Elastomeric Fibres
8.5 Fungicides
8.6 Fuel Additives and Lubricating Oils
8.7 Mineral Processing Aids
8.8 Plastic Lubricants
8.9 Polyamide Resins
8.10 Rubber Processing Additives
8.11 Textile Additives
8.12 Urethane Chemicals
8.13 Others
9. Ethylenediamine Market– By End Use (Market Size -$Million)
9.1 Agrochemical
9.2 Pharmaceutical
9.3 Paints and Coatings
9.4 Fuel and Energy
9.5 Mining
9.6 Textile and Apparel
9.7 Others
10. Ethylenediamine Market - By Geography (Market Size -$Million)
10.1 North America
10.1.1 U.S.
10.1.2 Canada
10.1.3 Mexico
10.2 South America
10.2.1 Brazil
10.2.2 Argentina
10.2.3 Colombia
10.2.4 Chile
10.2.5 Rest of South America
10.3 Europe
10.3.1 U.K
10.3.2 Germany
10.3.3 Italy
10.3.4 France
10.3.5 Russia
10.3.6 Spain
10.3.7 Netherlands
10.3.8 Belgium
10.3.9 Rest of Europe
10.4 Asia Pacific
10.4.1 China
10.4.2 India
10.4.3 Japan
10.4.4 South Korea
10.4.5 Australia & New Zealand
10.4.6 Rest of Asia Pacific
10.5 RoW
10.5.1 Middle East
10.5.1.1 UAE
10.5.1.2 Saudi Arabia
10.5.1.3 Israel
10.5.1.4 Rest of Middle East
10.5.2 Africa
10.5.2.1 South Africa
10.5.2.2 Nigeria
10.5.2.3 Rest of Africa
11. Ethylenediamine Market- Entropy
11.1 New Product Launches
11.2 M&A’s, Collaborations, JVs and Partnerships
12. Market Share Analysis Premium
12.1 Market Share by Country- Top companies
12.2 Market Share by Region- Top companies
12.3 Market Share by type of Product / Product category- Top companies
12.4 Market Share at global level- Top companies
12.5 Best Practices for companies
13. Ethylenediamine Market- List of Key Companies by Country Premium
14. Ethylenediamine Market Company Analysis
14.1 Market Share, Company Revenue, Products, M&A, Developments
1. Dow Chemical Company
2. Mitsubishi Gas Chemical Company
3. BASF SE
4. AkzoNobel N.V.
5. Arkema SA
6. Alkyl Amines Chemicals Ltd.
7. Neostar United
8. Triveni Chemicals
9. Alliance Chemicals
10. Hubei Jusheng Haihang
List of Tables:
Table 1: Ethylenediamine Market Overview 2023-2030
Table 2: Ethylenediamine Market Leader Analysis 2023-2030 (US$)
Table 3: Ethylenediamine Market Product Analysis 2023-2030 (US$)
Table 4: Ethylenediamine Market End User Analysis 2023-2030 (US$)
Table 5: Ethylenediamine Market Patent Analysis 2013-2023* (US$)
Table 6: Ethylenediamine Market Financial Analysis 2023-2030 (US$)
Table 7: Ethylenediamine Market Driver Analysis 2023-2030 (US$)
Table 8: Ethylenediamine Market Challenges Analysis 2023-2030 (US$)
Table 9: Ethylenediamine Market Constraint Analysis 2023-2030 (US$)
Table 10: Ethylenediamine Market Supplier Bargaining Power Analysis 2023-2030 (US$)
Table 11: Ethylenediamine Market Buyer Bargaining Power Analysis 2023-2030 (US$)
Table 12: Ethylenediamine Market Threat of Substitutes Analysis 2023-2030 (US$)
Table 13: Ethylenediamine Market Threat of New Entrants Analysis 2023-2030 (US$)
Table 14: Ethylenediamine Market Degree of Competition Analysis 2023-2030 (US$)
Table 15: Ethylenediamine Market Value Chain Analysis 2023-2030 (US$)
Table 16: Ethylenediamine Market Pricing Analysis 2023-2030 (US$)
Table 17: Ethylenediamine Market Opportunities Analysis 2023-2030 (US$)
Table 18: Ethylenediamine Market Product Life Cycle Analysis 2023-2030 (US$)
Table 19: Ethylenediamine Market Supplier Analysis 2023-2030 (US$)
Table 20: Ethylenediamine Market Distributor Analysis 2023-2030 (US$)
Table 21: Ethylenediamine Market Trend Analysis 2023-2030 (US$)
Table 22: Ethylenediamine Market Size 2023 (US$)
Table 23: Ethylenediamine Market Forecast Analysis 2023-2030 (US$)
Table 24: Ethylenediamine Market Sales Forecast Analysis 2023-2030 (Units)
Table 25: Ethylenediamine Market, Revenue & Volume, By Application, 2023-2030 ($)
Table 26: Ethylenediamine Market By Application, Revenue & Volume, By Bleach Activators, 2023-2030 ($)
Table 27: Ethylenediamine Market By Application, Revenue & Volume, By Chelating Agent, 2023-2030 ($)
Table 28: Ethylenediamine Market By Application, Revenue & Volume, By Corrosion Inhibitors, 2023-2030 ($)
Table 29: Ethylenediamine Market By Application, Revenue & Volume, By Elastomeric Fibres, 2023-2030 ($)
Table 30: Ethylenediamine Market By Application, Revenue & Volume, By Fungicides, 2023-2030 ($)
Table 31: Ethylenediamine Market, Revenue & Volume, By End-User, 2023-2030 ($)
Table 32: Ethylenediamine Market By End-User, Revenue & Volume, By Agrochemical, 2023-2030 ($)
Table 33: Ethylenediamine Market By End-User, Revenue & Volume, By Pharmaceutical, 2023-2030 ($)
Table 34: Ethylenediamine Market By End-User, Revenue & Volume, By Paints and Coatings, 2023-2030 ($)
Table 35: Ethylenediamine Market By End-User, Revenue & Volume, By Fuel and Energy, 2023-2030 ($)
Table 36: Ethylenediamine Market By End-User, Revenue & Volume, By Mining, 2023-2030 ($)
Table 37: North America Ethylenediamine Market, Revenue & Volume, By Application, 2023-2030 ($)
Table 38: North America Ethylenediamine Market, Revenue & Volume, By End-User, 2023-2030 ($)
Table 39: South america Ethylenediamine Market, Revenue & Volume, By Application, 2023-2030 ($)
Table 40: South america Ethylenediamine Market, Revenue & Volume, By End-User, 2023-2030 ($)
Table 41: Europe Ethylenediamine Market, Revenue & Volume, By Application, 2023-2030 ($)
Table 42: Europe Ethylenediamine Market, Revenue & Volume, By End-User, 2023-2030 ($)
Table 43: APAC Ethylenediamine Market, Revenue & Volume, By Application, 2023-2030 ($)
Table 44: APAC Ethylenediamine Market, Revenue & Volume, By End-User, 2023-2030 ($)
Table 45: Middle East & Africa Ethylenediamine Market, Revenue & Volume, By Application, 2023-2030 ($)
Table 46: Middle East & Africa Ethylenediamine Market, Revenue & Volume, By End-User, 2023-2030 ($)
Table 47: Russia Ethylenediamine Market, Revenue & Volume, By Application, 2023-2030 ($)
Table 48: Russia Ethylenediamine Market, Revenue & Volume, By End-User, 2023-2030 ($)
Table 49: Israel Ethylenediamine Market, Revenue & Volume, By Application, 2023-2030 ($)
Table 50: Israel Ethylenediamine Market, Revenue & Volume, By End-User, 2023-2030 ($)
Table 51: Top Companies 2023 (US$)Ethylenediamine Market, Revenue & Volume
Table 52: Product Launch 2023-2030Ethylenediamine Market, Revenue & Volume
Table 53: Mergers & Acquistions 2023-2030Ethylenediamine Market, Revenue & Volume
List of Figures:
Figure 1: Overview of Ethylenediamine Market 2023-2030
Figure 2: Market Share Analysis for Ethylenediamine Market 2023 (US$)
Figure 3: Product Comparison in Ethylenediamine Market 2023-2030 (US$)
Figure 4: End User Profile for Ethylenediamine Market 2023-2030 (US$)
Figure 5: Patent Application and Grant in Ethylenediamine Market 2013-2023* (US$)
Figure 6: Top 5 Companies Financial Analysis in Ethylenediamine Market 2023-2030 (US$)
Figure 7: Market Entry Strategy in Ethylenediamine Market 2023-2030
Figure 8: Ecosystem Analysis in Ethylenediamine Market 2023
Figure 9: Average Selling Price in Ethylenediamine Market 2023-2030
Figure 10: Top Opportunites in Ethylenediamine Market 2023-2030
Figure 11: Market Life Cycle Analysis in Ethylenediamine Market
Figure 12: GlobalBy ApplicationEthylenediamine Market Revenue, 2023-2030 ($)
Figure 13: GlobalBy End-UserEthylenediamine Market Revenue, 2023-2030 ($)
Figure 14: Global Ethylenediamine Market - By Geography
Figure 15: Global Ethylenediamine Market Value & Volume, By Geography, 2023-2030 ($)
Figure 16: Global Ethylenediamine Market CAGR, By Geography, 2023-2030 (%)
Figure 17: North America Ethylenediamine Market Value & Volume, 2023-2030 ($)
Figure 18: US Ethylenediamine Market Value & Volume, 2023-2030 ($)
Figure 19: US GDP and Population, 2023-2030 ($)
Figure 20: US GDP – Composition of 2023, By Sector of Origin
Figure 21: US Export and Import Value & Volume, 2023-2030 ($)
Figure 22: Canada Ethylenediamine Market Value & Volume, 2023-2030 ($)
Figure 23: Canada GDP and Population, 2023-2030 ($)
Figure 24: Canada GDP – Composition of 2023, By Sector of Origin
Figure 25: Canada Export and Import Value & Volume, 2023-2030 ($)
Figure 26: Mexico Ethylenediamine Market Value & Volume, 2023-2030 ($)
Figure 27: Mexico GDP and Population, 2023-2030 ($)
Figure 28: Mexico GDP – Composition of 2023, By Sector of Origin
Figure 29: Mexico Export and Import Value & Volume, 2023-2030 ($)
Figure 30: South America Ethylenediamine Market Value & Volume, 2023-2030 ($)
Figure 31: Brazil Ethylenediamine Market Value & Volume, 2023-2030 ($)
Figure 32: Brazil GDP and Population, 2023-2030 ($)
Figure 33: Brazil GDP – Composition of 2023, By Sector of Origin
Figure 34: Brazil Export and Import Value & Volume, 2023-2030 ($)
Figure 35: Venezuela Ethylenediamine Market Value & Volume, 2023-2030 ($)
Figure 36: Venezuela GDP and Population, 2023-2030 ($)
Figure 37: Venezuela GDP – Composition of 2023, By Sector of Origin
Figure 38: Venezuela Export and Import Value & Volume, 2023-2030 ($)
Figure 39: Argentina Ethylenediamine Market Value & Volume, 2023-2030 ($)
Figure 40: Argentina GDP and Population, 2023-2030 ($)
Figure 41: Argentina GDP – Composition of 2023, By Sector of Origin
Figure 42: Argentina Export and Import Value & Volume, 2023-2030 ($)
Figure 43: Ecuador Ethylenediamine Market Value & Volume, 2023-2030 ($)
Figure 44: Ecuador GDP and Population, 2023-2030 ($)
Figure 45: Ecuador GDP – Composition of 2023, By Sector of Origin
Figure 46: Ecuador Export and Import Value & Volume, 2023-2030 ($)
Figure 47: Peru Ethylenediamine Market Value & Volume, 2023-2030 ($)
Figure 48: Peru GDP and Population, 2023-2030 ($)
Figure 49: Peru GDP – Composition of 2023, By Sector of Origin
Figure 50: Peru Export and Import Value & Volume, 2023-2030 ($)
Figure 51: Colombia Ethylenediamine Market Value & Volume, 2023-2030 ($)
Figure 52: Colombia GDP and Population, 2023-2030 ($)
Figure 53: Colombia GDP – Composition of 2023, By Sector of Origin
Figure 54: Colombia Export and Import Value & Volume, 2023-2030 ($)
Figure 55: Costa Rica Ethylenediamine Market Value & Volume, 2023-2030 ($)
Figure 56: Costa Rica GDP and Population, 2023-2030 ($)
Figure 57: Costa Rica GDP – Composition of 2023, By Sector of Origin
Figure 58: Costa Rica Export and Import Value & Volume, 2023-2030 ($)
Figure 59: Europe Ethylenediamine Market Value & Volume, 2023-2030 ($)
Figure 60: U.K Ethylenediamine Market Value & Volume, 2023-2030 ($)
Figure 61: U.K GDP and Population, 2023-2030 ($)
Figure 62: U.K GDP – Composition of 2023, By Sector of Origin
Figure 63: U.K Export and Import Value & Volume, 2023-2030 ($)
Figure 64: Germany Ethylenediamine Market Value & Volume, 2023-2030 ($)
Figure 65: Germany GDP and Population, 2023-2030 ($)
Figure 66: Germany GDP – Composition of 2023, By Sector of Origin
Figure 67: Germany Export and Import Value & Volume, 2023-2030 ($)
Figure 68: Italy Ethylenediamine Market Value & Volume, 2023-2030 ($)
Figure 69: Italy GDP and Population, 2023-2030 ($)
Figure 70: Italy GDP – Composition of 2023, By Sector of Origin
Figure 71: Italy Export and Import Value & Volume, 2023-2030 ($)
Figure 72: France Ethylenediamine Market Value & Volume, 2023-2030 ($)
Figure 73: France GDP and Population, 2023-2030 ($)
Figure 74: France GDP – Composition of 2023, By Sector of Origin
Figure 75: France Export and Import Value & Volume, 2023-2030 ($)
Figure 76: Netherlands Ethylenediamine Market Value & Volume, 2023-2030 ($)
Figure 77: Netherlands GDP and Population, 2023-2030 ($)
Figure 78: Netherlands GDP – Composition of 2023, By Sector of Origin
Figure 79: Netherlands Export and Import Value & Volume, 2023-2030 ($)
Figure 80: Belgium Ethylenediamine Market Value & Volume, 2023-2030 ($)
Figure 81: Belgium GDP and Population, 2023-2030 ($)
Figure 82: Belgium GDP – Composition of 2023, By Sector of Origin
Figure 83: Belgium Export and Import Value & Volume, 2023-2030 ($)
Figure 84: Spain Ethylenediamine Market Value & Volume, 2023-2030 ($)
Figure 85: Spain GDP and Population, 2023-2030 ($)
Figure 86: Spain GDP – Composition of 2023, By Sector of Origin
Figure 87: Spain Export and Import Value & Volume, 2023-2030 ($)
Figure 88: Denmark Ethylenediamine Market Value & Volume, 2023-2030 ($)
Figure 89: Denmark GDP and Population, 2023-2030 ($)
Figure 90: Denmark GDP – Composition of 2023, By Sector of Origin
Figure 91: Denmark Export and Import Value & Volume, 2023-2030 ($)
Figure 92: APAC Ethylenediamine Market Value & Volume, 2023-2030 ($)
Figure 93: China Ethylenediamine Market Value & Volume, 2023-2030
Figure 94: China GDP and Population, 2023-2030 ($)
Figure 95: China GDP – Composition of 2023, By Sector of Origin
Figure 96: China Export and Import Value & Volume, 2023-2030 ($)Ethylenediamine Market China Export and Import Value & Volume, 2023-2030 ($)
Figure 97: Australia Ethylenediamine Market Value & Volume, 2023-2030 ($)
Figure 98: Australia GDP and Population, 2023-2030 ($)
Figure 99: Australia GDP – Composition of 2023, By Sector of Origin
Figure 100: Australia Export and Import Value & Volume, 2023-2030 ($)
Figure 101: South Korea Ethylenediamine Market Value & Volume, 2023-2030 ($)
Figure 102: South Korea GDP and Population, 2023-2030 ($)
Figure 103: South Korea GDP – Composition of 2023, By Sector of Origin
Figure 104: South Korea Export and Import Value & Volume, 2023-2030 ($)
Figure 105: India Ethylenediamine Market Value & Volume, 2023-2030 ($)
Figure 106: India GDP and Population, 2023-2030 ($)
Figure 107: India GDP – Composition of 2023, By Sector of Origin
Figure 108: India Export and Import Value & Volume, 2023-2030 ($)
Figure 109: Taiwan Ethylenediamine Market Value & Volume, 2023-2030 ($)
Figure 110: Taiwan GDP and Population, 2023-2030 ($)
Figure 111: Taiwan GDP – Composition of 2023, By Sector of Origin
Figure 112: Taiwan Export and Import Value & Volume, 2023-2030 ($)
Figure 113: Malaysia Ethylenediamine Market Value & Volume, 2023-2030 ($)
Figure 114: Malaysia GDP and Population, 2023-2030 ($)
Figure 115: Malaysia GDP – Composition of 2023, By Sector of Origin
Figure 116: Malaysia Export and Import Value & Volume, 2023-2030 ($)
Figure 117: Hong Kong Ethylenediamine Market Value & Volume, 2023-2030 ($)
Figure 118: Hong Kong GDP and Population, 2023-2030 ($)
Figure 119: Hong Kong GDP – Composition of 2023, By Sector of Origin
Figure 120: Hong Kong Export and Import Value & Volume, 2023-2030 ($)
Figure 121: Middle East & Africa Ethylenediamine Market Middle East & Africa 3D Printing Market Value & Volume, 2023-2030 ($)
Figure 122: Russia Ethylenediamine Market Value & Volume, 2023-2030 ($)
Figure 123: Russia GDP and Population, 2023-2030 ($)
Figure 124: Russia GDP – Composition of 2023, By Sector of Origin
Figure 125: Russia Export and Import Value & Volume, 2023-2030 ($)
Figure 126: Israel Ethylenediamine Market Value & Volume, 2023-2030 ($)
Figure 127: Israel GDP and Population, 2023-2030 ($)
Figure 128: Israel GDP – Composition of 2023, By Sector of Origin
Figure 129: Israel Export and Import Value & Volume, 2023-2030 ($)
Figure 130: Entropy Share, By Strategies, 2023-2030* (%)Ethylenediamine Market
Figure 131: Developments, 2023-2030*Ethylenediamine Market
Figure 132: Company 1 Ethylenediamine Market Net Revenue, By Years, 2023-2030* ($)
Figure 133: Company 1 Ethylenediamine Market Net Revenue Share, By Business segments, 2023 (%)
Figure 134: Company 1 Ethylenediamine Market Net Sales Share, By Geography, 2023 (%)
Figure 135: Company 2 Ethylenediamine Market Net Revenue, By Years, 2023-2030* ($)
Figure 136: Company 2 Ethylenediamine Market Net Revenue Share, By Business segments, 2023 (%)
Figure 137: Company 2 Ethylenediamine Market Net Sales Share, By Geography, 2023 (%)
Figure 138: Company 3 Ethylenediamine Market Net Revenue, By Years, 2023-2030* ($)
Figure 139: Company 3 Ethylenediamine Market Net Revenue Share, By Business segments, 2023 (%)
Figure 140: Company 3 Ethylenediamine Market Net Sales Share, By Geography, 2023 (%)
Figure 141: Company 4 Ethylenediamine Market Net Revenue, By Years, 2023-2030* ($)
Figure 142: Company 4 Ethylenediamine Market Net Revenue Share, By Business segments, 2023 (%)
Figure 143: Company 4 Ethylenediamine Market Net Sales Share, By Geography, 2023 (%)
Figure 144: Company 5 Ethylenediamine Market Net Revenue, By Years, 2023-2030* ($)
Figure 145: Company 5 Ethylenediamine Market Net Revenue Share, By Business segments, 2023 (%)
Figure 146: Company 5 Ethylenediamine Market Net Sales Share, By Geography, 2023 (%)
Figure 147: Company 6 Ethylenediamine Market Net Revenue, By Years, 2023-2030* ($)
Figure 148: Company 6 Ethylenediamine Market Net Revenue Share, By Business segments, 2023 (%)
Figure 149: Company 6 Ethylenediamine Market Net Sales Share, By Geography, 2023 (%)
Figure 150: Company 7 Ethylenediamine Market Net Revenue, By Years, 2023-2030* ($)
Figure 151: Company 7 Ethylenediamine Market Net Revenue Share, By Business segments, 2023 (%)
Figure 152: Company 7 Ethylenediamine Market Net Sales Share, By Geography, 2023 (%)
Figure 153: Company 8 Ethylenediamine Market Net Revenue, By Years, 2023-2030* ($)
Figure 154: Company 8 Ethylenediamine Market Net Revenue Share, By Business segments, 2023 (%)
Figure 155: Company 8 Ethylenediamine Market Net Sales Share, By Geography, 2023 (%)
Figure 156: Company 9 Ethylenediamine Market Net Revenue, By Years, 2023-2030* ($)
Figure 157: Company 9 Ethylenediamine Market Net Revenue Share, By Business segments, 2023 (%)
Figure 158: Company 9 Ethylenediamine Market Net Sales Share, By Geography, 2023 (%)
Figure 159: Company 10 Ethylenediamine Market Net Revenue, By Years, 2023-2030* ($)
Figure 160: Company 10 Ethylenediamine Market Net Revenue Share, By Business segments, 2023 (%)
Figure 161: Company 10 Ethylenediamine Market Net Sales Share, By Geography, 2023 (%)
Figure 162: Company 11 Ethylenediamine Market Net Revenue, By Years, 2023-2030* ($)
Figure 163: Company 11 Ethylenediamine Market Net Revenue Share, By Business segments, 2023 (%)
Figure 164: Company 11 Ethylenediamine Market Net Sales Share, By Geography, 2023 (%)
Figure 165: Company 12 Ethylenediamine Market Net Revenue, By Years, 2023-2030* ($)
Figure 166: Company 12 Ethylenediamine Market Net Revenue Share, By Business segments, 2023 (%)
Figure 167: Company 12 Ethylenediamine Market Net Sales Share, By Geography, 2023 (%)
Figure 168: Company 13 Ethylenediamine Market Net Revenue, By Years, 2023-2030* ($)
Figure 169: Company 13 Ethylenediamine Market Net Revenue Share, By Business segments, 2023 (%)
Figure 170: Company 13 Ethylenediamine Market Net Sales Share, By Geography, 2023 (%)
Figure 171: Company 14 Ethylenediamine Market Net Revenue, By Years, 2023-2030* ($)
Figure 172: Company 14 Ethylenediamine Market Net Revenue Share, By Business segments, 2023 (%)
Figure 173: Company 14 Ethylenediamine Market Net Sales Share, By Geography, 2023 (%)
Figure 174: Company 15 Ethylenediamine Market Net Revenue, By Years, 2023-2030* ($)
Figure 175: Company 15 Ethylenediamine Market Net Revenue Share, By Business segments, 2023 (%)
Figure 176: Company 15 Ethylenediamine Market Net Sales Share, By Geography, 2023 (%)