 Email
Email Print
Print


Industrial Diamond Market - By Type , By Technology , By End-Use Industry , By Geography - Global Opportunity Analysis & Industry Forecast, 2024-2030
Industrial Diamond Market Overview
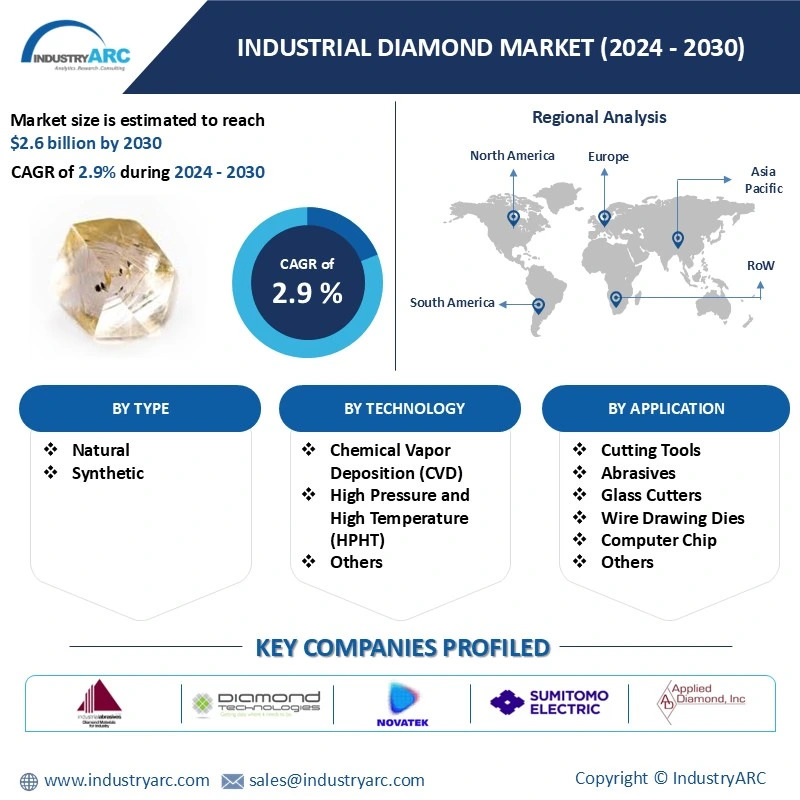
The Industrial Diamond Market size is estimated to reach US$2.6 billion by 2030 after growing at an estimated CAGR of 2.9% during the forecast period 2024-2030. Industrial diamonds are mined stones that are natural (such as carbonado, bort and others) or synthetic. Industrial diamonds have superior properties such as thermal conductivity, corrosion resistance, wear resistance and strength, which boost their demand. The flourishing application of industrial diamonds for cutting, grinding, polishing and drilling for industries such as construction, automotive, aerospace and others is creating a drive in the Industrial Diamond Market. Furthermore, nanodiamonds have major applications in bio-imaging, drug delivery and others, thereby influencing growth in the market. The flourishing construction and infrastructure projects and booming automotive production are boosting the demand for industrial diamonds. These factors offer major market opportunities in the industrial diamonds industry.
The industrial diamond sector is undergoing a transformative phase with cutting-edge manufacturing techniques. These advancements result in the production of premium synthetic diamonds tailored for diverse industrial applications. Enhanced precision and quality achieved through innovative processes position synthetic diamonds as high-performance materials, meeting the evolving demands of industries. This strategic advancement underscores the industry's commitment to delivering top-tier solutions, solidifying its pivotal role in industrial applications.
The industrial diamond industry is experiencing heightened demand in electronics, driven by the need for precision in semiconductor manufacturing. Increasingly, industrial diamonds are vital for cutting, grinding, and drilling applications, aligning with the industry's focus on technological innovation and miniaturization. As electronic components become smaller and more intricate, the reliance on industrial diamonds underscores their indispensable role in advancing semiconductor production processes with utmost precision and efficiency.
Market Snapshot:
COVID-19 Impact
The COVID-19 pandemic disrupted the growth in the market due to factors such as demand and supply gap, closure of various industries and other lockdown restrictions. However, with recovery and robust demand from major industries such as construction, automotive and others in the post-pandemic time, the Industrial Diamond Market is anticipated to grow during the forecast period.
Report Coverage
The report: “Industrial Diamond Market Report – Forecast (2024-2030)” by IndustryARC, covers an in-depth analysis of the following segments in the Industrial Diamond Industry.
By Type: Natural and Synthetic.
By Technology: Chemical Vapor Deposition (CVD), High Pressure and High Temperature (HPHT) and Others.
By Application: Cutting Tools, Abrasives, Glass Cutters, Wire Drawing Dies, Computer Chip and Others.
By End-Use Industry: Building & Construction (Commercial, Residential, Industrial and Infrastructure), Automotive (Passenger Vehicle, Light Commercial Vehicle and Heavy Commercial Vehicle), Aerospace (Commercial and military), Electrical & Electronics, Mining, Metallurgy and Others.
By Geography: North America (the USA, Canada and Mexico), Europe (the UK, Germany, France, Italy, the Netherlands, Spain, Belgium and the Rest of Europe), Asia-Pacific (China, Japan, India, South Korea, Australia and New Zealand, Indonesia, Taiwan, Malaysia and the Rest of APAC), South America (Brazil, Argentina, Colombia, Chile and the Rest of South America) and the Rest of the World [the Middle East (Saudi Arabia, the UAE, Israel and the Rest of the Middle East) and Africa (South Africa, Nigeria and the Rest of Africa)].
Key Takeaways
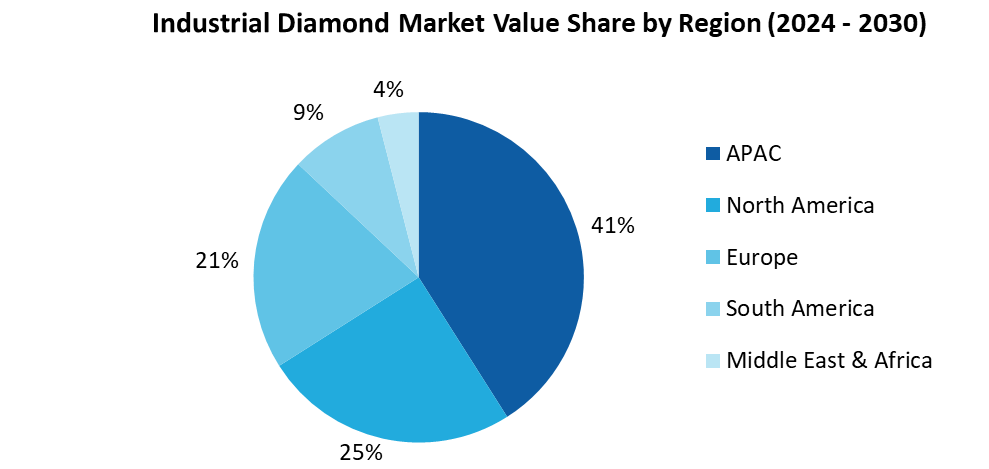
- Asia-Pacific dominates the Industrial Diamond Market, owing to the flourishing demand for industrial diamonds in the building & construction sector and an emphasis on metalworking activities in APAC. These factors continue to boost the market growth in the APAC region.
- The flourishing building & construction industry is boosting the demand for Industrial Diamonds for applications requiring cutting, drilling, blades and others. This factor would continue driving the Industrial Diamonds industry and helping the Industrial Diamond Market size grow.
- Synthetic diamonds are preferred over natural diamonds due to their superior features such as hardness, corrosion resistance, strength and better abrasive wear resistance compared to natural diamonds. Moreover, synthetic diamond offers protection from overheating, thereby having major demand in the electronics sector.
- However, the emergence of economical substitutes for Industrial Diamonds creates a major challenge in the market, thereby affecting the growth and demand for the Industrial Diamonds market.
For More Details on This Report - Request for Sample
Industrial Diamond Market Segment Analysis – by Type
The synthetic diamond segment held the largest Industrial Diamond Market share in 2023 and is expected to grow at an estimated CAGR of 3.2% during the forecast period 2024-2030. Synthetic diamonds have superior advantages over natural diamonds such as high resistance to overheating, superior abrasive, corrosion resistance, wear resistance and abundance compared to natural diamonds. Furthermore, the limited supply of natural diamonds is another factor contributing to the high demand and preferability for synthetic diamonds. The demand for synthetic diamonds is rising for their application across end-use industries, majorly in construction and electronics due to their abrasive wear resistance and over-heating bearing feature. Thus, owing to numerous advantages and abundance over natural diamonds, the demand for synthetic diamonds is growing across major industries. These factors would further boost the growth opportunities for synthetic Industrial Diamonds in the coming years.
Industrial Diamond Market Segment Analysis – by End-use Industry
The building & construction segment held a significant Industrial Diamond Market share in 2023 and is forecasted to grow at an estimated CAGR of 4.1% during the forecast period 2024-2030. The high demand for industrial diamonds such as carbonado and others in the building and construction sector is influenced by its growing application as sintered carbide for cutting, abrasive for drilling, grinding, blades and others. The building and construction sector is flourishing due to increasing investment, urbanization and the development of architectural sites & residential housing plans. For instance, according to the U.S. Census Bureau, the seasonally adjusted annual rate of construction in the United States increased from US$1,553,547 in April 2021 to US$1,744,801 in April 2022. According to Oxford Economics, the global construction output in 2020 was US$10.7 trillion and is expected to grow by 42% or US$4.5 trillion between 2020 and 2030 to reach US$15.2 trillion. With the rise in building and construction projects across the globe, the demand for industrial diamonds is anticipated to rise for various applications in cutting, grinding, abrasives and others. This would boost the market growth in the building and construction industry during the forecast period.
Industrial Diamond Market Segment Analysis – by Geography
The Asia-Pacific region held the largest Industrial Diamond Market share in 2023 and is forecasted to grow at an estimated CAGR of 4.8% during the forecast period 2024-2024. The increasing demand and growth of industrial diamonds in this region are influenced by flourishing demand from major industries such as construction, automotive and others, along with a significant number of manufacturing activities across APAC. The building and construction sector is growing rapidly in Asia-Pacific due to a major development in infrastructural projects, emphasis on affordable housing units and modular building technologies. The Make in India campaign by the Government of India plans to achieve infrastructural investment worth US$965.5 million by the year 2040. According to the International Trade Administration, the construction sector in China is projected to grow at an average of 8.6% from the year 2022 to 2030. With the robust growth of the building and construction industry in Asia-Pacific, the demand for industrial diamond tools for application in cutting, grinding, drilling and others in construction would rise. With the high growth of industrial gases in construction applications, it is anticipated that the demand for the Industrial Diamond industry would also flourish during the forecast period.
Industrial Diamond Market Drivers
Bolstering Growth of the Automotive Industry:
Industrial Diamonds such as natural, which consist of carbonado, ballas and bort, and synthetic diamonds have major demand in the automotive sector for various applications in the engine blocks, cylinder heads and other cutting applicability in vehicles. The automotive sector is rapidly growing due to factors such as the high demand for passenger vehicles among the middle class, urbanization and flourishing growth in fuel-efficient vehicle technologies. According to a report from India Energy Storage Alliance, the EV market in India is expected to increase at an estimated CAGR of 36% until 2026. Furthermore, the National Automobile Dealers Association (NADA) anticipates that the new light-vehicle sales in 2022 will show an increase of 3.4% compared to 2020. With the increase in automotive vehicle production and growth prospects, the demand for industrial diamonds is rising for applicability in engine blocks, cutting, machinery and others. With flourishing demand in the automotive sector, the Industrial Diamond industry is growing rapidly.
Rising Demand from the Electrical & Electronics Industry:
Industrial Diamonds and nanodiamonds have growing applications in the electrical & electronics industry as synthetic diamonds have applicability in semiconductor devices, computer chips, radio frequency (RF) devices and others. The electronics industry is growing rapidly owing to the high demand for electrical devices and consumer electronics such as smartphones, TV, PC and others in the work-from-home scenario. According to the India Brand Equity Foundation (IBEF), the electronics manufacturing industry in India is projected to reach US$520 billion by the year 2025. According to the Semiconductor Industry Association (SIA), global semiconductor sales totaled US$151.7 billion in the first quarter of 2022, showing an increase of 23% over the first quarter of 2021. With the increasing growth in electronics production and semiconductor, the demand for industrial diamonds for applications in computer chips, semiconductor devices and others is growing. The growing electrical and electronics sector is driving the market and offering major growth opportunities to the Industrial Diamond industry.
Industrial Diamond Market Challenges
Availability of Cheaper Substitutes and Volatility in Prices:
The emergence of cheaper substitutes for Industrial Diamonds poses a challenge in the market. The alternatives to diamonds such as moissanite, cubic zirconia and other lab-grown diamonds create a competition for industrial diamonds. Furthermore, the fluctuations in the prices of industrial diamonds hinder growth. The variations of large roughs were between 8% and 15%, while the higher increase of 12% to 20% was visible based on mines roughs and gem category. Thus, with volatility in prices for industrial diamonds and substitute threats from economical alternatives, the Industrial Diamond industry faces major challenges and a slowdown.
Industrial Diamond Industry Outlook
Technology launches, acquisitions and R&D activities are key strategies players adopt in the Industrial Diamond Market. The top 10 companies in the Industrial Diamond Market are:
- Industrial Abrasives Limited
- Diamond Technologies Inc.
- Hebei Plasma Diamond
- Novatek
- Sumitomo Electric
- Applied Diamond Inc.
- Hyperion Materials & Technologies
- Worldwide Diamond Manufacturers Pvt. Ltd.
- Morgan Technical Ceramics
- Scio Diamond Technology Corporation
Recent Developments
- In September 2022, Zhongnan Diamond invested US$76.2 million to renovate and upgrade the industrial diamond production line. Production line transformation is expected to improve the company's industrial diamond and cultured diamond production efficiency and switching efficiency.
Key Market Players:
- Industrial Abrasives Ltd
- Diamond Technologies
- Hebei Plasma Diamond Technology Co., Ltd.
- Sumitomo Electric Industries, Ltd.
- US Applied Diamond, Inc
List of Tables:
Table 1: Industrial Diamond Market Overview 2023-2030
Table 2: Industrial Diamond Market Leader Analysis 2023-2030 (US$)
Table 3: Industrial Diamond Market Product Analysis 2023-2030 (US$)
Table 4: Industrial Diamond Market End User Analysis 2023-2030 (US$)
Table 5: Industrial Diamond Market Patent Analysis 2013-2023* (US$)
Table 6: Industrial Diamond Market Financial Analysis 2023-2030 (US$)
Table 7: Industrial Diamond Market Driver Analysis 2023-2030 (US$)
Table 8: Industrial Diamond Market Challenges Analysis 2023-2030 (US$)
Table 9: Industrial Diamond Market Constraint Analysis 2023-2030 (US$)
Table 10: Industrial Diamond Market Supplier Bargaining Power Analysis 2023-2030 (US$)
Table 11: Industrial Diamond Market Buyer Bargaining Power Analysis 2023-2030 (US$)
Table 12: Industrial Diamond Market Threat of Substitutes Analysis 2023-2030 (US$)
Table 13: Industrial Diamond Market Threat of New Entrants Analysis 2023-2030 (US$)
Table 14: Industrial Diamond Market Degree of Competition Analysis 2023-2030 (US$)
Table 15: Industrial Diamond Market Value Chain Analysis 2023-2030 (US$)
Table 16: Industrial Diamond Market Pricing Analysis 2023-2030 (US$)
Table 17: Industrial Diamond Market Opportunities Analysis 2023-2030 (US$)
Table 18: Industrial Diamond Market Product Life Cycle Analysis 2023-2030 (US$)
Table 19: Industrial Diamond Market Supplier Analysis 2023-2030 (US$)
Table 20: Industrial Diamond Market Distributor Analysis 2023-2030 (US$)
Table 21: Industrial Diamond Market Trend Analysis 2023-2030 (US$)
Table 22: Industrial Diamond Market Size 2023 (US$)
Table 23: Industrial Diamond Market Forecast Analysis 2023-2030 (US$)
Table 24: Industrial Diamond Market Sales Forecast Analysis 2023-2030 (Units)
Table 25: Industrial Diamond Market, Revenue & Volume, By Type, 2023-2030 ($)
Table 26: Industrial Diamond Market By Type, Revenue & Volume, By Natural, 2023-2030 ($)
Table 27: Industrial Diamond Market By Type, Revenue & Volume, By Synthetic, 2023-2030 ($)
Table 28: Industrial Diamond Market, Revenue & Volume, By Application, 2023-2030 ($)
Table 29: Industrial Diamond Market By Application, Revenue & Volume, By Construction & Mining, 2023-2030 ($)
Table 30: Industrial Diamond Market By Application, Revenue & Volume, By Stone cutting/Polishing, 2023-2030 ($)
Table 31: Industrial Diamond Market By Application, Revenue & Volume, By Machinery Manufacturing, 2023-2030 ($)
Table 32: Industrial Diamond Market By Application, Revenue & Volume, By Transportation, 2023-2030 ($)
Table 33: North America Industrial Diamond Market, Revenue & Volume, By Type, 2023-2030 ($)
Table 34: North America Industrial Diamond Market, Revenue & Volume, By Application, 2023-2030 ($)
Table 35: South america Industrial Diamond Market, Revenue & Volume, By Type, 2023-2030 ($)
Table 36: South america Industrial Diamond Market, Revenue & Volume, By Application, 2023-2030 ($)
Table 37: Europe Industrial Diamond Market, Revenue & Volume, By Type, 2023-2030 ($)
Table 38: Europe Industrial Diamond Market, Revenue & Volume, By Application, 2023-2030 ($)
Table 39: APAC Industrial Diamond Market, Revenue & Volume, By Type, 2023-2030 ($)
Table 40: APAC Industrial Diamond Market, Revenue & Volume, By Application, 2023-2030 ($)
Table 41: Middle East & Africa Industrial Diamond Market, Revenue & Volume, By Type, 2023-2030 ($)
Table 42: Middle East & Africa Industrial Diamond Market, Revenue & Volume, By Application, 2023-2030 ($)
Table 43: Russia Industrial Diamond Market, Revenue & Volume, By Type, 2023-2030 ($)
Table 44: Russia Industrial Diamond Market, Revenue & Volume, By Application, 2023-2030 ($)
Table 45: Israel Industrial Diamond Market, Revenue & Volume, By Type, 2023-2030 ($)
Table 46: Israel Industrial Diamond Market, Revenue & Volume, By Application, 2023-2030 ($)
Table 47: Top Companies 2023 (US$)Industrial Diamond Market, Revenue & Volume
Table 48: Product Launch 2023-2030Industrial Diamond Market, Revenue & Volume
Table 49: Mergers & Acquistions 2023-2030Industrial Diamond Market, Revenue & Volume
List of Figures:
Figure 1: Overview of Industrial Diamond Market 2023-2030
Figure 2: Market Share Analysis for Industrial Diamond Market 2023 (US$)
Figure 3: Product Comparison in Industrial Diamond Market 2023-2030 (US$)
Figure 4: End User Profile for Industrial Diamond Market 2023-2030 (US$)
Figure 5: Patent Application and Grant in Industrial Diamond Market 2013-2023* (US$)
Figure 6: Top 5 Companies Financial Analysis in Industrial Diamond Market 2023-2030 (US$)
Figure 7: Market Entry Strategy in Industrial Diamond Market 2023-2030
Figure 8: Ecosystem Analysis in Industrial Diamond Market 2023
Figure 9: Average Selling Price in Industrial Diamond Market 2023-2030
Figure 10: Top Opportunites in Industrial Diamond Market 2023-2030
Figure 11: Market Life Cycle Analysis in Industrial Diamond Market
Figure 12: GlobalBy TypeIndustrial Diamond Market Revenue, 2023-2030 ($)
Figure 13: GlobalBy ApplicationIndustrial Diamond Market Revenue, 2023-2030 ($)
Figure 14: Global Industrial Diamond Market - By Geography
Figure 15: Global Industrial Diamond Market Value & Volume, By Geography, 2023-2030 ($)
Figure 16: Global Industrial Diamond Market CAGR, By Geography, 2023-2030 (%)
Figure 17: North America Industrial Diamond Market Value & Volume, 2023-2030 ($)
Figure 18: US Industrial Diamond Market Value & Volume, 2023-2030 ($)
Figure 19: US GDP and Population, 2023-2030 ($)
Figure 20: US GDP – Composition of 2023, By Sector of Origin
Figure 21: US Export and Import Value & Volume, 2023-2030 ($)
Figure 22: Canada Industrial Diamond Market Value & Volume, 2023-2030 ($)
Figure 23: Canada GDP and Population, 2023-2030 ($)
Figure 24: Canada GDP – Composition of 2023, By Sector of Origin
Figure 25: Canada Export and Import Value & Volume, 2023-2030 ($)
Figure 26: Mexico Industrial Diamond Market Value & Volume, 2023-2030 ($)
Figure 27: Mexico GDP and Population, 2023-2030 ($)
Figure 28: Mexico GDP – Composition of 2023, By Sector of Origin
Figure 29: Mexico Export and Import Value & Volume, 2023-2030 ($)
Figure 30: South America Industrial Diamond Market Value & Volume, 2023-2030 ($)
Figure 31: Brazil Industrial Diamond Market Value & Volume, 2023-2030 ($)
Figure 32: Brazil GDP and Population, 2023-2030 ($)
Figure 33: Brazil GDP – Composition of 2023, By Sector of Origin
Figure 34: Brazil Export and Import Value & Volume, 2023-2030 ($)
Figure 35: Venezuela Industrial Diamond Market Value & Volume, 2023-2030 ($)
Figure 36: Venezuela GDP and Population, 2023-2030 ($)
Figure 37: Venezuela GDP – Composition of 2023, By Sector of Origin
Figure 38: Venezuela Export and Import Value & Volume, 2023-2030 ($)
Figure 39: Argentina Industrial Diamond Market Value & Volume, 2023-2030 ($)
Figure 40: Argentina GDP and Population, 2023-2030 ($)
Figure 41: Argentina GDP – Composition of 2023, By Sector of Origin
Figure 42: Argentina Export and Import Value & Volume, 2023-2030 ($)
Figure 43: Ecuador Industrial Diamond Market Value & Volume, 2023-2030 ($)
Figure 44: Ecuador GDP and Population, 2023-2030 ($)
Figure 45: Ecuador GDP – Composition of 2023, By Sector of Origin
Figure 46: Ecuador Export and Import Value & Volume, 2023-2030 ($)
Figure 47: Peru Industrial Diamond Market Value & Volume, 2023-2030 ($)
Figure 48: Peru GDP and Population, 2023-2030 ($)
Figure 49: Peru GDP – Composition of 2023, By Sector of Origin
Figure 50: Peru Export and Import Value & Volume, 2023-2030 ($)
Figure 51: Colombia Industrial Diamond Market Value & Volume, 2023-2030 ($)
Figure 52: Colombia GDP and Population, 2023-2030 ($)
Figure 53: Colombia GDP – Composition of 2023, By Sector of Origin
Figure 54: Colombia Export and Import Value & Volume, 2023-2030 ($)
Figure 55: Costa Rica Industrial Diamond Market Value & Volume, 2023-2030 ($)
Figure 56: Costa Rica GDP and Population, 2023-2030 ($)
Figure 57: Costa Rica GDP – Composition of 2023, By Sector of Origin
Figure 58: Costa Rica Export and Import Value & Volume, 2023-2030 ($)
Figure 59: Europe Industrial Diamond Market Value & Volume, 2023-2030 ($)
Figure 60: U.K Industrial Diamond Market Value & Volume, 2023-2030 ($)
Figure 61: U.K GDP and Population, 2023-2030 ($)
Figure 62: U.K GDP – Composition of 2023, By Sector of Origin
Figure 63: U.K Export and Import Value & Volume, 2023-2030 ($)
Figure 64: Germany Industrial Diamond Market Value & Volume, 2023-2030 ($)
Figure 65: Germany GDP and Population, 2023-2030 ($)
Figure 66: Germany GDP – Composition of 2023, By Sector of Origin
Figure 67: Germany Export and Import Value & Volume, 2023-2030 ($)
Figure 68: Italy Industrial Diamond Market Value & Volume, 2023-2030 ($)
Figure 69: Italy GDP and Population, 2023-2030 ($)
Figure 70: Italy GDP – Composition of 2023, By Sector of Origin
Figure 71: Italy Export and Import Value & Volume, 2023-2030 ($)
Figure 72: France Industrial Diamond Market Value & Volume, 2023-2030 ($)
Figure 73: France GDP and Population, 2023-2030 ($)
Figure 74: France GDP – Composition of 2023, By Sector of Origin
Figure 75: France Export and Import Value & Volume, 2023-2030 ($)
Figure 76: Netherlands Industrial Diamond Market Value & Volume, 2023-2030 ($)
Figure 77: Netherlands GDP and Population, 2023-2030 ($)
Figure 78: Netherlands GDP – Composition of 2023, By Sector of Origin
Figure 79: Netherlands Export and Import Value & Volume, 2023-2030 ($)
Figure 80: Belgium Industrial Diamond Market Value & Volume, 2023-2030 ($)
Figure 81: Belgium GDP and Population, 2023-2030 ($)
Figure 82: Belgium GDP – Composition of 2023, By Sector of Origin
Figure 83: Belgium Export and Import Value & Volume, 2023-2030 ($)
Figure 84: Spain Industrial Diamond Market Value & Volume, 2023-2030 ($)
Figure 85: Spain GDP and Population, 2023-2030 ($)
Figure 86: Spain GDP – Composition of 2023, By Sector of Origin
Figure 87: Spain Export and Import Value & Volume, 2023-2030 ($)
Figure 88: Denmark Industrial Diamond Market Value & Volume, 2023-2030 ($)
Figure 89: Denmark GDP and Population, 2023-2030 ($)
Figure 90: Denmark GDP – Composition of 2023, By Sector of Origin
Figure 91: Denmark Export and Import Value & Volume, 2023-2030 ($)
Figure 92: APAC Industrial Diamond Market Value & Volume, 2023-2030 ($)
Figure 93: China Industrial Diamond Market Value & Volume, 2023-2030
Figure 94: China GDP and Population, 2023-2030 ($)
Figure 95: China GDP – Composition of 2023, By Sector of Origin
Figure 96: China Export and Import Value & Volume, 2023-2030 ($)Industrial Diamond Market China Export and Import Value & Volume, 2023-2030 ($)
Figure 97: Australia Industrial Diamond Market Value & Volume, 2023-2030 ($)
Figure 98: Australia GDP and Population, 2023-2030 ($)
Figure 99: Australia GDP – Composition of 2023, By Sector of Origin
Figure 100: Australia Export and Import Value & Volume, 2023-2030 ($)
Figure 101: South Korea Industrial Diamond Market Value & Volume, 2023-2030 ($)
Figure 102: South Korea GDP and Population, 2023-2030 ($)
Figure 103: South Korea GDP – Composition of 2023, By Sector of Origin
Figure 104: South Korea Export and Import Value & Volume, 2023-2030 ($)
Figure 105: India Industrial Diamond Market Value & Volume, 2023-2030 ($)
Figure 106: India GDP and Population, 2023-2030 ($)
Figure 107: India GDP – Composition of 2023, By Sector of Origin
Figure 108: India Export and Import Value & Volume, 2023-2030 ($)
Figure 109: Taiwan Industrial Diamond Market Value & Volume, 2023-2030 ($)
Figure 110: Taiwan GDP and Population, 2023-2030 ($)
Figure 111: Taiwan GDP – Composition of 2023, By Sector of Origin
Figure 112: Taiwan Export and Import Value & Volume, 2023-2030 ($)
Figure 113: Malaysia Industrial Diamond Market Value & Volume, 2023-2030 ($)
Figure 114: Malaysia GDP and Population, 2023-2030 ($)
Figure 115: Malaysia GDP – Composition of 2023, By Sector of Origin
Figure 116: Malaysia Export and Import Value & Volume, 2023-2030 ($)
Figure 117: Hong Kong Industrial Diamond Market Value & Volume, 2023-2030 ($)
Figure 118: Hong Kong GDP and Population, 2023-2030 ($)
Figure 119: Hong Kong GDP – Composition of 2023, By Sector of Origin
Figure 120: Hong Kong Export and Import Value & Volume, 2023-2030 ($)
Figure 121: Middle East & Africa Industrial Diamond Market Middle East & Africa 3D Printing Market Value & Volume, 2023-2030 ($)
Figure 122: Russia Industrial Diamond Market Value & Volume, 2023-2030 ($)
Figure 123: Russia GDP and Population, 2023-2030 ($)
Figure 124: Russia GDP – Composition of 2023, By Sector of Origin
Figure 125: Russia Export and Import Value & Volume, 2023-2030 ($)
Figure 126: Israel Industrial Diamond Market Value & Volume, 2023-2030 ($)
Figure 127: Israel GDP and Population, 2023-2030 ($)
Figure 128: Israel GDP – Composition of 2023, By Sector of Origin
Figure 129: Israel Export and Import Value & Volume, 2023-2030 ($)
Figure 130: Entropy Share, By Strategies, 2023-2030* (%)Industrial Diamond Market
Figure 131: Developments, 2023-2030*Industrial Diamond Market
Figure 132: Company 1 Industrial Diamond Market Net Revenue, By Years, 2023-2030* ($)
Figure 133: Company 1 Industrial Diamond Market Net Revenue Share, By Business segments, 2023 (%)
Figure 134: Company 1 Industrial Diamond Market Net Sales Share, By Geography, 2023 (%)
Figure 135: Company 2 Industrial Diamond Market Net Revenue, By Years, 2023-2030* ($)
Figure 136: Company 2 Industrial Diamond Market Net Revenue Share, By Business segments, 2023 (%)
Figure 137: Company 2 Industrial Diamond Market Net Sales Share, By Geography, 2023 (%)
Figure 138: Company 3 Industrial Diamond Market Net Revenue, By Years, 2023-2030* ($)
Figure 139: Company 3 Industrial Diamond Market Net Revenue Share, By Business segments, 2023 (%)
Figure 140: Company 3 Industrial Diamond Market Net Sales Share, By Geography, 2023 (%)
Figure 141: Company 4 Industrial Diamond Market Net Revenue, By Years, 2023-2030* ($)
Figure 142: Company 4 Industrial Diamond Market Net Revenue Share, By Business segments, 2023 (%)
Figure 143: Company 4 Industrial Diamond Market Net Sales Share, By Geography, 2023 (%)
Figure 144: Company 5 Industrial Diamond Market Net Revenue, By Years, 2023-2030* ($)
Figure 145: Company 5 Industrial Diamond Market Net Revenue Share, By Business segments, 2023 (%)
Figure 146: Company 5 Industrial Diamond Market Net Sales Share, By Geography, 2023 (%)
Figure 147: Company 6 Industrial Diamond Market Net Revenue, By Years, 2023-2030* ($)
Figure 148: Company 6 Industrial Diamond Market Net Revenue Share, By Business segments, 2023 (%)
Figure 149: Company 6 Industrial Diamond Market Net Sales Share, By Geography, 2023 (%)
Figure 150: Company 7 Industrial Diamond Market Net Revenue, By Years, 2023-2030* ($)
Figure 151: Company 7 Industrial Diamond Market Net Revenue Share, By Business segments, 2023 (%)
Figure 152: Company 7 Industrial Diamond Market Net Sales Share, By Geography, 2023 (%)
Figure 153: Company 8 Industrial Diamond Market Net Revenue, By Years, 2023-2030* ($)
Figure 154: Company 8 Industrial Diamond Market Net Revenue Share, By Business segments, 2023 (%)
Figure 155: Company 8 Industrial Diamond Market Net Sales Share, By Geography, 2023 (%)
Figure 156: Company 9 Industrial Diamond Market Net Revenue, By Years, 2023-2030* ($)
Figure 157: Company 9 Industrial Diamond Market Net Revenue Share, By Business segments, 2023 (%)
Figure 158: Company 9 Industrial Diamond Market Net Sales Share, By Geography, 2023 (%)
Figure 159: Company 10 Industrial Diamond Market Net Revenue, By Years, 2023-2030* ($)
Figure 160: Company 10 Industrial Diamond Market Net Revenue Share, By Business segments, 2023 (%)
Figure 161: Company 10 Industrial Diamond Market Net Sales Share, By Geography, 2023 (%)
Figure 162: Company 11 Industrial Diamond Market Net Revenue, By Years, 2023-2030* ($)
Figure 163: Company 11 Industrial Diamond Market Net Revenue Share, By Business segments, 2023 (%)
Figure 164: Company 11 Industrial Diamond Market Net Sales Share, By Geography, 2023 (%)
Figure 165: Company 12 Industrial Diamond Market Net Revenue, By Years, 2023-2030* ($)
Figure 166: Company 12 Industrial Diamond Market Net Revenue Share, By Business segments, 2023 (%)
Figure 167: Company 12 Industrial Diamond Market Net Sales Share, By Geography, 2023 (%)
Figure 168: Company 13 Industrial Diamond Market Net Revenue, By Years, 2023-2030* ($)
Figure 169: Company 13 Industrial Diamond Market Net Revenue Share, By Business segments, 2023 (%)
Figure 170: Company 13 Industrial Diamond Market Net Sales Share, By Geography, 2023 (%)
Figure 171: Company 14 Industrial Diamond Market Net Revenue, By Years, 2023-2030* ($)
Figure 172: Company 14 Industrial Diamond Market Net Revenue Share, By Business segments, 2023 (%)
Figure 173: Company 14 Industrial Diamond Market Net Sales Share, By Geography, 2023 (%)
Figure 174: Company 15 Industrial Diamond Market Net Revenue, By Years, 2023-2030* ($)
Figure 175: Company 15 Industrial Diamond Market Net Revenue Share, By Business segments, 2023 (%)
Figure 176: Company 15 Industrial Diamond Market Net Sales Share, By Geography, 2023 (%)