 Email
Email Print
Print


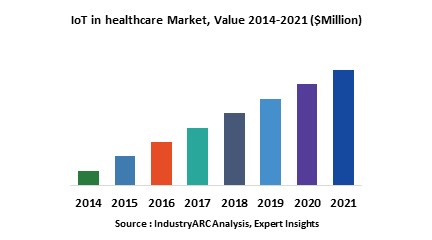
The Internet of Things (IoT) can be defined as a system of interrelated and connected computing devices, mechanical and digital machines, or people and whose access rights can be regulated and monitored to transfer data over a network without requiring human-to-human or human-to-computer interaction. IoT plays an important role in today’s health care system to better serve and treat the patient by centralizing their history and enable better coordination among various departments. Globally increasing penetration of connected devices and better connectivity is expected to be the key driver for IoT during the period of study.
This report identifies the Internet of Things in healthcare market size in for the year 2014-2016, and forecast of the same for year 2021. It also highlights the potential growth opportunities in the coming years, while also reviewing the market drivers, restraints, growth indicators, challenges, market dynamics, competitive landscape, and other key aspects with respect to Internet of Things in healthcare market.
Globally North America dominated the market for Internet of Things in healthcare in 2015 with highest market share due to well established healthcare setup, higher penetration of internet connectivity and tech savvy population in the region. North America was followed by Europe as the second largest regional market for Internet of Things in healthcare. However, Asia-Pacific is expected to be fastest growing regional segment during the period of study due to fast growing internet penetration in major markets like India and China along with rapidly developing healthcare infrastructure in the region.
Sample Companies Profiled in this Report are:
This report identifies the Internet of Things in healthcare market size in for the year 2014-2016, and forecast of the same for year 2021. It also highlights the potential growth opportunities in the coming years, while also reviewing the market drivers, restraints, growth indicators, challenges, market dynamics, competitive landscape, and other key aspects with respect to Internet of Things in healthcare market.
Globally North America dominated the market for Internet of Things in healthcare in 2015 with highest market share due to well established healthcare setup, higher penetration of internet connectivity and tech savvy population in the region. North America was followed by Europe as the second largest regional market for Internet of Things in healthcare. However, Asia-Pacific is expected to be fastest growing regional segment during the period of study due to fast growing internet penetration in major markets like India and China along with rapidly developing healthcare infrastructure in the region.
- This report on global Internet of Things in healthcare covers different components of Internet of Things in healthcare and application of interned of things in the healthcare industry and market size in various geographical regions.
- On the basis of components of Internet of Things in healthcare, this report segments global market into four major categories as follows: Medical Device (Wearable External Medical Devices, Implanted Medical Devices, Stationary Medical Devices), System and Software (Remote Device Management, Network Bandwidth Management, Data Analytics, Application Security, Network Security), Service (System Integration Services, Consulting, Training, and Education, Support and Maintenance Services) Connectivity Technology (Wi-Fi, Bluetooth Low Energy (BLE), Zigbee, Near Field Communication (NFC), Cellular, Satellite)
- This reports is also classified on the basis of applications of internet of things in healthcare practices, some of the major applications included in this report are as follows: Telemedicine, Workflow Management, Connected Imaging, Medication Management, Inpatient Monitoring and Others
- This is report has been further segmented into major regions, which includes detailed analysis of each region such as North America, Europe, Asia-Pacific (APAC) and Rest of the World (RoW) covering all the major country level markets for Internet of Things in healthcare in each of the region.
Sample Companies Profiled in this Report are:
- Honeywell Life Care Solutions
- Microsoft Corporation
- IBM Corporation
- GE Healthcare
- Stanley Healthcare
- 10+
1. IoT in healthcare Market - Overview
1.1. Definitions and Scope
2. IoT in healthcare Market - Executive summary
2.1. Market Revenue, Market Size and Key Trends by Company
2.2. Key Trends by type of Application
2.3. Key Trends segmented by Geography
3. IoT in healthcare Market
3.1. Comparative analysis
3.1.1. Product Benchmarking - Top 10 companies
3.1.2. Top 5 Financials Analysis
3.1.3. Market Value split by Top 10 companies
3.1.4. Patent Analysis - Top 10 companies
3.1.5. Pricing Analysis
4. IoT in healthcare Market – Startup companies Scenario Premium
4.1. Top 10 startup company Analysis by
4.1.1. Investment
4.1.2. Revenue
4.1.3. Market Shares
4.1.4. Market Size and Application Analysis
4.1.5. Venture Capital and Funding Scenario
5. IoT in healthcare Market – Industry Market Entry Scenario Premium
5.1. Regulatory Framework Overview
5.2. New Business and Ease of Doing business index
5.3. Case studies of successful ventures
5.4. Customer Analysis – Top 10 companies
6. IoT in healthcare Market Forces
6.1. Drivers
6.2. Constraints
6.3. Challenges
6.4. Porters five force model
6.4.1. Bargaining power of suppliers
6.4.2. Bargaining powers of customers
6.4.3. Threat of new entrants
6.4.4. Rivalry among existing players
6.4.5. Threat of substitutes
7. IoT in healthcare Market - Strategic analysis
7.1. Value chain analysis
7.2. Opportunities analysis
7.3. Product life cycle
7.4. Suppliers and distributors Market Share
8. IoT in healthcare Market – By Components (Market Size -$Million / $Billion)
8.1. Market Size and Market Share Analysis
8.2. Application Revenue and Trend Research
8.3. Product Segment Analysis
8.3.1. Medical Device
8.3.1.1. Wearable External Medical Devices
8.3.1.2. Implanted Medical Devices
8.3.1.3. Stationary Medical Devices
8.3.2. System and Software
8.3.2.1. Remote Device Management
8.3.2.2. Network Bandwidth Management
8.3.2.3. Data Analytics
8.3.2.4. Application Security
8.3.2.5. Network Security
8.3.3. Service
8.3.3.1. System Integration Services
8.3.3.2. Consulting, Training, and Education
8.3.3.3. Support and Maintenance Services
8.3.4. Connectivity Technology
8.3.4.1. Wi-Fi
8.3.4.2. Bluetooth Low Energy (BLE)
8.3.4.3. Zigbee
8.3.4.4. Near Field Communication (NFC)
8.3.4.5. Cellular
8.3.4.6. Satellite
9. IoT in healthcare Market – By Application (Market Size -$Million / $Billion)
9.1. Telemedicine
9.2. Workflow Management
9.3. Connected Imaging
9.4. Medication Management
9.5. Inpatient Monitoring
9.6. Others
10. IoT in healthcare - By Geography (Market Size -$Million / $Billion)
10.1. IoT in healthcare Market - North America Segment Research
10.2. North America Market Research (Million / $Billion)
10.2.1. Segment type Size and Market Size Analysis
10.2.2. Revenue and Trends
10.2.3. Application Revenue and Trends by type of Application
10.2.4. Company Revenue and Product Analysis
10.2.5. North America Product type and Application Market Size
10.2.5.1. U.S.
10.2.5.2. Canada
10.2.5.3. Mexico
10.2.5.4. Rest of North America
10.3. IoT in healthcare - South America Segment Research
10.4. South America Market Research (Market Size -$Million / $Billion)
10.4.1. Segment type Size and Market Size Analysis
10.4.2. Revenue and Trends
10.4.3. Application Revenue and Trends by type of Application
10.4.4. Company Revenue and Product Analysis
10.4.5. South America Product type and Application Market Size
10.4.5.1. Brazil
10.4.5.2. Venezuela
10.4.5.3. Argentina
10.4.5.4. Ecuador
10.4.5.5. Peru
10.4.5.6. Colombia
10.4.5.7. Costa Rica
10.4.5.8. Rest of South America
10.5. IoT in healthcare - Europe Segment Research
10.6. Europe Market Research (Market Size -$Million / $Billion)
10.6.1. Segment type Size and Market Size Analysis
10.6.2. Revenue and Trends
10.6.3. Application Revenue and Trends by type of Application
10.6.4. Company Revenue and Product Analysis
10.6.5. Europe Segment Product type and Application Market Size
10.6.5.1. U.K
10.6.5.2. Germany
10.6.5.3. Italy
10.6.5.4. France
10.6.5.5. Netherlands
10.6.5.6. Belgium
10.6.5.7. Spain
10.6.5.8. Denmark
10.6.5.9. Rest of Europe
10.7. IoT in healthcare – APAC Segment Research
10.8. APAC Market Research (Market Size -$Million / $Billion)
10.8.1. Segment type Size and Market Size Analysis
10.8.2. Revenue and Trends
10.8.3. Application Revenue and Trends by type of Application
10.8.4. Company Revenue and Product Analysis
10.8.5. APAC Segment – Product type and Application Market Size
10.8.5.1. China
10.8.5.2. Australia
10.8.5.3. Japan
10.8.5.4. South Korea
10.8.5.5. India
10.8.5.6. Taiwan
10.8.5.7. Malaysia
11. IoT in healthcare Market - Entropy
11.1. New product launches
11.2. M&A's, collaborations, JVs and partnerships
12. IoT in healthcare Market – Industry / Segment Competition landscape Premium
12.1. Market Share Analysis
12.1.1. Market Share by Country- Top companies
12.1.2. Market Share by Region- Top 10 companies
12.1.3. Market Share by type of Application – Top 10 companies
12.1.4. Market Share by type of Product / Product category- Top 10 companies
12.1.5. Market Share at global level- Top 10 companies
12.1.6. Best Practises for companies
13. IoT in healthcare Market – Key Company List by Country Premium
14. IoT in healthcare Market Company Analysis
14.1. Market Share, Company Revenue, Products, M&A, Developments
14.2. Honeywell Life Care Solutions
14.3. Microsoft Corporation
14.4. IBM Corporation
14.5. GE Healthcare
14.6. Stanley Healthcare
14.7. Qualcomm Life, Inc.
14.8. SAP SE
14.9. Medtronic, Inc.
14.10. Phillips
14.11. Cisco Systems
14.12. Company 11
14.13. Company 12
14.14. Company 13 and more
"*Financials would be provided on a best efforts basis for private companies"
15. IoT in healthcare Market - Appendix
15.1. Abbreviations
15.2. Sources
16. IoT in healthcare Market - Methodology
16.1. Research Methodology
16.1.1. Company Expert Interviews
16.1.2. Industry Databases
16.1.3. Associations
16.1.4. Company News
16.1.5. Company Annual Reports
16.1.6. Application Trends
16.1.7. New Products and Product database
16.1.8. Company Transcripts
16.1.9. R&D Trends
16.1.10. Key Opinion Leaders Interviews
16.1.11. Supply and Demand Trends
List of Tables
Table 1 IoT in healthcare Market Overview 2023-2030
Table 2 IoT in healthcare Market Leader Analysis 2023-2030 (US$)
Table 3 IoT in healthcare MarketProduct Analysis 2023-2030 (US$)
Table 4 IoT in healthcare MarketEnd User Analysis 2023-2030 (US$)
Table 5 IoT in healthcare MarketPatent Analysis 2013-2023* (US$)
Table 6 IoT in healthcare MarketFinancial Analysis 2023-2030 (US$)
Table 7 IoT in healthcare Market Driver Analysis 2023-2030 (US$)
Table 8 IoT in healthcare MarketChallenges Analysis 2023-2030 (US$)
Table 9 IoT in healthcare MarketConstraint Analysis 2023-2030 (US$)
Table 10 IoT in healthcare Market Supplier Bargaining Power Analysis 2023-2030 (US$)
Table 11 IoT in healthcare Market Buyer Bargaining Power Analysis 2023-2030 (US$)
Table 12 IoT in healthcare Market Threat of Substitutes Analysis 2023-2030 (US$)
Table 13 IoT in healthcare Market Threat of New Entrants Analysis 2023-2030 (US$)
Table 14 IoT in healthcare Market Degree of Competition Analysis 2023-2030 (US$)
Table 15 IoT in healthcare MarketValue Chain Analysis 2023-2030 (US$)
Table 16 IoT in healthcare MarketPricing Analysis 2023-2030 (US$)
Table 17 IoT in healthcare MarketOpportunities Analysis 2023-2030 (US$)
Table 18 IoT in healthcare MarketProduct Life Cycle Analysis 2023-2030 (US$)
Table 19 IoT in healthcare MarketSupplier Analysis 2023-2030 (US$)
Table 20 IoT in healthcare MarketDistributor Analysis 2023-2030 (US$)
Table 21 IoT in healthcare Market Trend Analysis 2023-2030 (US$)
Table 22 IoT in healthcare Market Size 2023 (US$)
Table 23 IoT in healthcare Market Forecast Analysis 2023-2030 (US$)
Table 24 IoT in healthcare Market Sales Forecast Analysis 2023-2030 (Units)
Table 25 IoT in healthcare Market, Revenue & Volume,By Components, 2023-2030 ($)
Table 26 IoT in healthcare MarketBy Components, Revenue & Volume,By Medical Device, 2023-2030 ($)
Table 27 IoT in healthcare MarketBy Components, Revenue & Volume,By Wearable External Medical Devices, 2023-2030 ($)
Table 28 IoT in healthcare MarketBy Components, Revenue & Volume,By Implanted Medical Devices, 2023-2030 ($)
Table 29 IoT in healthcare MarketBy Components, Revenue & Volume,By Stationary Medical Devices, 2023-2030 ($)
Table 30 IoT in healthcare MarketBy Components, Revenue & Volume,By System and software, 2023-2030 ($)
Table 31 IoT in healthcare Market, Revenue & Volume,By Application, 2023-2030 ($)
Table 32 IoT in healthcare MarketBy Application, Revenue & Volume,By Telemedicine, 2023-2030 ($)
Table 33 IoT in healthcare MarketBy Application, Revenue & Volume,By Workflow Management, 2023-2030 ($)
Table 34 IoT in healthcare MarketBy Application, Revenue & Volume,By Connected Imaging, 2023-2030 ($)
Table 35 IoT in healthcare MarketBy Application, Revenue & Volume,By Medication Management, 2023-2030 ($)
Table 36 IoT in healthcare MarketBy Application, Revenue & Volume,By Inpatient Monitoring, 2023-2030 ($)
Table 37 North America IoT in healthcare Market, Revenue & Volume,By Components, 2023-2030 ($)
Table 38 North America IoT in healthcare Market, Revenue & Volume,By Application, 2023-2030 ($)
Table 39 South america IoT in healthcare Market, Revenue & Volume,By Components, 2023-2030 ($)
Table 40 South america IoT in healthcare Market, Revenue & Volume,By Application, 2023-2030 ($)
Table 41 Europe IoT in healthcare Market, Revenue & Volume,By Components, 2023-2030 ($)
Table 42 Europe IoT in healthcare Market, Revenue & Volume,By Application, 2023-2030 ($)
Table 43 APAC IoT in healthcare Market, Revenue & Volume,By Components, 2023-2030 ($)
Table 44 APAC IoT in healthcare Market, Revenue & Volume,By Application, 2023-2030 ($)
Table 45 Middle East & Africa IoT in healthcare Market, Revenue & Volume,By Components, 2023-2030 ($)
Table 46 Middle East & Africa IoT in healthcare Market, Revenue & Volume,By Application, 2023-2030 ($)
Table 47 Russia IoT in healthcare Market, Revenue & Volume,By Components, 2023-2030 ($)
Table 48 Russia IoT in healthcare Market, Revenue & Volume,By Application, 2023-2030 ($)
Table 49 Israel IoT in healthcare Market, Revenue & Volume,By Components, 2023-2030 ($)
Table 50 Israel IoT in healthcare Market, Revenue & Volume,By Application, 2023-2030 ($)
Table 51 Top Companies 2023 (US$)IoT in healthcare Market, Revenue & Volume,,
Table 52 Product Launch 2023-2030IoT in healthcare Market, Revenue & Volume,,
Table 53 Mergers & Acquistions 2023-2030IoT in healthcare Market, Revenue & Volume,,
List of Figures
Figure 1 Overview of IoT in healthcare Market 2023-2030
Figure 2 Market Share Analysis for IoT in healthcare Market 2023 (US$)
Figure 3 Product Comparison in IoT in healthcare Market 2023-2030 (US$)
Figure 4 End User Profile for IoT in healthcare Market 2023-2030 (US$)
Figure 5 Patent Application and Grant in IoT in healthcare Market 2013-2023* (US$)
Figure 6 Top 5 Companies Financial Analysis in IoT in healthcare Market 2023-2030 (US$)
Figure 7 Market Entry Strategy in IoT in healthcare Market 2023-2030
Figure 8 Ecosystem Analysis in IoT in healthcare Market2023
Figure 9 Average Selling Price in IoT in healthcare Market 2023-2030
Figure 10 Top Opportunites in IoT in healthcare Market 2023-2030
Figure 11 Market Life Cycle Analysis in IoT in healthcare Market
Figure 12 GlobalBy ComponentsIoT in healthcare Market Revenue, 2023-2030 ($)
Figure 13 GlobalBy ApplicationIoT in healthcare Market Revenue, 2023-2030 ($)
Figure 14 Global IoT in healthcare Market - By Geography
Figure 15 Global IoT in healthcare Market Value & Volume, By Geography, 2023-2030 ($)
Figure 16 Global IoT in healthcare Market CAGR, By Geography, 2023-2030 (%)
Figure 17 North America IoT in healthcare Market Value & Volume, 2023-2030 ($)
Figure 18 US IoT in healthcare Market Value & Volume, 2023-2030 ($)
Figure 19 US GDP and Population, 2023-2030 ($)
Figure 20 US GDP – Composition of 2023, By Sector of Origin
Figure 21 US Export and Import Value & Volume, 2023-2030 ($)
Figure 22 Canada IoT in healthcare Market Value & Volume, 2023-2030 ($)
Figure 23 Canada GDP and Population, 2023-2030 ($)
Figure 24 Canada GDP – Composition of 2023, By Sector of Origin
Figure 25 Canada Export and Import Value & Volume, 2023-2030 ($)
Figure 26 Mexico IoT in healthcare Market Value & Volume, 2023-2030 ($)
Figure 27 Mexico GDP and Population, 2023-2030 ($)
Figure 28 Mexico GDP – Composition of 2023, By Sector of Origin
Figure 29 Mexico Export and Import Value & Volume, 2023-2030 ($)
Figure 30 South America IoT in healthcare MarketSouth America 3D Printing Market Value & Volume, 2023-2030 ($)
Figure 31 Brazil IoT in healthcare Market Value & Volume, 2023-2030 ($)
Figure 32 Brazil GDP and Population, 2023-2030 ($)
Figure 33 Brazil GDP – Composition of 2023, By Sector of Origin
Figure 34 Brazil Export and Import Value & Volume, 2023-2030 ($)
Figure 35 Venezuela IoT in healthcare Market Value & Volume, 2023-2030 ($)
Figure 36 Venezuela GDP and Population, 2023-2030 ($)
Figure 37 Venezuela GDP – Composition of 2023, By Sector of Origin
Figure 38 Venezuela Export and Import Value & Volume, 2023-2030 ($)
Figure 39 Argentina IoT in healthcare Market Value & Volume, 2023-2030 ($)
Figure 40 Argentina GDP and Population, 2023-2030 ($)
Figure 41 Argentina GDP – Composition of 2023, By Sector of Origin
Figure 42 Argentina Export and Import Value & Volume, 2023-2030 ($)
Figure 43 Ecuador IoT in healthcare Market Value & Volume, 2023-2030 ($)
Figure 44 Ecuador GDP and Population, 2023-2030 ($)
Figure 45 Ecuador GDP – Composition of 2023, By Sector of Origin
Figure 46 Ecuador Export and Import Value & Volume, 2023-2030 ($)
Figure 47 Peru IoT in healthcare Market Value & Volume, 2023-2030 ($)
Figure 48 Peru GDP and Population, 2023-2030 ($)
Figure 49 Peru GDP – Composition of 2023, By Sector of Origin
Figure 50 Peru Export and Import Value & Volume, 2023-2030 ($)
Figure 51 Colombia IoT in healthcare Market Value & Volume, 2023-2030 ($)
Figure 52 Colombia GDP and Population, 2023-2030 ($)
Figure 53 Colombia GDP – Composition of 2023, By Sector of Origin
Figure 54 Colombia Export and Import Value & Volume, 2023-2030 ($)
Figure 55 Costa Rica IoT in healthcare MarketCosta Rica 3D Printing Market Value & Volume, 2023-2030 ($)
Figure 56 Costa Rica GDP and Population, 2023-2030 ($)
Figure 57 Costa Rica GDP – Composition of 2023, By Sector of Origin
Figure 58 Costa Rica Export and Import Value & Volume, 2023-2030 ($)
Figure 59 Europe IoT in healthcare Market Value & Volume, 2023-2030 ($)
Figure 60 U.K IoT in healthcare Market Value & Volume, 2023-2030 ($)
Figure 61 U.K GDP and Population, 2023-2030 ($)
Figure 62 U.K GDP – Composition of 2023, By Sector of Origin
Figure 63 U.K Export and Import Value & Volume, 2023-2030 ($)
Figure 64 Germany IoT in healthcare Market Value & Volume, 2023-2030 ($)
Figure 65 Germany GDP and Population, 2023-2030 ($)
Figure 66 Germany GDP – Composition of 2023, By Sector of Origin
Figure 67 Germany Export and Import Value & Volume, 2023-2030 ($)
Figure 68 Italy IoT in healthcare Market Value & Volume, 2023-2030 ($)
Figure 69 Italy GDP and Population, 2023-2030 ($)
Figure 70 Italy GDP – Composition of 2023, By Sector of Origin
Figure 71 Italy Export and Import Value & Volume, 2023-2030 ($)
Figure 72 France IoT in healthcare Market Value & Volume, 2023-2030 ($)
Figure 73 France GDP and Population, 2023-2030 ($)
Figure 74 France GDP – Composition of 2023, By Sector of Origin
Figure 75 France Export and Import Value & Volume, 2023-2030 ($)
Figure 76 Netherlands IoT in healthcare Market Value & Volume, 2023-2030 ($)
Figure 77 Netherlands GDP and Population, 2023-2030 ($)
Figure 78 Netherlands GDP – Composition of 2023, By Sector of Origin
Figure 79 Netherlands Export and Import Value & Volume, 2023-2030 ($)
Figure 80 Belgium IoT in healthcare Market Value & Volume, 2023-2030 ($)
Figure 81 Belgium GDP and Population, 2023-2030 ($)
Figure 82 Belgium GDP – Composition of 2023, By Sector of Origin
Figure 83 Belgium Export and Import Value & Volume, 2023-2030 ($)
Figure 84 Spain IoT in healthcare Market Value & Volume, 2023-2030 ($)
Figure 85 Spain GDP and Population, 2023-2030 ($)
Figure 86 Spain GDP – Composition of 2023, By Sector of Origin
Figure 87 Spain Export and Import Value & Volume, 2023-2030 ($)
Figure 88 Denmark IoT in healthcare Market Value & Volume, 2023-2030 ($)
Figure 89 Denmark GDP and Population, 2023-2030 ($)
Figure 90 Denmark GDP – Composition of 2023, By Sector of Origin
Figure 91 Denmark Export and Import Value & Volume, 2023-2030 ($)
Figure 92 APAC IoT in healthcare Market Value & Volume, 2023-2030 ($)
Figure 93 China IoT in healthcare MarketValue & Volume, 2023-2030
Figure 94 China GDP and Population, 2023-2030 ($)
Figure 95 China GDP – Composition of 2023, By Sector of Origin
Figure 96 China Export and Import Value & Volume, 2023-2030 ($)IoT in healthcare MarketChina Export and Import Value & Volume, 2023-2030 ($)
Figure 97 Australia IoT in healthcare Market Value & Volume, 2023-2030 ($)
Figure 98 Australia GDP and Population, 2023-2030 ($)
Figure 99 Australia GDP – Composition of 2023, By Sector of Origin
Figure 100 Australia Export and Import Value & Volume, 2023-2030 ($)
Figure 101 South Korea IoT in healthcare Market Value & Volume, 2023-2030 ($)
Figure 102 South Korea GDP and Population, 2023-2030 ($)
Figure 103 South Korea GDP – Composition of 2023, By Sector of Origin
Figure 104 South Korea Export and Import Value & Volume, 2023-2030 ($)
Figure 105 India IoT in healthcare Market Value & Volume, 2023-2030 ($)
Figure 106 India GDP and Population, 2023-2030 ($)
Figure 107 India GDP – Composition of 2023, By Sector of Origin
Figure 108 India Export and Import Value & Volume, 2023-2030 ($)
Figure 109 Taiwan IoT in healthcare MarketTaiwan 3D Printing Market Value & Volume, 2023-2030 ($)
Figure 110 Taiwan GDP and Population, 2023-2030 ($)
Figure 111 Taiwan GDP – Composition of 2023, By Sector of Origin
Figure 112 Taiwan Export and Import Value & Volume, 2023-2030 ($)
Figure 113 Malaysia IoT in healthcare MarketMalaysia 3D Printing Market Value & Volume, 2023-2030 ($)
Figure 114 Malaysia GDP and Population, 2023-2030 ($)
Figure 115 Malaysia GDP – Composition of 2023, By Sector of Origin
Figure 116 Malaysia Export and Import Value & Volume, 2023-2030 ($)
Figure 117 Hong Kong IoT in healthcare MarketHong Kong 3D Printing Market Value & Volume, 2023-2030 ($)
Figure 118 Hong Kong GDP and Population, 2023-2030 ($)
Figure 119 Hong Kong GDP – Composition of 2023, By Sector of Origin
Figure 120 Hong Kong Export and Import Value & Volume, 2023-2030 ($)
Figure 121 Middle East & Africa IoT in healthcare MarketMiddle East & Africa 3D Printing Market Value & Volume, 2023-2030 ($)
Figure 122 Russia IoT in healthcare MarketRussia 3D Printing Market Value & Volume, 2023-2030 ($)
Figure 123 Russia GDP and Population, 2023-2030 ($)
Figure 124 Russia GDP – Composition of 2023, By Sector of Origin
Figure 125 Russia Export and Import Value & Volume, 2023-2030 ($)
Figure 126 Israel IoT in healthcare Market Value & Volume, 2023-2030 ($)
Figure 127 Israel GDP and Population, 2023-2030 ($)
Figure 128 Israel GDP – Composition of 2023, By Sector of Origin
Figure 129 Israel Export and Import Value & Volume, 2023-2030 ($)
Figure 130 Entropy Share, By Strategies, 2023-2030* (%)IoT in healthcare Market
Figure 131 Developments, 2023-2030*IoT in healthcare Market
Figure 132 Company 1 IoT in healthcare Market Net Revenue, By Years, 2023-2030* ($)
Figure 133 Company 1 IoT in healthcare Market Net Revenue Share, By Business segments, 2023 (%)
Figure 134 Company 1 IoT in healthcare Market Net Sales Share, By Geography, 2023 (%)
Figure 135 Company 2 IoT in healthcare Market Net Revenue, By Years, 2023-2030* ($)
Figure 136 Company 2 IoT in healthcare Market Net Revenue Share, By Business segments, 2023 (%)
Figure 137 Company 2 IoT in healthcare Market Net Sales Share, By Geography, 2023 (%)
Figure 138 Company 3IoT in healthcare Market Net Revenue, By Years, 2023-2030* ($)
Figure 139 Company 3IoT in healthcare Market Net Revenue Share, By Business segments, 2023 (%)
Figure 140 Company 3IoT in healthcare Market Net Sales Share, By Geography, 2023 (%)
Figure 141 Company 4 IoT in healthcare Market Net Revenue, By Years, 2023-2030* ($)
Figure 142 Company 4 IoT in healthcare Market Net Revenue Share, By Business segments, 2023 (%)
Figure 143 Company 4 IoT in healthcare Market Net Sales Share, By Geography, 2023 (%)
Figure 144 Company 5 IoT in healthcare Market Net Revenue, By Years, 2023-2030* ($)
Figure 145 Company 5 IoT in healthcare Market Net Revenue Share, By Business segments, 2023 (%)
Figure 146 Company 5 IoT in healthcare Market Net Sales Share, By Geography, 2023 (%)
Figure 147 Company 6 IoT in healthcare Market Net Revenue, By Years, 2023-2030* ($)
Figure 148 Company 6 IoT in healthcare Market Net Revenue Share, By Business segments, 2023 (%)
Figure 149 Company 6 IoT in healthcare Market Net Sales Share, By Geography, 2023 (%)
Figure 150 Company 7 IoT in healthcare Market Net Revenue, By Years, 2023-2030* ($)
Figure 151 Company 7 IoT in healthcare Market Net Revenue Share, By Business segments, 2023 (%)
Figure 152 Company 7 IoT in healthcare Market Net Sales Share, By Geography, 2023 (%)
Figure 153 Company 8 IoT in healthcare Market Net Revenue, By Years, 2023-2030* ($)
Figure 154 Company 8 IoT in healthcare Market Net Revenue Share, By Business segments, 2023 (%)
Figure 155 Company 8 IoT in healthcare Market Net Sales Share, By Geography, 2023 (%)
Figure 156 Company 9 IoT in healthcare Market Net Revenue, By Years, 2023-2030* ($)
Figure 157 Company 9 IoT in healthcare Market Net Revenue Share, By Business segments, 2023 (%)
Figure 158 Company 9 IoT in healthcare Market Net Sales Share, By Geography, 2023 (%)
Figure 159 Company 10 IoT in healthcare Market Net Revenue, By Years, 2023-2030* ($)
Figure 160 Company 10 IoT in healthcare Market Net Revenue Share, By Business segments, 2023 (%)
Figure 161 Company 10 IoT in healthcare Market Net Sales Share, By Geography, 2023 (%)
Figure 162 Company 11 IoT in healthcare Market Net Revenue, By Years, 2023-2030* ($)
Figure 163 Company 11 IoT in healthcare Market Net Revenue Share, By Business segments, 2023 (%)
Figure 164 Company 11 IoT in healthcare Market Net Sales Share, By Geography, 2023 (%)
Figure 165 Company 12 IoT in healthcare Market Net Revenue, By Years, 2023-2030* ($)
Figure 166 Company 12 IoT in healthcare Market Net Revenue Share, By Business segments, 2023 (%)
Figure 167 Company 12 IoT in healthcare Market Net Sales Share, By Geography, 2023 (%)
Figure 168 Company 13IoT in healthcare Market Net Revenue, By Years, 2023-2030* ($)
Figure 169 Company 13IoT in healthcare Market Net Revenue Share, By Business segments, 2023 (%)
Figure 170 Company 13IoT in healthcare Market Net Sales Share, By Geography, 2023 (%)
Figure 171 Company 14 IoT in healthcare Market Net Revenue, By Years, 2023-2030* ($)
Figure 172 Company 14 IoT in healthcare Market Net Revenue Share, By Business segments, 2023 (%)
Figure 173 Company 14 IoT in healthcare Market Net Sales Share, By Geography, 2023 (%)
Figure 174 Company 15 IoT in healthcare Market Net Revenue, By Years, 2023-2030* ($)
Figure 175 Company 15 IoT in healthcare Market Net Revenue Share, By Business segments, 2023 (%)
Figure 176 Company 15 IoT in healthcare Market Net Sales Share, By Geography, 2023 (%)