 Email
Email Print
Print


Glucose Sensor Market - By Diabetes Type , By Product Type , By Technology, By Application & By Geography - Forecast(2024 - 2030)
Glucose Sensor Market
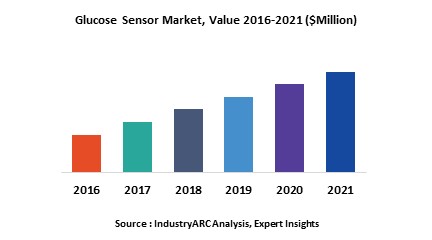
Glucose Sensor Market Size is forecast to reach $ 14619.6 Million by 2030, at a CAGR of 9.40% during forecast period 2024-2030.Diabetes is associated with increased level of blood sugar over extended period of time. This disease is most prevalent metabolic disorder all over the world. Glucose sensor is a device used for testing the concentration of glucose in the blood. This disease has significantly affected huge percentage of population including individuals of all age groups. This has increased the health concerns among the people worldwide and indirectly boosted the growth of blood glucose monitoring devices and sensors.
The report gives precise and comprehensive insights on the market trends and dynamics that are shaping this dynamic industry. These includes the major factors driving the growth of the market, factors inhibiting or restraining the market growth and the major challenges faced by the industry. The rise in the diabetes patients owing to the modern lifestyle and obesity across the world is the major factor driving the growth of glucose sensor market. Moreover, the spreading awareness related to the cure of diabetes and steps taken by healthcare professionals, doctors, insurance companies and other health management companies to educate diabetes patients has proliferated the demand for glucose sensors and self-monitoring devices in the healthcare industry. However, the expense associated with the product and unawareness of disease in some countries are the major challenges in the market.
The report classifies the global glucose sensor market in different sections – market by diabetes type, market by product type, by technology, by applications, and geography. The glucose sensor market has been analyzed based on the Type 1 and Type 2 diabetes. Moreover, the products in the glucose sensor market has been identified which includes non-invasive, minimally invasive, and invasive. The market for these products categories and the sub-products is estimated and projected form 2015 to 2021 in the report. Besides, the report also tracks the major glucose sensor technologies including Photo Acoustic Spectroscopy, Optical Coherence Tomography, Polarimetry, Fluorescence, MIR Spectroscopy, NIR Spectroscopy, Impedance Spectroscopy, Skin Suction Blister Technique, Sonophoresis, and Reverse Iontophoresis. The major applications where the glucose sensors are used includes hosptials, diagnostics labs, clinics, and home-care. The report is also analyzed based on geographic regions that comprises of Americas, Europe, APAC and others to provide comprehensive analysis about the market. The report also analyzes the different factors in the value chain of the glucose sensor market and also focused on pricing analysis.
Unites States accounts for the largest share of diabetes affected population and hence is the highest revenue generating country in the glucose sensors market. Besides, the emerging economies of China, India and other Pacific countries has created huge opportunities for this market owing to expanding economies and rising affluence in these countries.
The report gives detailed insights on the competitiveness of the glucose sensor market. The report gives detailed insights on the key business strategies and developments adopted by the key vendors in the market.
The major manufacturers that are profiled in the report are:
- Abbott Diagnostics
- Pinnacle Technologies, Inc.
- Life Scan
- Bayer Healthcare
- DexCom Inc.
Key Market Players:
The Top 5 companies in the Glucose Sensor Market are:
- Abbott Laboratories
- F. Hoffman La Roche
- Medtronic
- Johnson & Johnson
- Dexcom
For more Lifesciences and Healthcare Market reports, please click here
List of Tables:
Table 1: Glucose Sensor Market Overview 2023-2030
Table 2: Glucose Sensor Market Leader Analysis 2023-2030 (US$)
Table 3: Glucose Sensor Market Product Analysis 2023-2030 (US$)
Table 4: Glucose Sensor Market End User Analysis 2023-2030 (US$)
Table 5: Glucose Sensor Market Patent Analysis 2013-2023* (US$)
Table 6: Glucose Sensor Market Financial Analysis 2023-2030 (US$)
Table 7: Glucose Sensor Market Driver Analysis 2023-2030 (US$)
Table 8: Glucose Sensor Market Challenges Analysis 2023-2030 (US$)
Table 9: Glucose Sensor Market Constraint Analysis 2023-2030 (US$)
Table 10: Glucose Sensor Market Supplier Bargaining Power Analysis 2023-2030 (US$)
Table 11: Glucose Sensor Market Buyer Bargaining Power Analysis 2023-2030 (US$)
Table 12: Glucose Sensor Market Threat of Substitutes Analysis 2023-2030 (US$)
Table 13: Glucose Sensor Market Threat of New Entrants Analysis 2023-2030 (US$)
Table 14: Glucose Sensor Market Degree of Competition Analysis 2023-2030 (US$)
Table 15: Glucose Sensor Market Value Chain Analysis 2023-2030 (US$)
Table 16: Glucose Sensor Market Pricing Analysis 2023-2030 (US$)
Table 17: Glucose Sensor Market Opportunities Analysis 2023-2030 (US$)
Table 18: Glucose Sensor Market Product Life Cycle Analysis 2023-2030 (US$)
Table 19: Glucose Sensor Market Supplier Analysis 2023-2030 (US$)
Table 20: Glucose Sensor Market Distributor Analysis 2023-2030 (US$)
Table 21: Glucose Sensor Market Trend Analysis 2023-2030 (US$)
Table 22: Glucose Sensor Market Size 2023 (US$)
Table 23: Glucose Sensor Market Forecast Analysis 2023-2030 (US$)
Table 24: Glucose Sensor Market Sales Forecast Analysis 2023-2030 (Units)
Table 25: Glucose Sensor Market, Revenue & Volume, By Diabetes Type, 2023-2030 ($)
Table 26: Glucose Sensor Market By Diabetes Type, Revenue & Volume, By Diabetes Type 1, 2023-2030 ($)
Table 27: Glucose Sensor Market By Diabetes Type, Revenue & Volume, By Diabetes Type 2, 2023-2030 ($)
Table 28: Glucose Sensor Market, Revenue & Volume, By Product Type, 2023-2030 ($)
Table 29: Glucose Sensor Market By Product Type, Revenue & Volume, By Non-Invasive, 2023-2030 ($)
Table 30: Glucose Sensor Market By Product Type, Revenue & Volume, By Minimally invasive, 2023-2030 ($)
Table 31: Glucose Sensor Market By Product Type, Revenue & Volume, By Invasive, 2023-2030 ($)
Table 32: Glucose Sensor Market, Revenue & Volume, By Technology, 2023-2030 ($)
Table 33: Glucose Sensor Market By Technology, Revenue & Volume, By Photo Acoustic Spectroscopy, 2023-2030 ($)
Table 34: Glucose Sensor Market By Technology, Revenue & Volume, By Optical Coherence Tomography, 2023-2030 ($)
Table 35: Glucose Sensor Market By Technology, Revenue & Volume, By Polarimetry, 2023-2030 ($)
Table 36: Glucose Sensor Market By Technology, Revenue & Volume, By Fluorescence, 2023-2030 ($)
Table 37: Glucose Sensor Market By Technology, Revenue & Volume, By MIR Spectroscopy, 2023-2030 ($)
Table 38: Glucose Sensor Market, Revenue & Volume, By Application, 2023-2030 ($)
Table 39: Glucose Sensor Market By Application, Revenue & Volume, By Multispecialty Hospitals, 2023-2030 ($)
Table 40: Glucose Sensor Market By Application, Revenue & Volume, By Laboratories, 2023-2030 ($)
Table 41: Glucose Sensor Market By Application, Revenue & Volume, By Clinics, 2023-2030 ($)
Table 42: Glucose Sensor Market By Application, Revenue & Volume, By Home-care, 2023-2030 ($)
Table 43: North America Glucose Sensor Market, Revenue & Volume, By Diabetes Type, 2023-2030 ($)
Table 44: North America Glucose Sensor Market, Revenue & Volume, By Product Type, 2023-2030 ($)
Table 45: North America Glucose Sensor Market, Revenue & Volume, By Technology, 2023-2030 ($)
Table 46: North America Glucose Sensor Market, Revenue & Volume, By Application, 2023-2030 ($)
Table 47: South america Glucose Sensor Market, Revenue & Volume, By Diabetes Type, 2023-2030 ($)
Table 48: South america Glucose Sensor Market, Revenue & Volume, By Product Type, 2023-2030 ($)
Table 49: South america Glucose Sensor Market, Revenue & Volume, By Technology, 2023-2030 ($)
Table 50: South america Glucose Sensor Market, Revenue & Volume, By Application, 2023-2030 ($)
Table 51: Europe Glucose Sensor Market, Revenue & Volume, By Diabetes Type, 2023-2030 ($)
Table 52: Europe Glucose Sensor Market, Revenue & Volume, By Product Type, 2023-2030 ($)
Table 53: Europe Glucose Sensor Market, Revenue & Volume, By Technology, 2023-2030 ($)
Table 54: Europe Glucose Sensor Market, Revenue & Volume, By Application, 2023-2030 ($)
Table 55: APAC Glucose Sensor Market, Revenue & Volume, By Diabetes Type, 2023-2030 ($)
Table 56: APAC Glucose Sensor Market, Revenue & Volume, By Product Type, 2023-2030 ($)
Table 57: APAC Glucose Sensor Market, Revenue & Volume, By Technology, 2023-2030 ($)
Table 58: APAC Glucose Sensor Market, Revenue & Volume, By Application, 2023-2030 ($)
Table 59: Middle East & Africa Glucose Sensor Market, Revenue & Volume, By Diabetes Type, 2023-2030 ($)
Table 60: Middle East & Africa Glucose Sensor Market, Revenue & Volume, By Product Type, 2023-2030 ($)
Table 61: Middle East & Africa Glucose Sensor Market, Revenue & Volume, By Technology, 2023-2030 ($)
Table 62: Middle East & Africa Glucose Sensor Market, Revenue & Volume, By Application, 2023-2030 ($)
Table 63: Russia Glucose Sensor Market, Revenue & Volume, By Diabetes Type, 2023-2030 ($)
Table 64: Russia Glucose Sensor Market, Revenue & Volume, By Product Type, 2023-2030 ($)
Table 65: Russia Glucose Sensor Market, Revenue & Volume, By Technology, 2023-2030 ($)
Table 66: Russia Glucose Sensor Market, Revenue & Volume, By Application, 2023-2030 ($)
Table 67: Israel Glucose Sensor Market, Revenue & Volume, By Diabetes Type, 2023-2030 ($)
Table 68: Israel Glucose Sensor Market, Revenue & Volume, By Product Type, 2023-2030 ($)
Table 69: Israel Glucose Sensor Market, Revenue & Volume, By Technology, 2023-2030 ($)
Table 70: Israel Glucose Sensor Market, Revenue & Volume, By Application, 2023-2030 ($)
Table 71: Top Companies 2023 (US$) Glucose Sensor Market, Revenue & Volume
Table 72: Product Launch 2023-2030 Glucose Sensor Market, Revenue & Volume
Table 73: Mergers & Acquistions 2023-2030 Glucose Sensor Market, Revenue & Volume
List of Figures:
Figure 1: Overview of Glucose Sensor Market 2023-2030
Figure 2: Market Share Analysis for Glucose Sensor Market 2023 (US$)
Figure 3: Product Comparison in Glucose Sensor Market 2023-2030 (US$)
Figure 4: End User Profile for Glucose Sensor Market 2023-2030 (US$)
Figure 5: Patent Application and Grant in Glucose Sensor Market 2013-2023* (US$)
Figure 6: Top 5 Companies Financial Analysis in Glucose Sensor Market 2023-2030 (US$)
Figure 7: Market Entry Strategy in Glucose Sensor Market 2023-2030
Figure 8: Ecosystem Analysis in Glucose Sensor Market 2023
Figure 9: Average Selling Price in Glucose Sensor Market 2023-2030
Figure 10: Top Opportunites in Glucose Sensor Market 2023-2030
Figure 11: Market Life Cycle Analysis in Glucose Sensor Market
Figure 12: GlobalBy Diabetes Type Glucose Sensor Market Revenue, 2023-2030 ($)
Figure 13: GlobalBy Product Type Glucose Sensor Market Revenue, 2023-2030 ($)
Figure 14: GlobalBy Technology Glucose Sensor Market Revenue, 2023-2030 ($)
Figure 15: GlobalBy Application Glucose Sensor Market Revenue, 2023-2030 ($)
Figure 16: Global Glucose Sensor Market - By Geography
Figure 17: Global Glucose Sensor Market Value & Volume, By Geography, 2023-2030 ($)
Figure 18: Global Glucose Sensor Market CAGR, By Geography, 2023-2030 (%)
Figure 19: North America Glucose Sensor Market Value & Volume, 2023-2030 ($)
Figure 20: US Glucose Sensor Market Value & Volume, 2023-2030 ($)
Figure 21: US GDP and Population, 2023-2030 ($)
Figure 22: US GDP – Composition of 2023, By Sector of Origin
Figure 23: US Export and Import Value & Volume, 2023-2030 ($)
Figure 24: Canada Glucose Sensor Market Value & Volume, 2023-2030 ($)
Figure 25: Canada GDP and Population, 2023-2030 ($)
Figure 26: Canada GDP – Composition of 2023, By Sector of Origin
Figure 27: Canada Export and Import Value & Volume, 2023-2030 ($)
Figure 28: Mexico Glucose Sensor Market Value & Volume, 2023-2030 ($)
Figure 29: Mexico GDP and Population, 2023-2030 ($)
Figure 30: Mexico GDP – Composition of 2023, By Sector of Origin
Figure 31: Mexico Export and Import Value & Volume, 2023-2030 ($)
Figure 32: South America Glucose Sensor Market Value & Volume, 2023-2030 ($)
Figure 33: Brazil Glucose Sensor Market Value & Volume, 2023-2030 ($)
Figure 34: Brazil GDP and Population, 2023-2030 ($)
Figure 35: Brazil GDP – Composition of 2023, By Sector of Origin
Figure 36: Brazil Export and Import Value & Volume, 2023-2030 ($)
Figure 37: Venezuela Glucose Sensor Market Value & Volume, 2023-2030 ($)
Figure 38: Venezuela GDP and Population, 2023-2030 ($)
Figure 39: Venezuela GDP – Composition of 2023, By Sector of Origin
Figure 40: Venezuela Export and Import Value & Volume, 2023-2030 ($)
Figure 41: Argentina Glucose Sensor Market Value & Volume, 2023-2030 ($)
Figure 42: Argentina GDP and Population, 2023-2030 ($)
Figure 43: Argentina GDP – Composition of 2023, By Sector of Origin
Figure 44: Argentina Export and Import Value & Volume, 2023-2030 ($)
Figure 45: Ecuador Glucose Sensor Market Value & Volume, 2023-2030 ($)
Figure 46: Ecuador GDP and Population, 2023-2030 ($)
Figure 47: Ecuador GDP – Composition of 2023, By Sector of Origin
Figure 48: Ecuador Export and Import Value & Volume, 2023-2030 ($)
Figure 49: Peru Glucose Sensor Market Value & Volume, 2023-2030 ($)
Figure 50: Peru GDP and Population, 2023-2030 ($)
Figure 51: Peru GDP – Composition of 2023, By Sector of Origin
Figure 52: Peru Export and Import Value & Volume, 2023-2030 ($)
Figure 53: Colombia Glucose Sensor Market Value & Volume, 2023-2030 ($)
Figure 54: Colombia GDP and Population, 2023-2030 ($)
Figure 55: Colombia GDP – Composition of 2023, By Sector of Origin
Figure 56: Colombia Export and Import Value & Volume, 2023-2030 ($)
Figure 57: Costa Rica Glucose Sensor Market Value & Volume, 2023-2030 ($)
Figure 58: Costa Rica GDP and Population, 2023-2030 ($)
Figure 59: Costa Rica GDP – Composition of 2023, By Sector of Origin
Figure 60: Costa Rica Export and Import Value & Volume, 2023-2030 ($)
Figure 61: Europe Glucose Sensor Market Value & Volume, 2023-2030 ($)
Figure 62: U.K Glucose Sensor Market Value & Volume, 2023-2030 ($)
Figure 63: U.K GDP and Population, 2023-2030 ($)
Figure 64: U.K GDP – Composition of 2023, By Sector of Origin
Figure 65: U.K Export and Import Value & Volume, 2023-2030 ($)
Figure 66: Germany Glucose Sensor Market Value & Volume, 2023-2030 ($)
Figure 67: Germany GDP and Population, 2023-2030 ($)
Figure 68: Germany GDP – Composition of 2023, By Sector of Origin
Figure 69: Germany Export and Import Value & Volume, 2023-2030 ($)
Figure 70: Italy Glucose Sensor Market Value & Volume, 2023-2030 ($)
Figure 71: Italy GDP and Population, 2023-2030 ($)
Figure 72: Italy GDP – Composition of 2023, By Sector of Origin
Figure 73: Italy Export and Import Value & Volume, 2023-2030 ($)
Figure 74: France Glucose Sensor Market Value & Volume, 2023-2030 ($)
Figure 75: France GDP and Population, 2023-2030 ($)
Figure 76: France GDP – Composition of 2023, By Sector of Origin
Figure 77: France Export and Import Value & Volume, 2023-2030 ($)
Figure 78: Netherlands Glucose Sensor Market Value & Volume, 2023-2030 ($)
Figure 79: Netherlands GDP and Population, 2023-2030 ($)
Figure 80: Netherlands GDP – Composition of 2023, By Sector of Origin
Figure 81: Netherlands Export and Import Value & Volume, 2023-2030 ($)
Figure 82: Belgium Glucose Sensor Market Value & Volume, 2023-2030 ($)
Figure 83: Belgium GDP and Population, 2023-2030 ($)
Figure 84: Belgium GDP – Composition of 2023, By Sector of Origin
Figure 85: Belgium Export and Import Value & Volume, 2023-2030 ($)
Figure 86: Spain Glucose Sensor Market Value & Volume, 2023-2030 ($)
Figure 87: Spain GDP and Population, 2023-2030 ($)
Figure 88: Spain GDP – Composition of 2023, By Sector of Origin
Figure 89: Spain Export and Import Value & Volume, 2023-2030 ($)
Figure 90: Denmark Glucose Sensor Market Value & Volume, 2023-2030 ($)
Figure 91: Denmark GDP and Population, 2023-2030 ($)
Figure 92: Denmark GDP – Composition of 2023, By Sector of Origin
Figure 93: Denmark Export and Import Value & Volume, 2023-2030 ($)
Figure 94: APAC Glucose Sensor Market Value & Volume, 2023-2030 ($)
Figure 95: China Glucose Sensor Market Value & Volume, 2023-2030
Figure 96: China GDP and Population, 2023-2030 ($)
Figure 97: China GDP – Composition of 2023, By Sector of Origin
Figure 98: China Export and Import Value & Volume, 2023-2030 ($) Glucose Sensor Market China Export and Import Value & Volume, 2023-2030 ($)
Figure 99: Australia Glucose Sensor Market Value & Volume, 2023-2030 ($)
Figure 100: Australia GDP and Population, 2023-2030 ($)
Figure 101: Australia GDP – Composition of 2023, By Sector of Origin
Figure 102: Australia Export and Import Value & Volume, 2023-2030 ($)
Figure 103: South Korea Glucose Sensor Market Value & Volume, 2023-2030 ($)
Figure 104: South Korea GDP and Population, 2023-2030 ($)
Figure 105: South Korea GDP – Composition of 2023, By Sector of Origin
Figure 106: South Korea Export and Import Value & Volume, 2023-2030 ($)
Figure 107: India Glucose Sensor Market Value & Volume, 2023-2030 ($)
Figure 108: India GDP and Population, 2023-2030 ($)
Figure 109: India GDP – Composition of 2023, By Sector of Origin
Figure 110: India Export and Import Value & Volume, 2023-2030 ($)
Figure 111: Taiwan Glucose Sensor Market Value & Volume, 2023-2030 ($)
Figure 112: Taiwan GDP and Population, 2023-2030 ($)
Figure 113: Taiwan GDP – Composition of 2023, By Sector of Origin
Figure 114: Taiwan Export and Import Value & Volume, 2023-2030 ($)
Figure 115: Malaysia Glucose Sensor Market Value & Volume, 2023-2030 ($)
Figure 116: Malaysia GDP and Population, 2023-2030 ($)
Figure 117: Malaysia GDP – Composition of 2023, By Sector of Origin
Figure 118: Malaysia Export and Import Value & Volume, 2023-2030 ($)
Figure 119: Hong Kong Glucose Sensor Market Value & Volume, 2023-2030 ($)
Figure 120: Hong Kong GDP and Population, 2023-2030 ($)
Figure 121: Hong Kong GDP – Composition of 2023, By Sector of Origin
Figure 122: Hong Kong Export and Import Value & Volume, 2023-2030 ($)
Figure 123: Middle East & Africa Glucose Sensor Market Middle East & Africa 3D Printing Market Value & Volume, 2023-2030 ($)
Figure 124: Russia Glucose Sensor Market Value & Volume, 2023-2030 ($)
Figure 125: Russia GDP and Population, 2023-2030 ($)
Figure 126: Russia GDP – Composition of 2023, By Sector of Origin
Figure 127: Russia Export and Import Value & Volume, 2023-2030 ($)
Figure 128: Israel Glucose Sensor Market Value & Volume, 2023-2030 ($)
Figure 129: Israel GDP and Population, 2023-2030 ($)
Figure 130: Israel GDP – Composition of 2023, By Sector of Origin
Figure 131: Israel Export and Import Value & Volume, 2023-2030 ($)
Figure 132: Entropy Share, By Strategies, 2023-2030* (%) Glucose Sensor Market
Figure 133: Developments, 2023-2030* Glucose Sensor Market
Figure 134: Company 1 Glucose Sensor Market Net Revenue, By Years, 2023-2030* ($)
Figure 135: Company 1 Glucose Sensor Market Net Revenue Share, By Business segments, 2023 (%)
Figure 136: Company 1 Glucose Sensor Market Net Sales Share, By Geography, 2023 (%)
Figure 137: Company 2 Glucose Sensor Market Net Revenue, By Years, 2023-2030* ($)
Figure 138: Company 2 Glucose Sensor Market Net Revenue Share, By Business segments, 2023 (%)
Figure 139: Company 2 Glucose Sensor Market Net Sales Share, By Geography, 2023 (%)
Figure 140: Company 3 Glucose Sensor Market Net Revenue, By Years, 2023-2030* ($)
Figure 141: Company 3 Glucose Sensor Market Net Revenue Share, By Business segments, 2023 (%)
Figure 142: Company 3 Glucose Sensor Market Net Sales Share, By Geography, 2023 (%)
Figure 143: Company 4 Glucose Sensor Market Net Revenue, By Years, 2023-2030* ($)
Figure 144: Company 4 Glucose Sensor Market Net Revenue Share, By Business segments, 2023 (%)
Figure 145: Company 4 Glucose Sensor Market Net Sales Share, By Geography, 2023 (%)
Figure 146: Company 5 Glucose Sensor Market Net Revenue, By Years, 2023-2030* ($)
Figure 147: Company 5 Glucose Sensor Market Net Revenue Share, By Business segments, 2023 (%)
Figure 148: Company 5 Glucose Sensor Market Net Sales Share, By Geography, 2023 (%)
Figure 149: Company 6 Glucose Sensor Market Net Revenue, By Years, 2023-2030* ($)
Figure 150: Company 6 Glucose Sensor Market Net Revenue Share, By Business segments, 2023 (%)
Figure 151: Company 6 Glucose Sensor Market Net Sales Share, By Geography, 2023 (%)
Figure 152: Company 7 Glucose Sensor Market Net Revenue, By Years, 2023-2030* ($)
Figure 153: Company 7 Glucose Sensor Market Net Revenue Share, By Business segments, 2023 (%)
Figure 154: Company 7 Glucose Sensor Market Net Sales Share, By Geography, 2023 (%)
Figure 155: Company 8 Glucose Sensor Market Net Revenue, By Years, 2023-2030* ($)
Figure 156: Company 8 Glucose Sensor Market Net Revenue Share, By Business segments, 2023 (%)
Figure 157: Company 8 Glucose Sensor Market Net Sales Share, By Geography, 2023 (%)
Figure 158: Company 9 Glucose Sensor Market Net Revenue, By Years, 2023-2030* ($)
Figure 159: Company 9 Glucose Sensor Market Net Revenue Share, By Business segments, 2023 (%)
Figure 160: Company 9 Glucose Sensor Market Net Sales Share, By Geography, 2023 (%)
Figure 161: Company 10 Glucose Sensor Market Net Revenue, By Years, 2023-2030* ($)
Figure 162: Company 10 Glucose Sensor Market Net Revenue Share, By Business segments, 2023 (%)
Figure 163: Company 10 Glucose Sensor Market Net Sales Share, By Geography, 2023 (%)
Figure 164: Company 11 Glucose Sensor Market Net Revenue, By Years, 2023-2030* ($)
Figure 165: Company 11 Glucose Sensor Market Net Revenue Share, By Business segments, 2023 (%)
Figure 166: Company 11 Glucose Sensor Market Net Sales Share, By Geography, 2023 (%)
Figure 167: Company 12 Glucose Sensor Market Net Revenue, By Years, 2023-2030* ($)
Figure 168: Company 12 Glucose Sensor Market Net Revenue Share, By Business segments, 2023 (%)
Figure 169: Company 12 Glucose Sensor Market Net Sales Share, By Geography, 2023 (%)
Figure 170: Company 13 Glucose Sensor Market Net Revenue, By Years, 2023-2030* ($)
Figure 171: Company 13 Glucose Sensor Market Net Revenue Share, By Business segments, 2023 (%)
Figure 172: Company 13 Glucose Sensor Market Net Sales Share, By Geography, 2023 (%)
Figure 173: Company 14 Glucose Sensor Market Net Revenue, By Years, 2023-2030* ($)
Figure 174: Company 14 Glucose Sensor Market Net Revenue Share, By Business segments, 2023 (%)
Figure 175: Company 14 Glucose Sensor Market Net Sales Share, By Geography, 2023 (%)
Figure 176: Company 15 Glucose Sensor Market Net Revenue, By Years, 2023-2030* ($)
Figure 177: Company 15 Glucose Sensor Market Net Revenue Share, By Business segments, 2023 (%)
Figure 178: Company 15 Glucose Sensor Market Net Sales Share, By Geography, 2023 (%)