 Email
Email Print
Print


Polyether Ether Ketone Market - Forecast(2025 - 2031)
Polyether Ether Ketone Market Overview
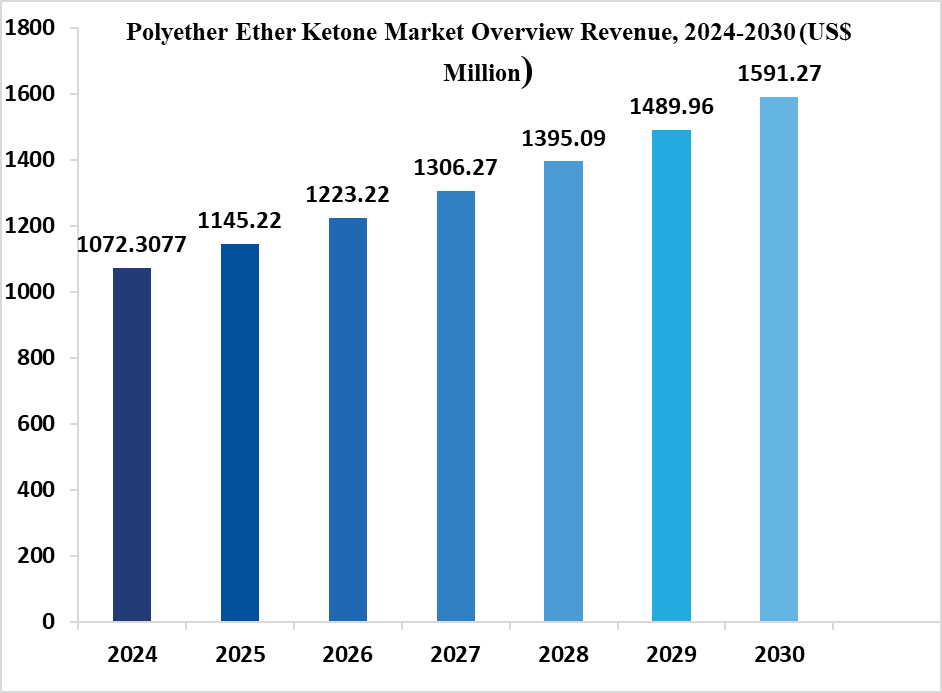
Polyether Ether Ketone Market is forecast to reach $1591.27 million by 2030, after growing at a CAGR of 6.8% during 2024-2030. Polyether ether ketone (PEEK) is a colorless, high strength, and chemical resistance thermoplastic in the polyaryl ether ketone (PAEK) family and is prepared by polymerization of bisphinolate salts. PEEK is replacing stainless steel in impeller wheels for regenerative pumps and provides a significant reduction in wear, reduced noise levels. The comparatively lightweight, better high-temperature performance, and durability as compared to other conventional materials of PEEK is augmenting the demand from the aerospace and automotive industry.
Growing concern towards ill-effects of pollution and pollutants emanating from automobiles has prompted industry participants to resort to automotive light-weighting also bolster the demand for polyether ether ketone in automotive industries. Surging use of PEEK in cable insulation and semiconductor processing further aids the market growth. The growing uses of Diphenyl sulfone, Phenolates, 4,4’-Difluorobenzophenone as a high-temperature solvent is also driving the market growth.
COVID-19 Impact
COVID-19 has badly impacted the Polyether Ether Ketone market. Lack of manpower has led many manufacturing companies to stop their production which further results in their downfall. Electronic, aerospace, oil & gas, and automobile industries are facing huge losses, which in turn affects the demand for Polyether Ether Ketone.
In addition, Toyota Motor Corporation reported a YoY sales decline of 26%, May’s unit sales were almost double that of April, which fell 56% YoY. Sales of new energy vehicles (NEVs) in China, including electric cars, also continue to decline. NEV sales in June fell 35% YoY to 85,600 units, following a drop of 26% in May and 30% in April. Thus decline in the growth of automotive and electronics negatively impacts the polyether ether ketone market.
Report Coverage
The report: “Polyether Ether Ketone Market – Forecast (2024-2030)”, by IndustryARC, covers an in-depth analysis of the following segments of the Polyether Ether Ketone Market.
By Type: Unfilled PEEK, Glass Filled PEEK, Carbon Filled PEEK, and PTFE Filled PEEK
By Application: Bearings, Piston Parts, Pumps, Valves, Cable insulation, Vacuum Belt Filters, Implant Material, Dialysis Pump Filters, Battery Separator, Semiconductor, and Others
By End-Use Industry: Automotive (Passenger Cars, Light Commercial Vehicles (LCV), and Heavy Commercial Vehicles (HCV)), Aerospace (Commercial, Military, and Others), Building & Construction (Residential, Commercial, Infrastructural, and Industrial), Healthcare, Electrical & Electronics, Oil & Gas, and Others
By Geography: North America (US, Canada, and Mexico), Europe (UK, Germany, France, Italy, Netherlands, Spain, Russia, Belgium, and Rest of Europe), Asia-Pacific (China, Japan, India, South Korea, Australia and New Zealand, Indonesia, Taiwan, Malaysia, and Rest of APAC), South America (Brazil, Argentina, Colombia, Chile, and Rest of South America), Rest of the World (Middle East, and Africa)
Key Takeaways
• Chinese Government ambitious plans such as “Made in China 2025”, coupled with India’s Production Linked Incentive (PLI) and Scheme for Promotion of Electronic Components and Semiconductors (SPECS) will flourish electronic industries in the Asian region, which in turn may boost the growth of Polyether Ether Ketone market.
• Rise in demand of Diphenyl sulfone, thermoplastic, Phenolates, 4,4’-Difluorobenzophenone based products from health care industries also contribute to market growth.
• Decline in manufacturing activities and disruption of the supply chain due to the outbreak of coronavirus has hampered the growth of the polyether ether ketone market.
Figure: Polyether Ether Ketone Market Overview Revenue, 2024-2030 (US$ Million)
Polyether Ether Ketone Market Segment Analysis – By Type
Glass-filled PEEK segment held the largest share of more than 38% in the Polyether Ether Ketone market in 2022. Glass-filled PEEK offers higher strength and stiffness over the unfilled grades. The addition of glass fibres significantly reduces the expansion rate and increases the flexural modulus of PEEK. These grades are very appropriate for structural applications carrying high static loads for long periods of time and are widely used in applications where temperature approaches above 300 o Celsius.
Due to high chemical resistance to a wide range of solvents, organics, salts, and bases, glass-filled PEEK is used in the oil and gas industries where steam and chemicals are encountered. Growing demand for products like Diphenyl sulfone and thermoplastic having greater strength and stiffness in aerospace, automotive and electronics industries are fueling the demand for glass-filled polyether ether ketone market.
Polyether Ether Ketone Market Segment Analysis – By Application
Based on the application, the semiconductor segment held the largest share of more than 34% in the Polyether Ether Ketone market in 2022. Polyether ether ketone is used for semiconductor wafer processing applications as a replacement for fluoropolymer materials. In addition to superior mechanical performance over a wide temperature range, PEEK polymer offers lower levels of outgassing, ionic extractable, wear particles, and improved dimensional stability which further enhances the performance of semiconductors.
Growing demand for semiconductors from artificial intelligence (AI), quantum computing, and advanced wireless networks such as 5G will contribute significantly to the polyether ether ketone market’s overall growth.
Polyether Ether Ketone Market Segment Analysis – By End-Use Industry
Automotive segment held the largest share of more than 31% in the Polyether Ether Ketone market in 2023. Polyether ether ketone offers enhanced dry and lubricated surface interaction, outstanding mechanical performance, ease of processing, and excellent fatigue properties. The growing trend of miniatured engine compartments with light-weighted vehicles increases the demand for PEEK as an alternative to metals. PEEKs are used in bearings, under-the-hood-piston units, transmission, washers, braking, and air-conditioning systems.
Increasing demand for automobiles coupled with technology advancement and new R&D initiatives are transforming the automotive industry. According to the Association of Global Automakers, automakers spent more than $178 billion globally on research & development in 2022. Hence, the flourishing automotive industry may drive the growth of the polyether ether ketone market.
Polyether Ether Ketone Market Segment Analysis – By Geography
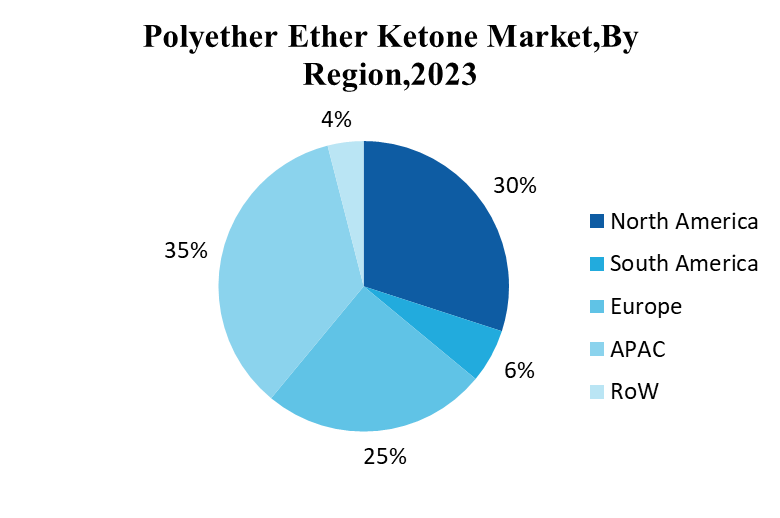
Europe held the largest share in the Polyether Ether Ketone market of more than 25% in 2022, owing to the increasing automotive, aerospace & defense sectors in the region. PEEK polymers and their composites are used as a replacement for aluminum and other metals in several aircraft parts. In the aerospace sector, PEEKs are used in critical engine parts, exterior and interior components as the polymer can withstand high temperature and its inherent flame retardancy and low smoke and toxic gas emission reduce hazard in the event of a fire.
Polyether Ether Ketone Market Drivers
Growing demand from health care industries
Polyether ether ketone has been emerging as an efficient product for implantable devices mainly for spinal surgery and is replacing titanium, which was primarily used for such purposes. PEEK is flexible, durable, and strong in nature and does not harm the human body or skin, therefore it is also useful to repair soft tissues. PEEK is an appropriate choice for dialysis pump filters. Rising health concerns and an increase in health care spending further aids the growth of Polyether Ether Ketone market.
Increasing use of polyether ether ketone in batteries
Polyether ether ketone is considered a high-quality material to produce modern products due to its excellent resistance to acids and chemicals along with controlled porosity. Thermoplastic, Phenolates and 4,4’-Difluorobenzophenoneis are extensively used in PEEK formulation with high thermal stability and good rate capability for lithium-ion batteries. The need of the hour to minimize the carbon dioxide and sulphur dioxide emissions by the combustion of fuels (petrol and diesel) is increasing the demand for electric and hybrid vehicles.
Extensive usage of batteries in electrical gadgets coupled with an increase in demand for electric & hybrid vehicles is increasing the demand for batteries which in turn drives the growth of the polyether ether ketone market.
Polyether Ether Ketone Market - Challenges
Volatility in raw material prices and hydrophobic nature of PEEK
Although polyether ether ketones are widely used in medical implants they will never bonds to bone, unlike titanium due to their hydrophobic nature. Therefore, to achieve a solid fusion, one has to select a filler (inside the cage) that has a high likelihood of fusing. In addition, PEEK has low resistance to UV lights. Volatility in raw material prices also hampers the growth of the market.
Market Landscape
Technology launches, acquisitions and R&D activities are key strategies adopted by players in the Polyether Ether Ketone market report. Major players in the Polyether Ether Ketone market are:
- Evonik Industries AG
- Jilin Joinature Polymer Co., Ltd.
- Pan Jin Zhongrun High Performance Polymer Co.,Ltd
- Solvay
- Victrex
- BARLOG Plastics GmbH
- Polyplastics-Evonik Corporation
- Shandong Haoran Special Plastic Co., Ltd.
- Zhejiang Pengfulong Technology Co., Ltd.
- Zibo Bainaisi Chemical Co.,Ltd and others.
Acquisitions/Technology Launches
• Victrex’s New PEEK Manufacturing Plant in China (2023): In 2022, Victrex plc began commissioning a new PEEK manufacturing plant in China. This plant is expected to begin operating in 2023 with an annual production capacity of 1500 tonnes of PEEK.
Relevant Reports:
Isobutene Market – Forecast (2021 - 2026)
Methyl Ethyl Ketone Market – Forecast (2021 - 2026)
For more Chemicals and Materials Market reports, please click here
1.Polyether Ether Ketone Market- Market Overview
1.1 Definitions and Scope
2. Polyether Ether Ketone Market - Executive Summary
2.1 Key Trends by Type
2.2 Key Trends by Application
2.3 Key Trends by End-Use Industry
2.4 Key Trends by Geography
3. Polyether Ether Ketone Market – Comparative analysis
3.1 Market Share Analysis- Major Companies
3.2 Product Benchmarking- Major Companies
3.3 Top 5 Financials Analysis
3.4 Patent Analysis- Major Companies
3.5 Pricing Analysis (ASPs will be provided)
4. Polyether Ether Ketone Market - Startup companies Scenario Premium Premium Premium
4.1 Major startup company analysis:
4.1.1 Investment
4.1.2 Revenue
4.1.3 Product portfolio
4.1.4 Venture Capital and Funding Scenario
5. Polyether Ether Ketone Market – Industry Market Entry Scenario Premium Premium Premium
5.1 Regulatory Framework Overview
5.2 New Business and Ease of Doing Business Index
5.3 Successful Venture Profiles
5.4 Customer Analysis – Major companies
6. Polyether Ether Ketone Market - Market Forces
6.1 Market Drivers
6.2 Market Constraints
6.3 Porters Five Force Model
6.3.1 Bargaining Power of Suppliers
6.3.2 Bargaining Powers of Buyers
6.3.3 Threat of New Entrants
6.3.4 Competitive Rivalry
6.3.5 Threat of Substitutes
7. Polyether Ether Ketone Market – Strategic Analysis
7.1 Value Chain Analysis
7.2 Opportunity Analysis
7.3 Product/Market Life Cycle
7.4 Distributor Analysis – Major Companies
8. Polyether Ether Ketone Market – By Type (Market Size -$Million/Billion)
8.1 Unfilled PEEK
8.2 Glass Filled PEEK
8.3 Carbon Filled PEEK
8.4 PTFE Filled PEEK
9. Polyether Ether Ketone Market – By Application (Market Size -$Million/Billion)
9.1 Bearings
9.2 Piston Parts
9.3 Pumps
9.4 Valves
9.5 Cable insulation
9.6 Vacuum Belt Filters
9.7 Implant Material
9.8 Dialysis Pump Filters
9.9 Battery Separator
9.10 Semiconductor
9.11 Others
10. Polyether Ether Ketone Market– By End-Use Industry (Market Size -$Million/Billion)
10.1 Automotive
10.1.1 Passenger Cars
10.1.2 Light Commercial Vehicles (LCV)
10.1.3 Heavy Commercial Vehicles (HCV)
10.2 Aerospace
10.2.1 Commercial
10.2.2 Military
10.2.3 Others
10.3 Building & Construction
10.3.1 Residential
10.3.2 Commercial
10.3.3 Infrastructural
10.3.4 Industrial
10.4 Healthcare
10.5 Electrical & Electronics
10.6 Oil & Gas
10.7 Others
11. Polyether Ether Ketone Market - By Geography (Market Size -$Million/Billion)
11.1 North America
11.1.1 US
11.1.2 Canada
11.1.3 Mexico
11.2 Europe
11.2.1 UK
11.2.2 Germany
11.2.3 France
11.2.4 Italy
11.2.5 Netherlands
11.2.6 Spain
11.2.7 Russia
11.2.8 Belgium
11.2.9 Rest of Europe
11.3 Asia-Pacific
11.3.1 China
11.3.2 Japan
11.3.3 India
11.3.4 South Korea
11.3.5 Australia and New Zealand
11.3.6 Indonesia
11.3.7 Taiwan
11.3.8 Malaysia
11.3.9 Rest of APAC
11.4 South America
11.4.1 Brazil
11.4.2 Argentina
11.4.3 Colombia
11.4.4 Chile
11.4.5 Rest of South America
11.5 Rest of the World
11.5.1 Middle East
11.5.1.1 Saudi Arabia
11.5.1.2 U.A.E
11.5.1.3 Israel
11.5.1.4 Rest of the Middle East
11.5.2 Africa
11.5.2.1 South Africa
11.5.2.2 Nigeria
11.5.2.3 Rest of Africa
12. Polyether Ether Ketone Market – Entropy
12.1 New Product Launches
12.2 M&As, Collaborations, JVs and Partnerships
13. Polyether Ether Ketone Market – Market Share Analysis Premium
13.1 Market Share at Global Level - Major companies
13.2 Market Share by Key Region - Major companies
13.3 Market Share by Key Country - Major companies
13.4 Market Share by Key Application - Major companies
13.5 Market Share by Key Product Type/Product category - Major companies
14. Polyether Ether Ketone Market – Key Company List by Country Premium Premium Premium
15. Polyether Ether Ketone Market Company Analysis - Business Overview, Product Portfolio, Financials, and Developments
1. Evonik Industries AG
2. Jilin Joinature Polymer Co., Ltd.
3. Pan Jin Zhongrun High Performance Polymer Co.,Ltd
4. Solvay
5. Victrex
6. BARLOG Plastics GmbH
7. Polyplastics-Evonik Corporation
8. Shandong Haoran Special Plastic Co., Ltd.
9. Zhejiang Pengfulong Technology Co., Ltd.
10. Zibo Bainaisi Chemical Co.,Ltd and others.
16. Polyether Ether Ketone Market- Acquisitions/ Technology Launches.
List of Tables:
Table 1: Polyether Ether Ketone Market Overview 2023-2030
Table 2: Polyether Ether Ketone Market Leader Analysis 2023-2030 (US$)
Table 3: Polyether Ether Ketone Market Product Analysis 2023-2030 (US$)
Table 4: Polyether Ether Ketone Market End User Analysis 2023-2030 (US$)
Table 5: Polyether Ether Ketone Market Patent Analysis 2013-2023* (US$)
Table 6: Polyether Ether Ketone Market Financial Analysis 2023-2030 (US$)
Table 7: Polyether Ether Ketone Market Driver Analysis 2023-2030 (US$)
Table 8: Polyether Ether Ketone Market Challenges Analysis 2023-2030 (US$)
Table 9: Polyether Ether Ketone Market Constraint Analysis 2023-2030 (US$)
Table 10: Polyether Ether Ketone Market Supplier Bargaining Power Analysis 2023-2030 (US$)
Table 11: Polyether Ether Ketone Market Buyer Bargaining Power Analysis 2023-2030 (US$)
Table 12: Polyether Ether Ketone Market Threat of Substitutes Analysis 2023-2030 (US$)
Table 13: Polyether Ether Ketone Market Threat of New Entrants Analysis 2023-2030 (US$)
Table 14: Polyether Ether Ketone Market Degree of Competition Analysis 2023-2030 (US$)
Table 15: Polyether Ether Ketone Market Value Chain Analysis 2023-2030 (US$)
Table 16: Polyether Ether Ketone Market Pricing Analysis 2023-2030 (US$)
Table 17: Polyether Ether Ketone Market Opportunities Analysis 2023-2030 (US$)
Table 18: Polyether Ether Ketone Market Product Life Cycle Analysis 2023-2030 (US$)
Table 19: Polyether Ether Ketone Market Supplier Analysis 2023-2030 (US$)
Table 20: Polyether Ether Ketone Market Distributor Analysis 2023-2030 (US$)
Table 21: Polyether Ether Ketone Market Trend Analysis 2023-2030 (US$)
Table 22: Polyether Ether Ketone Market Size 2023 (US$)
Table 23: Polyether Ether Ketone Market Forecast Analysis 2023-2030 (US$)
Table 24: Polyether Ether Ketone Market Sales Forecast Analysis 2023-2030 (Units)
Table 25: Polyether Ether Ketone Market, Revenue & Volume, By Type, 2023-2030 ($)
Table 26: Polyether Ether Ketone Market By Type, Revenue & Volume, By Unfilled Polyether Ether Ketone, 2023-2030 ($)
Table 27: Polyether Ether Ketone Market By Type, Revenue & Volume, By Carbon Filled Polyether Ether Ketone, 2023-2030 ($)
Table 28: Polyether Ether Ketone Market By Type, Revenue & Volume, By Glass Filled Polyether Ether Ketone, 2023-2030 ($)
Table 29: Polyether Ether Ketone Market By Type, Revenue & Volume, By Others, 2023-2030 ($)
Table 30: Polyether Ether Ketone Market, Revenue & Volume, By End Use, 2023-2030 ($)
Table 31: Polyether Ether Ketone Market By End Use, Revenue & Volume, By Automotive, 2023-2030 ($)
Table 32: Polyether Ether Ketone Market By End Use, Revenue & Volume, By Aerospace, 2023-2030 ($)
Table 33: Polyether Ether Ketone Market By End Use, Revenue & Volume, By Electrical & Electronics, 2023-2030 ($)
Table 34: Polyether Ether Ketone Market By End Use, Revenue & Volume, By Medical, 2023-2030 ($)
Table 35: Polyether Ether Ketone Market By End Use, Revenue & Volume, By Industrial, 2023-2030 ($)
Table 36: North America Polyether Ether Ketone Market, Revenue & Volume, By Type, 2023-2030 ($)
Table 37: North America Polyether Ether Ketone Market, Revenue & Volume, By End Use, 2023-2030 ($)
Table 38: South america Polyether Ether Ketone Market, Revenue & Volume, By Type, 2023-2030 ($)
Table 39: South america Polyether Ether Ketone Market, Revenue & Volume, By End Use, 2023-2030 ($)
Table 40: Europe Polyether Ether Ketone Market, Revenue & Volume, By Type, 2023-2030 ($)
Table 41: Europe Polyether Ether Ketone Market, Revenue & Volume, By End Use, 2023-2030 ($)
Table 42: APAC Polyether Ether Ketone Market, Revenue & Volume, By Type, 2023-2030 ($)
Table 43: APAC Polyether Ether Ketone Market, Revenue & Volume, By End Use, 2023-2030 ($)
Table 44: Middle East & Africa Polyether Ether Ketone Market, Revenue & Volume, By Type, 2023-2030 ($)
Table 45: Middle East & Africa Polyether Ether Ketone Market, Revenue & Volume, By End Use, 2023-2030 ($)
Table 46: Russia Polyether Ether Ketone Market, Revenue & Volume, By Type, 2023-2030 ($)
Table 47: Russia Polyether Ether Ketone Market, Revenue & Volume, By End Use, 2023-2030 ($)
Table 48: Israel Polyether Ether Ketone Market, Revenue & Volume, By Type, 2023-2030 ($)
Table 49: Israel Polyether Ether Ketone Market, Revenue & Volume, By End Use, 2023-2030 ($)
Table 50: Top Companies 2023 (US$)Polyether Ether Ketone Market, Revenue & Volume
Table 51: Product Launch 2023-2030Polyether Ether Ketone Market, Revenue & Volume
Table 52: Mergers & Acquistions 2023-2030Polyether Ether Ketone Market, Revenue & Volume
List of Figures:
Figure 1: Overview of Polyether Ether Ketone Market 2023-2030
Figure 2: Market Share Analysis for Polyether Ether Ketone Market 2023 (US$)
Figure 3: Product Comparison in Polyether Ether Ketone Market 2023-2030 (US$)
Figure 4: End User Profile for Polyether Ether Ketone Market 2023-2030 (US$)
Figure 5: Patent Application and Grant in Polyether Ether Ketone Market 2013-2023* (US$)
Figure 6: Top 5 Companies Financial Analysis in Polyether Ether Ketone Market 2023-2030 (US$)
Figure 7: Market Entry Strategy in Polyether Ether Ketone Market 2023-2030
Figure 8: Ecosystem Analysis in Polyether Ether Ketone Market 2023
Figure 9: Average Selling Price in Polyether Ether Ketone Market 2023-2030
Figure 10: Top Opportunites in Polyether Ether Ketone Market 2023-2030
Figure 11: Market Life Cycle Analysis in Polyether Ether Ketone Market
Figure 12: GlobalBy TypePolyether Ether Ketone Market Revenue, 2023-2030 ($)
Figure 13: GlobalBy End UsePolyether Ether Ketone Market Revenue, 2023-2030 ($)
Figure 14: Global Polyether Ether Ketone Market - By Geography
Figure 15: Global Polyether Ether Ketone Market Value & Volume, By Geography, 2023-2030 ($)
Figure 16: Global Polyether Ether Ketone Market CAGR, By Geography, 2023-2030 (%)
Figure 17: North America Polyether Ether Ketone Market Value & Volume, 2023-2030 ($)
Figure 18: US Polyether Ether Ketone Market Value & Volume, 2023-2030 ($)
Figure 19: US GDP and Population, 2023-2030 ($)
Figure 20: US GDP – Composition of 2023, By Sector of Origin
Figure 21: US Export and Import Value & Volume, 2023-2030 ($)
Figure 22: Canada Polyether Ether Ketone Market Value & Volume, 2023-2030 ($)
Figure 23: Canada GDP and Population, 2023-2030 ($)
Figure 24: Canada GDP – Composition of 2023, By Sector of Origin
Figure 25: Canada Export and Import Value & Volume, 2023-2030 ($)
Figure 26: Mexico Polyether Ether Ketone Market Value & Volume, 2023-2030 ($)
Figure 27: Mexico GDP and Population, 2023-2030 ($)
Figure 28: Mexico GDP – Composition of 2023, By Sector of Origin
Figure 29: Mexico Export and Import Value & Volume, 2023-2030 ($)
Figure 30: South America Polyether Ether Ketone Market Value & Volume, 2023-2030 ($)
Figure 31: Brazil Polyether Ether Ketone Market Value & Volume, 2023-2030 ($)
Figure 32: Brazil GDP and Population, 2023-2030 ($)
Figure 33: Brazil GDP – Composition of 2023, By Sector of Origin
Figure 34: Brazil Export and Import Value & Volume, 2023-2030 ($)
Figure 35: Venezuela Polyether Ether Ketone Market Value & Volume, 2023-2030 ($)
Figure 36: Venezuela GDP and Population, 2023-2030 ($)
Figure 37: Venezuela GDP – Composition of 2023, By Sector of Origin
Figure 38: Venezuela Export and Import Value & Volume, 2023-2030 ($)
Figure 39: Argentina Polyether Ether Ketone Market Value & Volume, 2023-2030 ($)
Figure 40: Argentina GDP and Population, 2023-2030 ($)
Figure 41: Argentina GDP – Composition of 2023, By Sector of Origin
Figure 42: Argentina Export and Import Value & Volume, 2023-2030 ($)
Figure 43: Ecuador Polyether Ether Ketone Market Value & Volume, 2023-2030 ($)
Figure 44: Ecuador GDP and Population, 2023-2030 ($)
Figure 45: Ecuador GDP – Composition of 2023, By Sector of Origin
Figure 46: Ecuador Export and Import Value & Volume, 2023-2030 ($)
Figure 47: Peru Polyether Ether Ketone Market Value & Volume, 2023-2030 ($)
Figure 48: Peru GDP and Population, 2023-2030 ($)
Figure 49: Peru GDP – Composition of 2023, By Sector of Origin
Figure 50: Peru Export and Import Value & Volume, 2023-2030 ($)
Figure 51: Colombia Polyether Ether Ketone Market Value & Volume, 2023-2030 ($)
Figure 52: Colombia GDP and Population, 2023-2030 ($)
Figure 53: Colombia GDP – Composition of 2023, By Sector of Origin
Figure 54: Colombia Export and Import Value & Volume, 2023-2030 ($)
Figure 55: Costa Rica Polyether Ether Ketone Market Value & Volume, 2023-2030 ($)
Figure 56: Costa Rica GDP and Population, 2023-2030 ($)
Figure 57: Costa Rica GDP – Composition of 2023, By Sector of Origin
Figure 58: Costa Rica Export and Import Value & Volume, 2023-2030 ($)
Figure 59: Europe Polyether Ether Ketone Market Value & Volume, 2023-2030 ($)
Figure 60: U.K Polyether Ether Ketone Market Value & Volume, 2023-2030 ($)
Figure 61: U.K GDP and Population, 2023-2030 ($)
Figure 62: U.K GDP – Composition of 2023, By Sector of Origin
Figure 63: U.K Export and Import Value & Volume, 2023-2030 ($)
Figure 64: Germany Polyether Ether Ketone Market Value & Volume, 2023-2030 ($)
Figure 65: Germany GDP and Population, 2023-2030 ($)
Figure 66: Germany GDP – Composition of 2023, By Sector of Origin
Figure 67: Germany Export and Import Value & Volume, 2023-2030 ($)
Figure 68: Italy Polyether Ether Ketone Market Value & Volume, 2023-2030 ($)
Figure 69: Italy GDP and Population, 2023-2030 ($)
Figure 70: Italy GDP – Composition of 2023, By Sector of Origin
Figure 71: Italy Export and Import Value & Volume, 2023-2030 ($)
Figure 72: France Polyether Ether Ketone Market Value & Volume, 2023-2030 ($)
Figure 73: France GDP and Population, 2023-2030 ($)
Figure 74: France GDP – Composition of 2023, By Sector of Origin
Figure 75: France Export and Import Value & Volume, 2023-2030 ($)
Figure 76: Netherlands Polyether Ether Ketone Market Value & Volume, 2023-2030 ($)
Figure 77: Netherlands GDP and Population, 2023-2030 ($)
Figure 78: Netherlands GDP – Composition of 2023, By Sector of Origin
Figure 79: Netherlands Export and Import Value & Volume, 2023-2030 ($)
Figure 80: Belgium Polyether Ether Ketone Market Value & Volume, 2023-2030 ($)
Figure 81: Belgium GDP and Population, 2023-2030 ($)
Figure 82: Belgium GDP – Composition of 2023, By Sector of Origin
Figure 83: Belgium Export and Import Value & Volume, 2023-2030 ($)
Figure 84: Spain Polyether Ether Ketone Market Value & Volume, 2023-2030 ($)
Figure 85: Spain GDP and Population, 2023-2030 ($)
Figure 86: Spain GDP – Composition of 2023, By Sector of Origin
Figure 87: Spain Export and Import Value & Volume, 2023-2030 ($)
Figure 88: Denmark Polyether Ether Ketone Market Value & Volume, 2023-2030 ($)
Figure 89: Denmark GDP and Population, 2023-2030 ($)
Figure 90: Denmark GDP – Composition of 2023, By Sector of Origin
Figure 91: Denmark Export and Import Value & Volume, 2023-2030 ($)
Figure 92: APAC Polyether Ether Ketone Market Value & Volume, 2023-2030 ($)
Figure 93: China Polyether Ether Ketone Market Value & Volume, 2023-2030
Figure 94: China GDP and Population, 2023-2030 ($)
Figure 95: China GDP – Composition of 2023, By Sector of Origin
Figure 96: China Export and Import Value & Volume, 2023-2030 ($)Polyether Ether Ketone Market China Export and Import Value & Volume, 2023-2030 ($)
Figure 97: Australia Polyether Ether Ketone Market Value & Volume, 2023-2030 ($)
Figure 98: Australia GDP and Population, 2023-2030 ($)
Figure 99: Australia GDP – Composition of 2023, By Sector of Origin
Figure 100: Australia Export and Import Value & Volume, 2023-2030 ($)
Figure 101: South Korea Polyether Ether Ketone Market Value & Volume, 2023-2030 ($)
Figure 102: South Korea GDP and Population, 2023-2030 ($)
Figure 103: South Korea GDP – Composition of 2023, By Sector of Origin
Figure 104: South Korea Export and Import Value & Volume, 2023-2030 ($)
Figure 105: India Polyether Ether Ketone Market Value & Volume, 2023-2030 ($)
Figure 106: India GDP and Population, 2023-2030 ($)
Figure 107: India GDP – Composition of 2023, By Sector of Origin
Figure 108: India Export and Import Value & Volume, 2023-2030 ($)
Figure 109: Taiwan Polyether Ether Ketone Market Value & Volume, 2023-2030 ($)
Figure 110: Taiwan GDP and Population, 2023-2030 ($)
Figure 111: Taiwan GDP – Composition of 2023, By Sector of Origin
Figure 112: Taiwan Export and Import Value & Volume, 2023-2030 ($)
Figure 113: Malaysia Polyether Ether Ketone Market Value & Volume, 2023-2030 ($)
Figure 114: Malaysia GDP and Population, 2023-2030 ($)
Figure 115: Malaysia GDP – Composition of 2023, By Sector of Origin
Figure 116: Malaysia Export and Import Value & Volume, 2023-2030 ($)
Figure 117: Hong Kong Polyether Ether Ketone Market Value & Volume, 2023-2030 ($)
Figure 118: Hong Kong GDP and Population, 2023-2030 ($)
Figure 119: Hong Kong GDP – Composition of 2023, By Sector of Origin
Figure 120: Hong Kong Export and Import Value & Volume, 2023-2030 ($)
Figure 121: Middle East & Africa Polyether Ether Ketone Market Middle East & Africa 3D Printing Market Value & Volume, 2023-2030 ($)
Figure 122: Russia Polyether Ether Ketone Market Value & Volume, 2023-2030 ($)
Figure 123: Russia GDP and Population, 2023-2030 ($)
Figure 124: Russia GDP – Composition of 2023, By Sector of Origin
Figure 125: Russia Export and Import Value & Volume, 2023-2030 ($)
Figure 126: Israel Polyether Ether Ketone Market Value & Volume, 2023-2030 ($)
Figure 127: Israel GDP and Population, 2023-2030 ($)
Figure 128: Israel GDP – Composition of 2023, By Sector of Origin
Figure 129: Israel Export and Import Value & Volume, 2023-2030 ($)
Figure 130: Entropy Share, By Strategies, 2023-2030* (%)Polyether Ether Ketone Market
Figure 131: Developments, 2023-2030*Polyether Ether Ketone Market
Figure 132: Company 1 Polyether Ether Ketone Market Net Revenue, By Years, 2023-2030* ($)
Figure 133: Company 1 Polyether Ether Ketone Market Net Revenue Share, By Business segments, 2023 (%)
Figure 134: Company 1 Polyether Ether Ketone Market Net Sales Share, By Geography, 2023 (%)
Figure 135: Company 2 Polyether Ether Ketone Market Net Revenue, By Years, 2023-2030* ($)
Figure 136: Company 2 Polyether Ether Ketone Market Net Revenue Share, By Business segments, 2023 (%)
Figure 137: Company 2 Polyether Ether Ketone Market Net Sales Share, By Geography, 2023 (%)
Figure 138: Company 3 Polyether Ether Ketone Market Net Revenue, By Years, 2023-2030* ($)
Figure 139: Company 3 Polyether Ether Ketone Market Net Revenue Share, By Business segments, 2023 (%)
Figure 140: Company 3 Polyether Ether Ketone Market Net Sales Share, By Geography, 2023 (%)
Figure 141: Company 4 Polyether Ether Ketone Market Net Revenue, By Years, 2023-2030* ($)
Figure 142: Company 4 Polyether Ether Ketone Market Net Revenue Share, By Business segments, 2023 (%)
Figure 143: Company 4 Polyether Ether Ketone Market Net Sales Share, By Geography, 2023 (%)
Figure 144: Company 5 Polyether Ether Ketone Market Net Revenue, By Years, 2023-2030* ($)
Figure 145: Company 5 Polyether Ether Ketone Market Net Revenue Share, By Business segments, 2023 (%)
Figure 146: Company 5 Polyether Ether Ketone Market Net Sales Share, By Geography, 2023 (%)
Figure 147: Company 6 Polyether Ether Ketone Market Net Revenue, By Years, 2023-2030* ($)
Figure 148: Company 6 Polyether Ether Ketone Market Net Revenue Share, By Business segments, 2023 (%)
Figure 149: Company 6 Polyether Ether Ketone Market Net Sales Share, By Geography, 2023 (%)
Figure 150: Company 7 Polyether Ether Ketone Market Net Revenue, By Years, 2023-2030* ($)
Figure 151: Company 7 Polyether Ether Ketone Market Net Revenue Share, By Business segments, 2023 (%)
Figure 152: Company 7 Polyether Ether Ketone Market Net Sales Share, By Geography, 2023 (%)
Figure 153: Company 8 Polyether Ether Ketone Market Net Revenue, By Years, 2023-2030* ($)
Figure 154: Company 8 Polyether Ether Ketone Market Net Revenue Share, By Business segments, 2023 (%)
Figure 155: Company 8 Polyether Ether Ketone Market Net Sales Share, By Geography, 2023 (%)
Figure 156: Company 9 Polyether Ether Ketone Market Net Revenue, By Years, 2023-2030* ($)
Figure 157: Company 9 Polyether Ether Ketone Market Net Revenue Share, By Business segments, 2023 (%)
Figure 158: Company 9 Polyether Ether Ketone Market Net Sales Share, By Geography, 2023 (%)
Figure 159: Company 10 Polyether Ether Ketone Market Net Revenue, By Years, 2023-2030* ($)
Figure 160: Company 10 Polyether Ether Ketone Market Net Revenue Share, By Business segments, 2023 (%)
Figure 161: Company 10 Polyether Ether Ketone Market Net Sales Share, By Geography, 2023 (%)
Figure 162: Company 11 Polyether Ether Ketone Market Net Revenue, By Years, 2023-2030* ($)
Figure 163: Company 11 Polyether Ether Ketone Market Net Revenue Share, By Business segments, 2023 (%)
Figure 164: Company 11 Polyether Ether Ketone Market Net Sales Share, By Geography, 2023 (%)
Figure 165: Company 12 Polyether Ether Ketone Market Net Revenue, By Years, 2023-2030* ($)
Figure 166: Company 12 Polyether Ether Ketone Market Net Revenue Share, By Business segments, 2023 (%)
Figure 167: Company 12 Polyether Ether Ketone Market Net Sales Share, By Geography, 2023 (%)
Figure 168: Company 13 Polyether Ether Ketone Market Net Revenue, By Years, 2023-2030* ($)
Figure 169: Company 13 Polyether Ether Ketone Market Net Revenue Share, By Business segments, 2023 (%)
Figure 170: Company 13 Polyether Ether Ketone Market Net Sales Share, By Geography, 2023 (%)
Figure 171: Company 14 Polyether Ether Ketone Market Net Revenue, By Years, 2023-2030* ($)
Figure 172: Company 14 Polyether Ether Ketone Market Net Revenue Share, By Business segments, 2023 (%)
Figure 173: Company 14 Polyether Ether Ketone Market Net Sales Share, By Geography, 2023 (%)
Figure 174: Company 15 Polyether Ether Ketone Market Net Revenue, By Years, 2023-2030* ($)
Figure 175: Company 15 Polyether Ether Ketone Market Net Revenue Share, By Business segments, 2023 (%)
Figure 176: Company 15 Polyether Ether Ketone Market Net Sales Share, By Geography, 2023 (%)