 Email
Email Print
Print


Polyvinylpyrrolidone Market - Industry Analysis, Market Size, Share, Trends, Application Analysis, Growth And Forecast 2024-2030
Polyvinylpyrrolidone Market Overview:
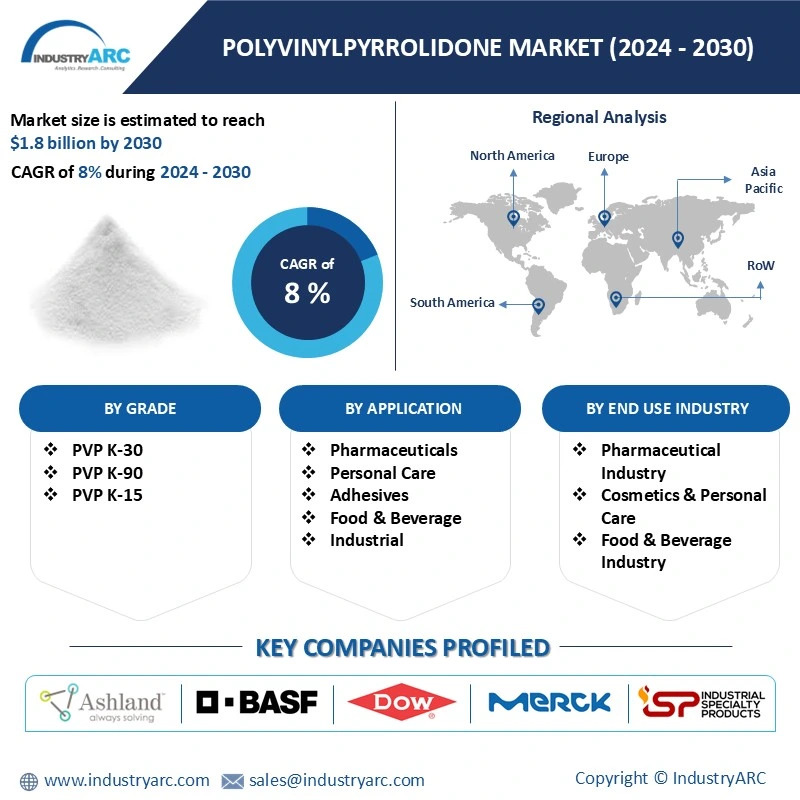
Polyvinylpyrrolidone Market size is forecast to reach $1.8 Billion by 2030, after growing at a CAGR of 8% during 2024-2030. This growth is driven A notable market trend in the polyvinylpyrrolidone (PVP) industry is its extensive utilization in the pharmaceutical sector, primarily as a binder in tablet manufacturing. With major economies globally heavily investing in pharmaceutical development, there is a significant surge in demand for PVP in this segment. The emphasis on drug formulation and manufacturing efficiency is driving the adoption of PVP as a preferred binder due to its excellent binding properties and biocompatibility. This trend reflects the pivotal role of PVP in facilitating pharmaceutical advancements and underscores its prominence as a critical ingredient in tablet formulations worldwide.
Additionally, increasing construction projects, both residential and commercial, are driving the need for PVP in various applications such as coatings, adhesives, and sealants. PVP's properties, including its role as a binder and film-forming agent, make it valuable in construction materials, enhancing their performance and durability. As the construction industry continues to expand globally, the demand for PVP is expected to rise, reflecting its integral role in meeting the needs of the burgeoning construction sector.
Market Snapshot:
Polyvinylpyrrolidone Market - Report Coverage:
The “Polyvinylpyrrolidone Market Report - Forecast (2024-2030)” by IndustryARC, covers an in-depth analysis of the following segments in the Polyvinylpyrrolidone Market.
By Grade: PVP K-30, PVP K-90, PVP K-15.
By Application: Pharmaceuticals, Personal Care, Adhesives, Food & Beverage, Industrial, Others.
By End Use Industry: Pharmaceutical Industry, Cosmetics & Personal Care, Food & Beverage Industry, Adhesive Industry, Others.
By Geography: North America, South America, Europe, APAC, and RoW.
COVID-19 / Ukraine Crisis - Impact Analysis:
• The COVID-19 pandemic has affected the polyvinylpyrrolidone (PVP) market drivers in various ways. Disruptions in global supply chains, lockdown measures, and reduced economic activity have led to fluctuations in raw material prices, impacting production costs for PVP manufacturers. Additionally, demand from key end-use industries like pharmaceuticals, personal care, and adhesives faced fluctuations due to supply chain disruptions and shifts in consumer behavior. While increased demand for hygiene products and pharmaceuticals bolstered PVP usage in certain applications, overall market growth was hindered by reduced consumer spending and delayed project investments. However, the pandemic accelerated trends such as digitalization and e-commerce, prompting companies to adopt innovative strategies to adapt to the changing market landscape.
• The Russia-Ukraine crisis can impact the polyvinylpyrrolidone (PVP) market through several avenues. Disruption in the supply chain of critical raw materials sourced from the region, such as vinylpyrrolidone (VP) monomer, could lead to shortages and price volatility. Geopolitical tensions may also hinder trade routes and logistics, affecting the transportation of PVP and its derivatives. Economic instability resulting from the crisis might dampen consumer demand and investment in industries utilizing PVP, such as pharmaceuticals and personal care. Moreover, uncertainty surrounding the situation can create a risk-averse environment, impeding market growth and investment in the PVP sector until geopolitical tensions subside.
Key Takeaways:
• Asia Pacific emerges as the highest growing geographic market in the polyvinylpyrrolidone (PVP) industry due to rapid industrialization, urbanization, and increasing demand from pharmaceutical, personal care, and adhesive sectors across countries like China, India, and Japan.
• PVP K-15 stands out as the highest growing grade in the polyvinylpyrrolidone (PVP) market due to its versatility in applications such as dispersants, emulsifiers, and stabilizers, catering to diverse industrial needs with effective performance and cost-efficiency.
• The cosmetics and personal care industry stands as the highest growing end-use sector in the polyvinylpyrrolidone (PVP) market due to its widespread application in hair care, skincare, and cosmetic formulations, driven by evolving consumer preferences for innovative and effective beauty products.
Polyvinylpyrrolidone Market Segment Analysis – By Grade
PVP K-15 is experiencing rapid growth in the polyvinylpyrrolidone (PVP) market due to its versatile properties and diverse applications with a CAGR of 8.3% during forecast period 2024-2030. This grade offers excellent dispersing, stabilizing, and thickening capabilities, making it indispensable in industries such as pharmaceuticals, cosmetics, and textiles. Its use as a binder in solid oral dosage forms and as a film-forming agent in topical formulations is driving demand from the pharmaceutical and personal care sectors. Additionally, PVP K-15's role as a dispersant and stabilizer in industrial applications such as ceramics and electronics further contributes to its market growth. As industries continue to demand high-quality and efficient additives, PVP K-15 stands out for its performance and reliability, positioning it as one of the fastest-growing grades in the PVP market.
Polyvinylpyrrolidone Market Segment Analysis – By Application
The pharmaceutical sector stands out as the highest-growing application in the polyvinylpyrrolidone (PVP) market with a CAGR of 8.5% during forecast period 2024-2030. PVP's versatile properties, including its solubilizing, binding, and film-forming abilities, make it indispensable in pharmaceutical formulations. It is widely used as a binder in tablet and capsule formulations, aiding in drug release and stability. Additionally, PVP serves as a disintegrant, improving the dissolution and bioavailability of active pharmaceutical ingredients. Its compatibility with a wide range of drugs and low toxicity further enhances its appeal to pharmaceutical manufacturers. With the increasing prevalence of chronic diseases and the demand for novel drug delivery systems, the pharmaceutical industry's reliance on PVP is expected to continue growing. Moreover, ongoing research and development efforts are exploring innovative applications of PVP in drug delivery, nanomedicine, and personalized medicine, further driving market expansion in the pharmaceutical sector.
Polyvinylpyrrolidone Market Segment Analysis – By End Use Industry
The cosmetics and personal care industry stands out as one of the highest-growing end-use sectors with a CAGR of 8.4% during the forecast period 2024-2030 in the polyvinylpyrrolidone (PVP) market. PVP's versatility and beneficial properties, such as film-forming, adhesive, and thickening capabilities, make it indispensable in a wide range of cosmetic and personal care products. It serves as a key ingredient in hair styling products like gels and mousses, where it provides strong hold and flexibility without flakiness. Additionally, PVP is used in skincare formulations like lotions and creams, acting as a stabilizer and thickener, enhancing product texture and consistency. With the rising demand for innovative and high-performance cosmetics and personal care products globally, the use of PVP is expected to continue growing, driving market expansion and stimulating further innovation in formulations and applications within the cosmetics and personal care industry.
Polyvinylpyrrolidone Market Segment Analysis – By Geography
Asia Pacific dominated the polyvinylpyrrolidone (PVP) industry with the market share of 38% in 2023 due to several factors. Rapid industrialization, urbanization, and increasing disposable incomes in countries like China, India, and Southeast Asian nations are driving the demand for PVP across various applications. The region's burgeoning pharmaceutical and personal care sectors, fueled by a large population base and rising health and beauty consciousness, are significant consumers of PVP. Additionally, the expanding food and beverage industry in Asia Pacific, coupled with the growing demand for processed and packaged foods, further boosts the utilization of PVP as a stabilizer and thickener. Furthermore, favorable government policies, investments in infrastructure, and technological advancements contribute to the region's attractiveness as a lucrative market for PVP manufacturers and suppliers, driving sustained growth in Asia Pacific.

For More Details on This Report - Request for Sample
Polyvinylpyrrolidone Market Drivers
Increasing Use in Adhesives and Sealants
The increasing use of polyvinylpyrrolidone (PVP) in adhesives and sealants is a significant market driver in the PVP industry. PVP's adhesive properties make it a valuable ingredient in various adhesive formulations, enhancing bonding strength and durability in applications such as packaging, construction, and automotive. Its compatibility with a wide range of substrates and ability to improve adhesion under different conditions contribute to its growing adoption in the adhesives sector. Moreover, PVP's versatility extends to sealants, where it acts as a binder, providing excellent sealing properties and adhesion to surfaces. As demand for high-performance adhesives and sealants continues to rise across industries, including packaging, building and construction, and automotive manufacturing, the use of PVP is expected to increase further, driving market growth and innovation in the PVP industry.
Growing Pharmaceutical Industry
The growing pharmaceutical industry serves as a significant market driver for polyvinylpyrrolidone (PVP). PVP's versatile properties, including its ability to enhance solubility, act as a binder, and form films, make it indispensable in pharmaceutical formulations. It is extensively used in tablets, capsules, oral liquids, and topical preparations. With the increasing prevalence of chronic diseases and the global demand for effective medications, the pharmaceutical sector continues to expand rapidly. Furthermore, the trend towards novel drug delivery systems and formulations, such as orally disintegrating tablets and controlled-release formulations, further boosts the demand for PVP. Additionally, the rise in geriatric population and healthcare expenditure contributes to the growth of the pharmaceutical industry, consequently driving the demand for PVP. As pharmaceutical companies focus on developing innovative and patient-friendly formulations, PVP's role in drug development and delivery is expected to remain pivotal, driving market growth in the foreseeable future.
Polyvinylpyrrolidone Market Challenges
Volatility in Raw Material Prices
Volatility in raw material prices presents a significant challenge in the polyvinylpyrrolidone (PVP) market. Key raw materials like vinylpyrrolidone (VP) monomer are subject to price fluctuations influenced by factors such as supply-demand dynamics, geopolitical tensions, and changes in feedstock costs. Such volatility can disrupt production planning and increase manufacturing costs for PVP producers. Furthermore, uncertainty in raw material prices makes it challenging for companies to forecast and manage their operating expenses effectively. To mitigate this challenge, manufacturers may implement hedging strategies or seek long-term supply agreements with reliable suppliers. Additionally, investment in research and development of alternative raw materials or production processes could help reduce dependence on volatile inputs. Overall, managing the impact of raw material price volatility is crucial for maintaining competitiveness and profitability in the PVP market.
Market Landscape
Product/Service launches, approvals, patents and events, acquisitions, partnerships and collaborations are key strategies adopted by players in the Polyvinylpyrrolidone Market. The top 10 companies in this industry are: Ashland Global Holdings Inc., BASF SE, Dow Chemical Company, Merck KGaA, International Specialty Products (ISP) Inc., JRS Pharma GmbH & Co. KG, Nippon Shokubai Co., Ltd., Boai NKY Pharmaceuticals Ltd., Shanghai Yoke Pharmaceuticals Co., Ltd., Hangzhou Motto Science & Technology Co., Ltd.
Developments:
BASF continues to innovate in agriculture. In 2023, they launched Liberty® ULTRA herbicide, a new seed treatment (Poncho® Votivo® Precise), and xarvio® SeedSelect technology for improved yield. They also unveiled ONE SMART SPRAY, their smart farming tech brand, and received approvals for new cotton traits.
Ashland Global Holdings Inc. inaugurated a cutting-edge personal care technical center in Hamburg, Germany, in May 2023. The facility specializes in developing safe antimicrobial solutions for cosmetics, showcasing Ashland's dedication to enhancing hygiene and safety in the personal care industry.
For more Chemicals and Materials Market reports, please click here
1. Polyvinylpyrrolidone Market - Overview
1.1. Definitions and Scope
2. Polyvinylpyrrolidone Market - Executive Summary
2.1. Key Trends by Type
2.2. Key Trends by Indication
2.3. Key Trends by End User
2.4. Key Trends by Intake Method
2.5. Key Trends by Distribution Channel
2.6. Key Trends by Geography
3. Polyvinylpyrrolidone Market - Comparative Analysis
3.1. Company Benchmarking - Key Companies
3.2. Global Financial Analysis - Key Companies
3.3. Market Share Analysis - Key Companies
3.4. Patent Analysis
3.5. Pricing Analysis
4. Polyvinylpyrrolidone Market - Start-up Companies Scenario (Premium)
4.1. Key Start-up Company Analysis by
4.1.1. Investment
4.1.2. Revenue
4.1.3. Venture Capital and Funding Scenario
5. Polyvinylpyrrolidone Market – Market Entry Scenario Premium (Premium)
5.1. Regulatory Framework Overview
5.2. New Business and Ease of Doing Business Index
5.3. Case Studies of Successful Ventures
6. Polyvinylpyrrolidone Market - Forces
6.1. Market Drivers
6.2. Market Constraints
6.3. Market Challenges
6.4. Porter's Five Force Model
6.4.1. Bargaining Power of Suppliers
6.4.2. Bargaining Powers of Customers
6.4.3. Threat of New Entrants
6.4.4. Rivalry Among Existing Players
6.4.5. Threat of Substitutes
7. Polyvinylpyrrolidone Market – Strategic Analysis
7.1. Value Chain Analysis
7.2. Opportunities Analysis
7.3. Market Life Cycle
8. Polyvinylpyrrolidone Market – By Grade (Market Size – $Million/$Billion)
8.1. PVP K-30
8.2. PVP K-90
8.3. PVP K-15
9. Polyvinylpyrrolidone Market – By Application (Market Size – $Million/$Billion)
9.1. Pharmaceuticals
9.2. Personal Care
9.3. Adhesives
9.4. Food & Beverage
9.5. Industrial
9.6. Others
10. Polyvinylpyrrolidone Market – By End Use Industry (Market Size – $Million/$Billion)
10.1. Pharmaceutical Industry
10.2. Cosmetics & Personal Care
10.3. Food & Beverage Industry
10.4. Adhesive Industry
10.5. Others
11. Polyvinylpyrrolidone Market – by Geography (Market Size – $Million/$Billion)
11.1. North America
11.1.1. The U.S.
11.1.2. Canada
11.1.3. Mexico
11.2. Europe
11.2.1. UK
11.2.2. Germany
11.2.3. France
11.2.4. Italy
11.2.5. Spain
11.2.6. Russia
11.2.7. Rest of Europe
11.3. Asia-Pacific
11.3.1. China
11.3.2. India
11.3.3. Japan
11.3.4. South Korea
11.3.5. Australia & New Zealand
11.3.6. Rest of Asia-Pacific
11.4. South America
11.4.1. Brazil
11.4.2. Argentina
11.4.3. Chile
11.4.4. Colombia
11.4.5. Rest of South America
11.5. Rest of the World
11.5.1. Middle East
11.5.2. Africa
12. Polyvinylpyrrolidone Market – Entropy
12.1 New product launches
12.2 M&A’s, collaborations, JVs and partnerships
12.2 M&A’s, collaborations, JVs and partnerships
13. Polyvinylpyrrolidone Market – Industry/Segment Competition Landscape Premium
13.1. Market Share Analysis
13.1.1. Market Share by Product Type – Key Companies
13.1.2. Market Share by Region – Key Companies
13.1.3. Market Share by Country – Key Companies
13.2. Competition Matrix
13.3. Best Practices for Companies
14. Polyvinylpyrrolidone Market – Key Company List by Country Premium Premium
15. Polyvinylpyrrolidone Market - Company Analysis
15.1.Ashland Global Holdings Inc.
15.2.BASF SE
15.3.Dow Chemical Company
15.4.Merck KGaA
15.5.International Specialty Products (ISP) Inc.
15.6.JRS Pharma GmbH & Co. KG
15.7.Nippon Shokubai Co., Ltd.
15.8.Boai NKY Pharmaceuticals Ltd.
15.9.Shanghai Yoke Pharmaceuticals Co., Ltd.
15.10.Hangzhou Motto Science & Technology Co., Ltd.
15.11.Others
• "Financials to the Private Companies would be provided on best-effort basis."
Connect with our experts to get customized reports that best suit your requirements. Our
reports include global-level data, niche markets and competitive landscape.
List of Tables:
Table 1: Polyvinylpyrrolidone Market Overview 2023-2030
Table 2: Polyvinylpyrrolidone Market Leader Analysis 2023-2030 (US$)
Table 3: Polyvinylpyrrolidone Market Patent Analysis 2013-2023* (US$)
Table 4: Polyvinylpyrrolidone Market Financial Analysis 2023-2030 (US$)
Table 5: Polyvinylpyrrolidone Market Driver Analysis 2023-2030 (US$)
Table 6: Polyvinylpyrrolidone Market Challenges Analysis 2023-2030 (US$)
Table 7: Polyvinylpyrrolidone Market Constraint Analysis 2023-2030 (US$)
Table 8: Polyvinylpyrrolidone Market Supplier Bargaining Power Analysis 2023-2030 (US$)
Table 9: Polyvinylpyrrolidone Market Buyer Bargaining Power Analysis 2023-2030 (US$)
Table 10: Polyvinylpyrrolidone Market Threat of Substitutes Analysis 2023-2030 (US$)
Table 11: Polyvinylpyrrolidone Market Threat of New Entrants Analysis 2023-2030 (US$)
Table 12: Polyvinylpyrrolidone Market Degree of Competition Analysis 2023-2030 (US$)
Table 13: Polyvinylpyrrolidone Market Value Chain Analysis 2023-2030 (US$)
Table 14: Polyvinylpyrrolidone Market Pricing Analysis 2023-2030 (US$)
Table 15: Polyvinylpyrrolidone Market Opportunities Analysis 2023-2030 (US$)
Table 16: Polyvinylpyrrolidone Market Supplier Analysis 2023-2030 (US$)
Table 17: Polyvinylpyrrolidone Market Distributor Analysis 2023-2030 (US$)
Table 18: Polyvinylpyrrolidone Market Trend Analysis 2023-2030 (US$)
Table 19: Polyvinylpyrrolidone Market Size 2023 (US$)
Table 20: Polyvinylpyrrolidone Market Forecast Analysis 2023-2030 (US$)
Table 21: Polyvinylpyrrolidone Market Sales Forecast Analysis 2023-2030 (Units)
Table 22: Polyvinylpyrrolidone Market, Revenue & Volume,By Application, 2023-2030 ($)
Table 23: Polyvinylpyrrolidone MarketBy Application, Revenue & Volume,By Adhesives, 2023-2030 ($)
Table 24: Polyvinylpyrrolidone MarketBy Application, Revenue & Volume,By Pharmaceuticals, 2023-2030 ($)
Table 25: Polyvinylpyrrolidone MarketBy Application, Revenue & Volume,By Cosmetics, 2023-2030 ($)
Table 26: Polyvinylpyrrolidone MarketBy Application, Revenue & Volume,By Food & Beverage, 2023-2030 ($)
Table 27: North America Polyvinylpyrrolidone Market, Revenue & Volume,By Application, 2023-2030 ($)
Table 28: South america Polyvinylpyrrolidone Market, Revenue & Volume,By Application, 2023-2030 ($)
Table 29: Europe Polyvinylpyrrolidone Market, Revenue & Volume,By Application, 2023-2030 ($)
Table 30: APAC Polyvinylpyrrolidone Market, Revenue & Volume,By Application, 2023-2030 ($)
Table 31: Middle East & Africa Polyvinylpyrrolidone Market, Revenue & Volume,By Application, 2023-2030 ($)
Table 32: Russia Polyvinylpyrrolidone Market, Revenue & Volume,By Application, 2023-2030 ($)
Table 33: Israel Polyvinylpyrrolidone Market, Revenue & Volume,By Application, 2023-2030 ($)
Table 34: Top Companies 2023 (US$)Polyvinylpyrrolidone Market, Revenue & Volume
Table 35: Mergers & Acquistions 2023-2030Polyvinylpyrrolidone Market, Revenue & Volume
List of Figures:
Figure 1: Overview of Polyvinylpyrrolidone Market 2023-2030
Figure 2: Market Share Analysis for Polyvinylpyrrolidone Market 2023 (US$)
Figure 3: Patent Application and Grant in Polyvinylpyrrolidone Market 2013-2023* (US$)
Figure 4: Top 5 Companies Financial Analysis in Polyvinylpyrrolidone Market 2023-2030 (US$)
Figure 5: Market Entry Strategy in Polyvinylpyrrolidone Market 2023-2030
Figure 6: Ecosystem Analysis in Polyvinylpyrrolidone Market2023
Figure 7: Average Selling Price in Polyvinylpyrrolidone Market 2023-2030
Figure 8: Top Opportunites in Polyvinylpyrrolidone Market 2023-2030
Figure 9: Market Life Cycle Analysis in Polyvinylpyrrolidone Market
Figure 10: GlobalBy ApplicationPolyvinylpyrrolidone Market Revenue, 2023-2030 ($)
Figure 11: Global Polyvinylpyrrolidone Market - By Geography
Figure 12: Global Polyvinylpyrrolidone Market Value & Volume, By Geography, 2023-2030 ($)
Figure 13: Global Polyvinylpyrrolidone Market CAGR, By Geography, 2023-2030 (%)
Figure 14: North America Polyvinylpyrrolidone Market Value & Volume, 2023-2030 ($)
Figure 15: US Polyvinylpyrrolidone Market Value & Volume, 2023-2030 ($)
Figure 16: US GDP and Population, 2023-2030 ($)
Figure 17: US GDP – Composition of 2023, By Sector of Origin
Figure 18: US Export and Import Value & Volume, 2023-2030 ($)
Figure 19: Canada Polyvinylpyrrolidone Market Value & Volume, 2023-2030 ($)
Figure 20: Canada GDP and Population, 2023-2030 ($)
Figure 21: Canada GDP – Composition of 2023, By Sector of Origin
Figure 22: Canada Export and Import Value & Volume, 2023-2030 ($)
Figure 23: Mexico Polyvinylpyrrolidone Market Value & Volume, 2023-2030 ($)
Figure 24: Mexico GDP and Population, 2023-2030 ($)
Figure 25: Mexico GDP – Composition of 2023, By Sector of Origin
Figure 26: Mexico Export and Import Value & Volume, 2023-2030 ($)
Figure 27: South America Polyvinylpyrrolidone MarketSouth America 3D Printing Market Value & Volume, 2023-2030 ($)
Figure 28: Brazil Polyvinylpyrrolidone Market Value & Volume, 2023-2030 ($)
Figure 29: Brazil GDP and Population, 2023-2030 ($)
Figure 30: Brazil GDP – Composition of 2023, By Sector of Origin
Figure 31: Brazil Export and Import Value & Volume, 2023-2030 ($)
Figure 32: Venezuela Polyvinylpyrrolidone Market Value & Volume, 2023-2030 ($)
Figure 33: Venezuela GDP and Population, 2023-2030 ($)
Figure 34: Venezuela GDP – Composition of 2023, By Sector of Origin
Figure 35: Venezuela Export and Import Value & Volume, 2023-2030 ($)
Figure 36: Argentina Polyvinylpyrrolidone Market Value & Volume, 2023-2030 ($)
Figure 37: Argentina GDP and Population, 2023-2030 ($)
Figure 38: Argentina GDP – Composition of 2023, By Sector of Origin
Figure 39: Argentina Export and Import Value & Volume, 2023-2030 ($)
Figure 40: Ecuador Polyvinylpyrrolidone Market Value & Volume, 2023-2030 ($)
Figure 41: Ecuador GDP and Population, 2023-2030 ($)
Figure 42: Ecuador GDP – Composition of 2023, By Sector of Origin
Figure 43: Ecuador Export and Import Value & Volume, 2023-2030 ($)
Figure 44: Peru Polyvinylpyrrolidone Market Value & Volume, 2023-2030 ($)
Figure 45: Peru GDP and Population, 2023-2030 ($)
Figure 46: Peru GDP – Composition of 2023, By Sector of Origin
Figure 47: Peru Export and Import Value & Volume, 2023-2030 ($)
Figure 48: Colombia Polyvinylpyrrolidone Market Value & Volume, 2023-2030 ($)
Figure 49: Colombia GDP and Population, 2023-2030 ($)
Figure 50: Colombia GDP – Composition of 2023, By Sector of Origin
Figure 51: Colombia Export and Import Value & Volume, 2023-2030 ($)
Figure 52: Costa Rica Polyvinylpyrrolidone MarketCosta Rica 3D Printing Market Value & Volume, 2023-2030 ($)
Figure 53: Costa Rica GDP and Population, 2023-2030 ($)
Figure 54: Costa Rica GDP – Composition of 2023, By Sector of Origin
Figure 55: Costa Rica Export and Import Value & Volume, 2023-2030 ($)
Figure 56: Europe Polyvinylpyrrolidone Market Value & Volume, 2023-2030 ($)
Figure 57: U.K Polyvinylpyrrolidone Market Value & Volume, 2023-2030 ($)
Figure 58: U.K GDP and Population, 2023-2030 ($)
Figure 59: U.K GDP – Composition of 2023, By Sector of Origin
Figure 60: U.K Export and Import Value & Volume, 2023-2030 ($)
Figure 61: Germany Polyvinylpyrrolidone Market Value & Volume, 2023-2030 ($)
Figure 62: Germany GDP and Population, 2023-2030 ($)
Figure 63: Germany GDP – Composition of 2023, By Sector of Origin
Figure 64: Germany Export and Import Value & Volume, 2023-2030 ($)
Figure 65: Italy Polyvinylpyrrolidone Market Value & Volume, 2023-2030 ($)
Figure 66: Italy GDP and Population, 2023-2030 ($)
Figure 67: Italy GDP – Composition of 2023, By Sector of Origin
Figure 68: Italy Export and Import Value & Volume, 2023-2030 ($)
Figure 69: France Polyvinylpyrrolidone Market Value & Volume, 2023-2030 ($)
Figure 70: France GDP and Population, 2023-2030 ($)
Figure 71: France GDP – Composition of 2023, By Sector of Origin
Figure 72: France Export and Import Value & Volume, 2023-2030 ($)
Figure 73: Netherlands Polyvinylpyrrolidone Market Value & Volume, 2023-2030 ($)
Figure 74: Netherlands GDP and Population, 2023-2030 ($)
Figure 75: Netherlands GDP – Composition of 2023, By Sector of Origin
Figure 76: Netherlands Export and Import Value & Volume, 2023-2030 ($)
Figure 77: Belgium Polyvinylpyrrolidone Market Value & Volume, 2023-2030 ($)
Figure 78: Belgium GDP and Population, 2023-2030 ($)
Figure 79: Belgium GDP – Composition of 2023, By Sector of Origin
Figure 80: Belgium Export and Import Value & Volume, 2023-2030 ($)
Figure 81: Spain Polyvinylpyrrolidone Market Value & Volume, 2023-2030 ($)
Figure 82: Spain GDP and Population, 2023-2030 ($)
Figure 83: Spain GDP – Composition of 2023, By Sector of Origin
Figure 84: Spain Export and Import Value & Volume, 2023-2030 ($)
Figure 85: Denmark Polyvinylpyrrolidone Market Value & Volume, 2023-2030 ($)
Figure 86: Denmark GDP and Population, 2023-2030 ($)
Figure 87: Denmark GDP – Composition of 2023, By Sector of Origin
Figure 88: Denmark Export and Import Value & Volume, 2023-2030 ($)
Figure 89: APAC Polyvinylpyrrolidone Market Value & Volume, 2023-2030 ($)
Figure 90: China Polyvinylpyrrolidone MarketValue & Volume, 2023-2030
Figure 91: China GDP and Population, 2023-2030 ($)
Figure 92: China GDP – Composition of 2023, By Sector of Origin
Figure 93: China Export and Import Value & Volume, 2023-2030 ($)Polyvinylpyrrolidone MarketChina Export and Import Value & Volume, 2023-2030
Figure 94: Australia Polyvinylpyrrolidone Market Value & Volume, 2023-2030 ($)
Figure 95: Australia GDP and Population, 2023-2030 ($)
Figure 96: Australia GDP – Composition of 2023, By Sector of Origin
Figure 97: Australia Export and Import Value & Volume, 2023-2030 ($)
Figure 98: South Korea Polyvinylpyrrolidone Market Value & Volume, 2023-2030 ($)
Figure 99: South Korea GDP and Population, 2023-2030 ($)
Figure 100: South Korea GDP – Composition of 2023, By Sector of Origin
Figure 101: South Korea Export and Import Value & Volume, 2023-2030 ($)
Figure 102: India Polyvinylpyrrolidone Market Value & Volume, 2023-2030 ($)
Figure 103: India GDP and Population, 2023-2030 ($)
Figure 104: India GDP – Composition of 2023, By Sector of Origin
Figure 105: India Export and Import Value & Volume, 2023-2030 ($)
Figure 106: Taiwan Polyvinylpyrrolidone MarketTaiwan 3D Printing Market Value & Volume, 2023-2030 ($)
Figure 107: Taiwan GDP and Population, 2023-2030 ($)
Figure 108: Taiwan GDP – Composition of 2023, By Sector of Origin
Figure 109: Taiwan Export and Import Value & Volume, 2023-2030 ($)
Figure 110: Malaysia Polyvinylpyrrolidone MarketMalaysia 3D Printing Market Value & Volume, 2023-2030 ($)
Figure 111: Malaysia GDP and Population, 2023-2030 ($)
Figure 112: Malaysia GDP – Composition of 2023, By Sector of Origin
Figure 113: Malaysia Export and Import Value & Volume, 2023-2030 ($)
Figure 114: Hong Kong Polyvinylpyrrolidone MarketHong Kong 3D Printing Market Value & Volume, 2023-2030 ($)
Figure 115: Hong Kong GDP and Population, 2023-2030 ($)
Figure 116: Hong Kong GDP – Composition of 2023, By Sector of Origin
Figure 117: Hong Kong Export and Import Value & Volume, 2023-2030 ($)
Figure 118: Middle East & Africa Polyvinylpyrrolidone MarketMiddle East & Africa 3D Printing Market Value & Volume, 2023-2030 ($)
Figure 119: Russia Polyvinylpyrrolidone MarketRussia 3D Printing Market Value & Volume, 2023-2030 ($)
Figure 120: Russia GDP and Population, 2023-2030 ($)
Figure 121: Russia GDP – Composition of 2023, By Sector of Origin
Figure 122: Russia Export and Import Value & Volume, 2023-2030 ($)
Figure 123: Israel Polyvinylpyrrolidone Market Value & Volume, 2023-2030 ($)
Figure 124: Israel GDP and Population, 2023-2030 ($)
Figure 125: Israel GDP – Composition of 2023, By Sector of Origin
Figure 126: Israel Export and Import Value & Volume, 2023-2030 ($)
Figure 127: Entropy Share, By Strategies, 2023-2030* (%)Polyvinylpyrrolidone Market
Figure 128: Developments, 2023-2030*Polyvinylpyrrolidone Market
Figure 129: Company 1 Polyvinylpyrrolidone Market Net Revenue, By Years, 2023-2030* ($)
Figure 130: Company 1 Polyvinylpyrrolidone Market Net Revenue Share, By Business segments, 2023 (%)
Figure 131: Company 1 Polyvinylpyrrolidone Market Net Sales Share, By Geography, 2023 (%)
Figure 132: Company 2 Polyvinylpyrrolidone Market Net Revenue, By Years, 2023-2030* ($)
Figure 133: Company 2 Polyvinylpyrrolidone Market Net Revenue Share, By Business segments, 2023 (%)
Figure 134: Company 2 Polyvinylpyrrolidone Market Net Sales Share, By Geography, 2023 (%)
Figure 135: Company 3Polyvinylpyrrolidone Market Net Revenue, By Years, 2023-2030* ($)
Figure 136: Company 3Polyvinylpyrrolidone Market Net Revenue Share, By Business segments, 2023 (%)
Figure 137: Company 3Polyvinylpyrrolidone Market Net Sales Share, By Geography, 2023 (%)
Figure 138: Company 4 Polyvinylpyrrolidone Market Net Revenue, By Years, 2023-2030* ($)
Figure 139: Company 4 Polyvinylpyrrolidone Market Net Revenue Share, By Business segments, 2023 (%)
Figure 140: Company 4 Polyvinylpyrrolidone Market Net Sales Share, By Geography, 2023 (%)
Figure 141: Company 5 Polyvinylpyrrolidone Market Net Revenue, By Years, 2023-2030* ($)
Figure 142: Company 5 Polyvinylpyrrolidone Market Net Revenue Share, By Business segments, 2023 (%)
Figure 143: Company 5 Polyvinylpyrrolidone Market Net Sales Share, By Geography, 2023 (%)
Figure 144: Company 6 Polyvinylpyrrolidone Market Net Revenue, By Years, 2023-2030* ($)
Figure 145: Company 6 Polyvinylpyrrolidone Market Net Revenue Share, By Business segments, 2023 (%)
Figure 146: Company 6 Polyvinylpyrrolidone Market Net Sales Share, By Geography, 2023 (%)
Figure 147: Company 7 Polyvinylpyrrolidone Market Net Revenue, By Years, 2023-2030* ($)
Figure 148: Company 7 Polyvinylpyrrolidone Market Net Revenue Share, By Business segments, 2023 (%)
Figure 149: Company 7 Polyvinylpyrrolidone Market Net Sales Share, By Geography, 2023 (%)
Figure 150: Company 8 Polyvinylpyrrolidone Market Net Revenue, By Years, 2023-2030* ($)
Figure 151: Company 8 Polyvinylpyrrolidone Market Net Revenue Share, By Business segments, 2023 (%)
Figure 152: Company 8 Polyvinylpyrrolidone Market Net Sales Share, By Geography, 2023 (%)
Figure 153: Company 9 Polyvinylpyrrolidone Market Net Revenue, By Years, 2023-2030* ($)
Figure 154: Company 9 Polyvinylpyrrolidone Market Net Revenue Share, By Business segments, 2023 (%)
Figure 155: Company 9 Polyvinylpyrrolidone Market Net Sales Share, By Geography, 2023 (%)
Figure 156: Company 10 Polyvinylpyrrolidone Market Net Revenue, By Years, 2023-2030* ($)
Figure 157: Company 10 Polyvinylpyrrolidone Market Net Revenue Share, By Business segments, 2023 (%)
Figure 158: Company 10 Polyvinylpyrrolidone Market Net Sales Share, By Geography, 2023 (%)
Figure 159: Company 11 Polyvinylpyrrolidone Market Net Revenue, By Years, 2023-2030* ($)
Figure 160: Company 11 Polyvinylpyrrolidone Market Net Revenue Share, By Business segments, 2023 (%)
Figure 161: Company 11 Polyvinylpyrrolidone Market Net Sales Share, By Geography, 2023 (%)
Figure 162: Company 12 Polyvinylpyrrolidone Market Net Revenue, By Years, 2023-2030* ($)
Figure 163: Company 12 Polyvinylpyrrolidone Market Net Revenue Share, By Business segments, 2023 (%)
Figure 164: Company 12 Polyvinylpyrrolidone Market Net Sales Share, By Geography, 2023 (%)
Figure 165: Company 13Polyvinylpyrrolidone Market Net Revenue, By Years, 2023-2030* ($)
Figure 166: Company 13Polyvinylpyrrolidone Market Net Revenue Share, By Business segments, 2023 (%)
Figure 167: Company 13Polyvinylpyrrolidone Market Net Sales Share, By Geography, 2023 (%)
Figure 168: Company 14 Polyvinylpyrrolidone Market Net Revenue, By Years, 2023-2030* ($)
Figure 169: Company 14 Polyvinylpyrrolidone Market Net Revenue Share, By Business segments, 2023 (%)
Figure 170: Company 14 Polyvinylpyrrolidone Market Net Sales Share, By Geography, 2023 (%)
Figure 171: Company 15 Polyvinylpyrrolidone Market Net Revenue, By Years, 2023-2030* ($)
Figure 172: Company 15 Polyvinylpyrrolidone Market Net Revenue Share, By Business segments, 2023 (%)
Figure 173: Company 15 Polyvinylpyrrolidone Market Net Sales Share, By Geography, 2023 (%)