 Email
Email Print
Print


Methyl Methacrylate Adhesive Market - Forecast(2025 - 2031)
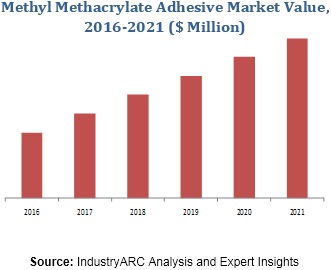
Methyl Methacrylate Adhesive Market size is estimated to reach $2787.09 Million by 2030, growing at a CAGR of 7.30% during the forecast period 2024-2030.
MMA Adhesives Market Overview:
There are numerous types of adhesives present in the market that are used for various applications. Structural adhesives are designed to join two surfaces to form part of a load-bearing structure. The most widely used structural adhesives are epoxies and polyurethanes; cyanoacrylates, and certain urethanes and acrylic adhesives. Methyl Methacrylate Adhesives (MMA) are a class of structural adhesives that is a relatively newer technology, and as such, their properties and benefits are not widely understood in the end user industries. End user industries of MMA Adhesives include commercial vehicles, marine, wind energy, construction, and others. The usage of MMA Adhesives in the wind energy sector has made prospects high for this market. MMA Adhesives market is estimated to grow at a CAGR of 5.39% during the forecast period 2018–2023. APAC is forecast to have the highest CAGR of 6.34%.
MMA Adhesives Market Outlook
Methyl methacrylate adhesives are high performance adhesives used to make laminated woods for decks, walls, roofs and other building applications, as well as in other products where there is a requirement for strong bonding with a variety of substrates such as concrete or wood. Increasing governmental spending on public infrastructure and commercial buildings is projected to drive the demand for methyl methacrylate adhesives in construction applications such as fast turnaround flooring, roofing, and wall coverings.
MMA Adhesives Market Growth Drivers
Methyl methacrylate adhesives deliver high strength and is temperature resistant. They also reduce the noise of wind turbines and blades. These adhesives are used in automotive applications to provide superior grip between distinct substrates such as steel and plastics. They are used in doors, window glass attachments, brakes, clutch plates, and many more. The growing demand for passenger cars in developing countries such as China and India is expected to impact the methyl methacrylate adhesives market growth.
MMA Adhesives Market Challenges
Strict regulations govern all materials used in aircraft interiors. The other added challenge with regulations and approvals is that they are constantly changing, and becoming ever severer.
MMA Adhesives Market Research Scope
The base year of the study is 2017, with forecast done up to 2023. The study presents a thorough analysis of the competitive landscape, taking into account the market shares of the leading companies. It also provides information on unit shipments. These provide the key market participants with the necessary business intelligence and help them understand the future of the MMA Adhesives market. The assessment includes the forecast, an overview of the competitive structure, the market shares of the competitors, as well as the market trends, market demands, market drivers, market challenges, and product analysis. The market drivers and restraints have been assessed to fathom their impact over the forecast period. This report further identifies the key opportunities for growth while also detailing the key challenges and possible threats. The key areas of focus include the types of MMA Adhesives, and their specific applications in different types of vehicles.
MMA Adhesives Report: Industry Coverage
MMA Adhesives Types: Plastics, Metals, Composites
Applications area of MMA Adhesives: Commercial Vehicle, Marine, Wind Energy, Construction among others
The MMA Adhesives report also analyzes the major geographic regions for the market as well as the major countries for the market in these regions. The regions and countries covered in the study include:
- North America: The U.S., Canada, Mexico
- Europe: The U.K., Germany, France, , Russia, Italy, Spain, Rest of Europe
- APAC: China, Japan, Australia, South Korea, India, Rest of APAC
- Rest of the World: Middle East and Africa, South America, South America
MMA Adhesives Market Key Players Perspective
3M,Sika AG,H.B. Fuller Co.,Huntsman Corp.,NovaChem Corp.
MMA Adhesives Trends
- Arkema group has acquired Bostik, which is third largest adhesives manufacturer worldwide, generating approximately €1.53 billion in sales on an annual basis. With this acquisition, Arkema can accelerate expansion in high performance materials, reinforce earning stability, and enhance its market-driven approach through long-term partnerships, unique technologies and geographical footprint.
1. Methyl Methacrylate Adhesive Market - Overview
1.1. Definitions and Scope
2. Methyl Methacrylate Adhesive Market - Executive summary
2.1. Market Revenue, Market Size and Key Trends by Company
2.2. Key Trends by type of Application
2.3. Key Trends segmented by Geography
3. Methyl Methacrylate Adhesive Market
3.1. Comparative analysis
3.1.1. Product Benchmarking - Top 10 companies
3.1.2. Top 5 Financials Analysis
3.1.3. Market Value split by Top 10 companies
3.1.4. Patent Analysis - Top 10 companies
3.1.5. Pricing Analysis
4. Methyl Methacrylate Adhesive Market – Startup companies Scenario Premium
4.1. Top 10 startup company Analysis by
4.1.1. Investment
4.1.2. Revenue
4.1.3. Market Shares
4.1.4. Market Size and Application Analysis
4.1.5. Venture Capital and Funding Scenario
5. Methyl Methacrylate Adhesive Market – Industry Market Entry Scenario Premium
5.1. Regulatory Framework Overview
5.2. New Business and Ease of Doing business index
5.3. Case studies of successful ventures
5.4. Customer Analysis – Top 10 companies
6. Methyl Methacrylate Adhesive Market Forces
6.1. Drivers
6.2. Constraints
6.3. Challenges
6.4. Porters five force model
6.4.1. Bargaining power of suppliers
6.4.2. Bargaining powers of customers
6.4.3. Threat of new entrants
6.4.4. Rivalry among existing players
6.4.5. Threat of substitutes
7. Methyl Methacrylate Adhesive Market -Strategic analysis
7.1. Value chain analysis
7.2. Opportunities analysis
7.3. Product life cycle
7.4. Suppliers and distributors Market Share
8. Methyl Methacrylate Adhesive Market – By Type (Market Size -$Million / $Billion)
8.1. Market Size and Market Share Analysis
8.2. Application Revenue and Trend Research
8.3. Product Segment Analysis
8.3.1. Plastics
8.3.2. Metals
8.3.3. Composites
9. Methyl Methacrylate Adhesive Market – By Application (Market Size -$Million / $Billion)
9.1. Commercial Vehicle
9.2. Marine
9.3. Wind Energy
9.4. Construction
9.5. Others
10. Methyl Methacrylate Adhesive - By Geography (Market Size -$Million / $Billion)
10.1. Methyl Methacrylate Adhesive Market - North America Segment Research
10.2. North America Market Research (Million / $Billion)
10.2.1. Segment type Size and Market Size Analysis
10.2.2. Revenue and Trends
10.2.3. Application Revenue and Trends by type of Application
10.2.4. Company Revenue and Product Analysis
10.2.5. North America Product type and Application Market Size
10.2.5.1. U.S.
10.2.5.2. Canada
10.2.5.3. Mexico
10.2.5.4. Rest of North America
10.3. Methyl Methacrylate Adhesive - South America Segment Research
10.4. South America Market Research (Market Size -$Million / $Billion)
10.4.1. Segment type Size and Market Size Analysis
10.4.2. Revenue and Trends
10.4.3. Application Revenue and Trends by type of Application
10.4.4. Company Revenue and Product Analysis
10.4.5. South America Product type and Application Market Size
10.4.5.1. Brazil
10.4.5.2. Venezuela
10.4.5.3. Argentina
10.4.5.4. Ecuador
10.4.5.5. Peru
10.4.5.6. Colombia
10.4.5.7. Costa Rica
10.4.5.8. Rest of South America
10.5. Methyl Methacrylate Adhesive - Europe Segment Research
10.6. Europe Market Research (Market Size -$Million / $Billion)
10.6.1. Segment type Size and Market Size Analysis
10.6.2. Revenue and Trends
10.6.3. Application Revenue and Trends by type of Application
10.6.4. Company Revenue and Product Analysis
10.6.5. Europe Segment Product type and Application Market Size
10.6.5.1. U.K
10.6.5.2. Germany
10.6.5.3. Italy
10.6.5.4. France
10.6.5.5. Netherlands
10.6.5.6. Belgium
10.6.5.7. Spain
10.6.5.8. Denmark
10.6.5.9. Rest of Europe
10.7. Methyl Methacrylate Adhesive – APAC Segment Research
10.8. APAC Market Research (Market Size -$Million / $Billion)
10.8.1. Segment type Size and Market Size Analysis
10.8.2. Revenue and Trends
10.8.3. Application Revenue and Trends by type of Application
10.8.4. Company Revenue and Product Analysis
10.8.5. APAC Segment – Product type and Application Market Size
10.8.5.1. China
10.8.5.2. Australia
10.8.5.3. Japan
10.8.5.4. South Korea
10.8.5.5. India
10.8.5.6. Taiwan
10.8.5.7. Malaysia
11. Methyl Methacrylate Adhesive Market - Entropy
11.1. New product launches
11.2. M&A's, collaborations, JVs and partnerships
12. Methyl Methacrylate Adhesive Market – Industry / Segment Competition landscape Premium
12.1. Market Share Analysis
12.1.1. Market Share by Country- Top companies
12.1.2. Market Share by Region- Top 10 companies
12.1.3. Market Share by type of Application – Top 10 companies
12.1.4. Market Share by type of Product / Product category- Top 10 companies
12.1.5. Market Share at global level- Top 10 companies
12.1.6. Best Practises for companies
13. Methyl Methacrylate Adhesive Market – Key Company List by Country Premium
14. Methyl Methacrylate Adhesive Market Company Analysis
14.1. Market Share, Company Revenue, Products, M&A, Developments
14.2. Arkema Group
14.3. Henkel AG & Co.KGa
14.4. Huntsman International LLC
14.5. 3M Company
14.6. Company 5
14.7. Company 6
14.8. Company 7
14.9. Company 8
14.10. Company 9
14.11. Company 10 and more
"*Financials would be provided on a best efforts basis for private companies"
15. Methyl Methacrylate Adhesive Market -Appendix
15.1. Abbreviations
15.2. Sources
16. Methyl Methacrylate Adhesive Market -Methodology Premium
16.1. Research Methodology
16.1.1. Company Expert Interviews
16.1.2. Industry Databases
16.1.3. Associations
16.1.4. Company News
16.1.5. Company Annual Reports
16.1.6. Application Trends
16.1.7. New Products and Product database
16.1.8. Company Transcripts
16.1.9. R&D Trends
16.1.10. Key Opinion Leaders Interviews
16.1.11. Supply and Demand Trends
List of Tables:
Table 1: Methyl Methacrylate Adhesive Market Overview 2023-2030
Table 2: Methyl Methacrylate Adhesive Market Leader Analysis 2023-2030 (US$)
Table 3: Methyl Methacrylate Adhesive Market Product Analysis 2023-2030 (US$)
Table 4: Methyl Methacrylate Adhesive Market End User Analysis 2023-2030 (US$)
Table 5: Methyl Methacrylate Adhesive Market Patent Analysis 2013-2023* (US$)
Table 6: Methyl Methacrylate Adhesive Market Financial Analysis 2023-2030 (US$)
Table 7: Methyl Methacrylate Adhesive Market Driver Analysis 2023-2030 (US$)
Table 8: Methyl Methacrylate Adhesive Market Challenges Analysis 2023-2030 (US$)
Table 9: Methyl Methacrylate Adhesive Market Constraint Analysis 2023-2030 (US$)
Table 10: Methyl Methacrylate Adhesive Market Supplier Bargaining Power Analysis 2023-2030 (US$)
Table 11: Methyl Methacrylate Adhesive Market Buyer Bargaining Power Analysis 2023-2030 (US$)
Table 12: Methyl Methacrylate Adhesive Market Threat of Substitutes Analysis 2023-2030 (US$)
Table 13: Methyl Methacrylate Adhesive Market Threat of New Entrants Analysis 2023-2030 (US$)
Table 14: Methyl Methacrylate Adhesive Market Degree of Competition Analysis 2023-2030 (US$)
Table 15: Methyl Methacrylate Adhesive Market Value Chain Analysis 2023-2030 (US$)
Table 16: Methyl Methacrylate Adhesive Market Pricing Analysis 2023-2030 (US$)
Table 17: Methyl Methacrylate Adhesive Market Opportunities Analysis 2023-2030 (US$)
Table 18: Methyl Methacrylate Adhesive Market Product Life Cycle Analysis 2023-2030 (US$)
Table 19: Methyl Methacrylate Adhesive Market Supplier Analysis 2023-2030 (US$)
Table 20: Methyl Methacrylate Adhesive Market Distributor Analysis 2023-2030 (US$)
Table 21: Methyl Methacrylate Adhesive Market Trend Analysis 2023-2030 (US$)
Table 22: Methyl Methacrylate Adhesive Market Size 2023 (US$)
Table 23: Methyl Methacrylate Adhesive Market Forecast Analysis 2023-2030 (US$)
Table 24: Methyl Methacrylate Adhesive Market Sales Forecast Analysis 2023-2030 (Units)
Table 25: Methyl Methacrylate Adhesive Market, Revenue & Volume,By Type, 2023-2030 ($)
Table 26: Methyl Methacrylate Adhesive MarketBy Type, Revenue & Volume,By Composites, 2023-2030 ($)
Table 27: Methyl Methacrylate Adhesive MarketBy Type, Revenue & Volume,By Metals, 2023-2030 ($)
Table 28: Methyl Methacrylate Adhesive MarketBy Type, Revenue & Volume,By Plastics, 2023-2030 ($)
Table 29: Methyl Methacrylate Adhesive Market, Revenue & Volume,By Application, 2023-2030 ($)
Table 30: Methyl Methacrylate Adhesive Market By Application, Revenue & Volume,By Commercial Vehicle, 2023-2030 ($)
Table 31: Methyl Methacrylate Adhesive Market By Application, Revenue & Volume,By Marine, 2023-2030 ($)
Table 32: Methyl Methacrylate Adhesive Market By Application, Revenue & Volume,By Wind Energy, 2023-2030 ($)
Table 33: Methyl Methacrylate Adhesive Market By Application, Revenue & Volume,By General Assembly, 2023-2030 ($)
Table 34: North America Methyl Methacrylate Adhesive Market, Revenue & Volume,By Type, 2023-2030 ($)
Table 35: North America Methyl Methacrylate Adhesive Market, Revenue & Volume,By Application, 2023-2030 ($)
Table 36: South america Methyl Methacrylate Adhesive Market, Revenue & Volume,By Type, 2023-2030 ($)
Table 37: South america Methyl Methacrylate Adhesive Market, Revenue & Volume,By Application, 2023-2030 ($)
Table 38: Europe Methyl Methacrylate Adhesive Market, Revenue & Volume,By Type, 2023-2030 ($)
Table 39: Europe Methyl Methacrylate Adhesive Market, Revenue & Volume,By Application, 2023-2030 ($)
Table 40: APAC Methyl Methacrylate Adhesive Market, Revenue & Volume,By Type, 2023-2030 ($)
Table 41: APAC Methyl Methacrylate Adhesive Market, Revenue & Volume,By Application, 2023-2030 ($)
Table 42: Middle East & Africa Methyl Methacrylate Adhesive Market, Revenue & Volume,By Type, 2023-2030 ($)
Table 43: Middle East & Africa Methyl Methacrylate Adhesive Market, Revenue & Volume,By Application, 2023-2030 ($)
Table 44: Russia Methyl Methacrylate Adhesive Market, Revenue & Volume,By Type, 2023-2030 ($)
Table 45: Russia Methyl Methacrylate Adhesive Market, Revenue & Volume,By Application, 2023-2030 ($)
Table 46: Israel Methyl Methacrylate Adhesive Market, Revenue & Volume,By Type, 2023-2030 ($)
Table 47: Israel Methyl Methacrylate Adhesive Market, Revenue & Volume,By Application, 2023-2030 ($)
Table 48: Top Companies 2023 (US$)Methyl Methacrylate Adhesive Market, Revenue & Volume
Table 49: Product Launch 2023-2030 Methyl Methacrylate Adhesive Market, Revenue & Volume
Table 50: Mergers & Acquistions 2023-2030 Methyl Methacrylate Adhesive Market, Revenue & Volume
List of Figures:
Figure 1: Overview of Methyl Methacrylate Adhesive Market 2023-2030
Figure 2: Market Share Analysis for Methyl Methacrylate Adhesive Market 2023 (US$)
Figure 3: Product Comparison in Methyl Methacrylate Adhesive Market 2023-2030 (US$)
Figure 4: End User Profile for Methyl Methacrylate Adhesive Market 2023-2030 (US$)
Figure 5: Patent Application and Grant in Methyl Methacrylate Adhesive Market 2013-2023* (US$)
Figure 6: Top 5 Companies Financial Analysis in Methyl Methacrylate Adhesive Market 2023-2030 (US$)
Figure 7: Market Entry Strategy in Methyl Methacrylate Adhesive Market 2023-2030
Figure 8: Ecosystem Analysis in Methyl Methacrylate Adhesive Market2023
Figure 9: Average Selling Price in Methyl Methacrylate Adhesive Market 2023-2030
Figure 10: Top Opportunites in Methyl Methacrylate Adhesive Market 2023-2030
Figure 11: Market Life Cycle Analysis in Methyl Methacrylate Adhesive Market
Figure 12: GlobalBy TypeMethyl Methacrylate Adhesive Market Revenue, 2023-2030 ($)
Figure 13: GlobalBy ApplicationMethyl Methacrylate Adhesive Market Revenue, 2023-2030 ($)
Figure 14: Global Methyl Methacrylate Adhesive Market - By Geography
Figure 15: Global Methyl Methacrylate Adhesive Market Value & Volume, By Geography, 2023-2030 ($)
Figure 16: Global Methyl Methacrylate Adhesive Market CAGR, By Geography, 2023-2030 (%)
Figure 17: North America Methyl Methacrylate Adhesive Market Value & Volume, 2023-2030 ($)
Figure 18: US Methyl Methacrylate Adhesive Market Value & Volume, 2023-2030 ($)
Figure 19: US GDP and Population, 2023-2030 ($)
Figure 20: US GDP – Composition of 2023, By Sector of Origin
Figure 21: US Export and Import Value & Volume, 2023-2030 ($)
Figure 22: Canada Methyl Methacrylate Adhesive Market Value & Volume, 2023-2030 ($)
Figure 23: Canada GDP and Population, 2023-2030 ($)
Figure 24: Canada GDP – Composition of 2023, By Sector of Origin
Figure 25: Canada Export and Import Value & Volume, 2023-2030 ($)
Figure 26: Mexico Methyl Methacrylate Adhesive Market Value & Volume, 2023-2030 ($)
Figure 27: Mexico GDP and Population, 2023-2030 ($)
Figure 28: Mexico GDP – Composition of 2023, By Sector of Origin
Figure 29: Mexico Export and Import Value & Volume, 2023-2030 ($)
Figure 30: South America Methyl Methacrylate Adhesive MarketSouth America 3D Printing Market Value & Volume, 2023-2030 ($)
Figure 31: Brazil Methyl Methacrylate Adhesive Market Value & Volume, 2023-2030 ($)
Figure 32: Brazil GDP and Population, 2023-2030 ($)
Figure 33: Brazil GDP – Composition of 2023, By Sector of Origin
Figure 34: Brazil Export and Import Value & Volume, 2023-2030 ($)
Figure 35: Venezuela Methyl Methacrylate Adhesive Market Value & Volume, 2023-2030 ($)
Figure 36: Venezuela GDP and Population, 2023-2030 ($)
Figure 37: Venezuela GDP – Composition of 2023, By Sector of Origin
Figure 38: Venezuela Export and Import Value & Volume, 2023-2030 ($)
Figure 39: Argentina Methyl Methacrylate Adhesive Market Value & Volume, 2023-2030 ($)
Figure 40: Argentina GDP and Population, 2023-2030 ($)
Figure 41: Argentina GDP – Composition of 2023, By Sector of Origin
Figure 42: Argentina Export and Import Value & Volume, 2023-2030 ($)
Figure 43: Ecuador Methyl Methacrylate Adhesive Market Value & Volume, 2023-2030 ($)
Figure 44: Ecuador GDP and Population, 2023-2030 ($)
Figure 45: Ecuador GDP – Composition of 2023, By Sector of Origin
Figure 46: Ecuador Export and Import Value & Volume, 2023-2030 ($)
Figure 47: Peru Methyl Methacrylate Adhesive Market Value & Volume, 2023-2030 ($)
Figure 48: Peru GDP and Population, 2023-2030 ($)
Figure 49: Peru GDP – Composition of 2023, By Sector of Origin
Figure 50: Peru Export and Import Value & Volume, 2023-2030 ($)
Figure 51: Colombia Methyl Methacrylate Adhesive Market Value & Volume, 2023-2030 ($)
Figure 52: Colombia GDP and Population, 2023-2030 ($)
Figure 53: Colombia GDP – Composition of 2023, By Sector of Origin
Figure 54: Colombia Export and Import Value & Volume, 2023-2030 ($)
Figure 55: Costa Rica Methyl Methacrylate Adhesive MarketCosta Rica 3D Printing Market Value & Volume, 2023-2030 ($)
Figure 56: Costa Rica GDP and Population, 2023-2030 ($)
Figure 57: Costa Rica GDP – Composition of 2023, By Sector of Origin
Figure 58: Costa Rica Export and Import Value & Volume, 2023-2030 ($)
Figure 59: Europe Methyl Methacrylate Adhesive Market Value & Volume, 2023-2030 ($)
Figure 60: U.K Methyl Methacrylate Adhesive Market Value & Volume, 2023-2030 ($)
Figure 61: U.K GDP and Population, 2023-2030 ($)
Figure 62: U.K GDP – Composition of 2023, By Sector of Origin
Figure 63: U.K Export and Import Value & Volume, 2023-2030 ($)
Figure 64: Germany Methyl Methacrylate Adhesive Market Value & Volume, 2023-2030 ($)
Figure 65: Germany GDP and Population, 2023-2030 ($)
Figure 66: Germany GDP – Composition of 2023, By Sector of Origin
Figure 67: Germany Export and Import Value & Volume, 2023-2030 ($)
Figure 68: Italy Methyl Methacrylate Adhesive Market Value & Volume, 2023-2030 ($)
Figure 69: Italy GDP and Population, 2023-2030 ($)
Figure 70: Italy GDP – Composition of 2023, By Sector of Origin
Figure 71: Italy Export and Import Value & Volume, 2023-2030 ($)
Figure 72: France Methyl Methacrylate Adhesive Market Value & Volume, 2023-2030 ($)
Figure 73: France GDP and Population, 2023-2030 ($)
Figure 74: France GDP – Composition of 2023, By Sector of Origin
Figure 75: France Export and Import Value & Volume, 2023-2030 ($)
Figure 76: Netherlands Methyl Methacrylate Adhesive Market Value & Volume, 2023-2030 ($)
Figure 77: Netherlands GDP and Population, 2023-2030 ($)
Figure 78: Netherlands GDP – Composition of 2023, By Sector of Origin
Figure 79: Netherlands Export and Import Value & Volume, 2023-2030 ($)
Figure 80: Belgium Methyl Methacrylate Adhesive Market Value & Volume, 2023-2030 ($)
Figure 81: Belgium GDP and Population, 2023-2030 ($)
Figure 82: Belgium GDP – Composition of 2023, By Sector of Origin
Figure 83: Belgium Export and Import Value & Volume, 2023-2030 ($)
Figure 84: Spain Methyl Methacrylate Adhesive Market Value & Volume, 2023-2030 ($)
Figure 85: Spain GDP and Population, 2023-2030 ($)
Figure 86: Spain GDP – Composition of 2023, By Sector of Origin
Figure 87: Spain Export and Import Value & Volume, 2023-2030 ($)
Figure 88: Denmark Methyl Methacrylate Adhesive Market Value & Volume, 2023-2030 ($)
Figure 89: Denmark GDP and Population, 2023-2030 ($)
Figure 90: Denmark GDP – Composition of 2023, By Sector of Origin
Figure 91: Denmark Export and Import Value & Volume, 2023-2030 ($)
Figure 92: APAC Methyl Methacrylate Adhesive Market Value & Volume, 2023-2030 ($)
Figure 93: China Methyl Methacrylate Adhesive MarketValue & Volume, 2023-2030
Figure 94: China GDP and Population, 2023-2030 ($)
Figure 95: China GDP – Composition of 2023, By Sector of Origin
Figure 96: China Export and Import Value & Volume, 2023-2030 ($)Methyl Methacrylate Adhesive MarketChina Export and Import Value & Volume, 2023-2030 ($)
Figure 97: Australia Methyl Methacrylate Adhesive Market Value & Volume, 2023-2030 ($)
Figure 98: Australia GDP and Population, 2023-2030 ($)
Figure 99: Australia GDP – Composition of 2023, By Sector of Origin
Figure 100: Australia Export and Import Value & Volume, 2023-2030 ($)
Figure 101: South Korea Methyl Methacrylate Adhesive Market Value & Volume, 2023-2030 ($)
Figure 102: South Korea GDP and Population, 2023-2030 ($)
Figure 103: South Korea GDP – Composition of 2023, By Sector of Origin
Figure 104: South Korea Export and Import Value & Volume, 2023-2030 ($)
Figure 105: India Methyl Methacrylate Adhesive Market Value & Volume, 2023-2030 ($)
Figure 106: India GDP and Population, 2023-2030 ($)
Figure 107: India GDP – Composition of 2023, By Sector of Origin
Figure 108: India Export and Import Value & Volume, 2023-2030 ($)
Figure 109: Taiwan Methyl Methacrylate Adhesive MarketTaiwan 3D Printing Market Value & Volume, 2023-2030 ($)
Figure 110: Taiwan GDP and Population, 2023-2030 ($)
Figure 111: Taiwan GDP – Composition of 2023, By Sector of Origin
Figure 112: Taiwan Export and Import Value & Volume, 2023-2030 ($)
Figure 113: Malaysia Methyl Methacrylate Adhesive MarketMalaysia 3D Printing Market Value & Volume, 2023-2030 ($)
Figure 114: Malaysia GDP and Population, 2023-2030 ($)
Figure 115: Malaysia GDP – Composition of 2023, By Sector of Origin
Figure 116: Malaysia Export and Import Value & Volume, 2023-2030 ($)
Figure 117: Hong Kong Methyl Methacrylate Adhesive MarketHong Kong 3D Printing Market Value & Volume, 2023-2030 ($)
Figure 118: Hong Kong GDP and Population, 2023-2030 ($)
Figure 119: Hong Kong GDP – Composition of 2023, By Sector of Origin
Figure 120: Hong Kong Export and Import Value & Volume, 2023-2030 ($)
Figure 121: Middle East & Africa Methyl Methacrylate Adhesive MarketMiddle East & Africa 3D Printing Market Value & Volume, 2023-2030 ($)
Figure 122: Russia Methyl Methacrylate Adhesive MarketRussia 3D Printing Market Value & Volume, 2023-2030 ($)
Figure 123: Russia GDP and Population, 2023-2030 ($)
Figure 124: Russia GDP – Composition of 2023, By Sector of Origin
Figure 125: Russia Export and Import Value & Volume, 2023-2030 ($)
Figure 126: Israel Methyl Methacrylate Adhesive Market Value & Volume, 2023-2030 ($)
Figure 127: Israel GDP and Population, 2023-2030 ($)
Figure 128: Israel GDP – Composition of 2023, By Sector of Origin
Figure 129: Israel Export and Import Value & Volume, 2023-2030 ($)
Figure 130: Entropy Share, By Strategies, 2023-2030* (%)Methyl Methacrylate Adhesive Market
Figure 131: Developments, 2023-2030*Methyl Methacrylate Adhesive Market
Figure 132: Company 1 Methyl Methacrylate Adhesive Market Net Revenue, By Years, 2023-2030* ($)
Figure 133: Company 1 Methyl Methacrylate Adhesive Market Net Revenue Share, By Business segments, 2023 (%)
Figure 134: Company 1 Methyl Methacrylate Adhesive Market Net Sales Share, By Geography, 2023 (%)
Figure 135: Company 2 Methyl Methacrylate Adhesive Market Net Revenue, By Years, 2023-2030* ($)
Figure 136: Company 2 Methyl Methacrylate Adhesive Market Net Revenue Share, By Business segments, 2023 (%)
Figure 137: Company 2 Methyl Methacrylate Adhesive Market Net Sales Share, By Geography, 2023 (%)
Figure 138: Company 3 Methyl Methacrylate Adhesive Market Net Revenue, By Years, 2023-2030* ($)
Figure 139: Company 3 Methyl Methacrylate Adhesive Market Net Revenue Share, By Business segments, 2023 (%)
Figure 140: Company 3 Methyl Methacrylate Adhesive Market Net Sales Share, By Geography, 2023 (%)
Figure 141: Company 4 Methyl Methacrylate Adhesive Market Net Revenue, By Years, 2023-2030* ($)
Figure 142: Company 4 Methyl Methacrylate Adhesive Market Net Revenue Share, By Business segments, 2023 (%)
Figure 143: Company 4 Methyl Methacrylate Adhesive Market Net Sales Share, By Geography, 2023 (%)
Figure 144: Company 5 Methyl Methacrylate Adhesive Market Net Revenue, By Years, 2023-2030* ($)
Figure 145: Company 5 Methyl Methacrylate Adhesive Market Net Revenue Share, By Business segments, 2023 (%)
Figure 146: Company 5 Methyl Methacrylate Adhesive Market Net Sales Share, By Geography, 2023 (%)
Figure 147: Company 6 Methyl Methacrylate Adhesive Market Net Revenue, By Years, 2023-2030* ($)
Figure 148: Company 6 Methyl Methacrylate Adhesive Market Net Revenue Share, By Business segments, 2023 (%)
Figure 149: Company 6 Methyl Methacrylate Adhesive Market Net Sales Share, By Geography, 2023 (%)
Figure 150: Company 7 Methyl Methacrylate Adhesive Market Net Revenue, By Years, 2023-2030* ($)
Figure 151: Company 7 Methyl Methacrylate Adhesive Market Net Revenue Share, By Business segments, 2023 (%)
Figure 152: Company 7 Methyl Methacrylate Adhesive Market Net Sales Share, By Geography, 2023 (%)
Figure 153: Company 8 Methyl Methacrylate Adhesive Market Net Revenue, By Years, 2023-2030* ($)
Figure 154: Company 8 Methyl Methacrylate Adhesive Market Net Revenue Share, By Business segments, 2023 (%)
Figure 155: Company 8 Methyl Methacrylate Adhesive Market Net Sales Share, By Geography, 2023 (%)
Figure 156: Company 9 Methyl Methacrylate Adhesive Market Net Revenue, By Years, 2023-2030* ($)
Figure 157: Company 9 Methyl Methacrylate Adhesive Market Net Revenue Share, By Business segments, 2023 (%)
Figure 158: Company 9 Methyl Methacrylate Adhesive Market Net Sales Share, By Geography, 2023 (%)
Figure 159: Company 10 Methyl Methacrylate Adhesive Market Net Revenue, By Years, 2023-2030* ($)
Figure 160: Company 10 Methyl Methacrylate Adhesive Market Net Revenue Share, By Business segments, 2023 (%)
Figure 161: Company 10 Methyl Methacrylate Adhesive Market Net Sales Share, By Geography, 2023 (%)
Figure 162: Company 11 Methyl Methacrylate Adhesive Market Net Revenue, By Years, 2023-2030* ($)
Figure 163: Company 11 Methyl Methacrylate Adhesive Market Net Revenue Share, By Business segments, 2023 (%)
Figure 164: Company 11 Methyl Methacrylate Adhesive Market Net Sales Share, By Geography, 2023 (%)
Figure 165: Company 12 Methyl Methacrylate Adhesive Market Net Revenue, By Years, 2023-2030* ($)
Figure 166: Company 12 Methyl Methacrylate Adhesive Market Net Revenue Share, By Business segments, 2023 (%)
Figure 167: Company 12 Methyl Methacrylate Adhesive Market Net Sales Share, By Geography, 2023 (%)
Figure 168: Company 13 Methyl Methacrylate Adhesive Market Net Revenue, By Years, 2023-2030* ($)
Figure 169: Company 13 Methyl Methacrylate Adhesive Market Net Revenue Share, By Business segments, 2023 (%)
Figure 170: Company 13 Methyl Methacrylate Adhesive Market Net Sales Share, By Geography, 2023 (%)
Figure 171: Company 14 Methyl Methacrylate Adhesive Market Net Revenue, By Years, 2023-2030* ($)
Figure 172: Company 14 Methyl Methacrylate Adhesive Market Net Revenue Share, By Business segments, 2023 (%)
Figure 173: Company 14 Methyl Methacrylate Adhesive Market Net Sales Share, By Geography, 2023 (%)
Figure 174: Company 15 Methyl Methacrylate Adhesive Market Net Revenue, By Years, 2023-2030* ($)
Figure 175: Company 15 Methyl Methacrylate Adhesive Market Net Revenue Share, By Business segments, 2023 (%)
Figure 176: Company 15 Methyl Methacrylate Adhesive Market Net Sales Share, By Geography, 2023 (%)