Steel Rebar Market - Forecast(2024 - 2030)

Report Code: CMR 0577 Report Format: PDF + Excel

Steel Rebar Market Overview:
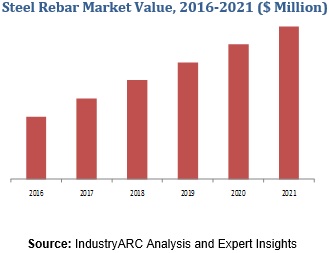
The iron and steel industry, which is the parent industry of steel rebar, witnessed lucrative trade amounting to $428.6 trillion in 2018 with a growth rate of 13% between 2017 and 2018, according to the International Trade Centre (ITC).A significant fraction of this trade is due to growing demand predominantly from the construction industry for steel rebar or reinforced steel bar. The steel rebar market size was evaluated to be $133 billion in 2018, and the demand for steel rebar is poised to grow at a CAGR of 5.4% during the forecast period 2019-2025.

APAC had the maximum steel rebar market share of 66% in 2018. This is due to the growing construction industry in countries such as China and India. Increasing urbanization and economic growth are driving the residential real estate sector in India, and government initiatives such as “Housing For All By 2022” are aiding growth of the sector. This is leading to an increase in construction activities across the country which is significantly supporting the steel rebar market. Additionally, Indonesia, Malaysia, and Japan are observing increased infrastructural development, which is boosting the APAC steel rebar market. Population growth in countries such as China and India is also creating growth prospects for the real estate industry in these countries, which in turn is creating opportunities for the APAC steel rebar market in 2018.

Steel Rebar Market Outlook:

Steel rebar is also known as concrete reinforcement steel bar or reinforcing steel that are used as tension device in reinforced concrete.  The product finds applications in infrastructure, manufacture, and oil & gas industries.

The key application of steel rebar is found in infrastructure, and the segment will grow at a substantial CAGR of 6.2% over the forecast period. The sustainable development goals (SDGs) by the United Nations is a creating a rapid need for infrastructure in upcoming years. According to the World Bank, the infrastructure investment gap attributable to roads only is estimated to be $8 trillion. In coming years, there will be augmented road development across the world, and steel rebar is commonplace in road development projects as it is used to reinforce concrete. Increasing infrastructural development will create lucrative prospects for the steel rebar market.   

Steel Rebar Market Growth Drivers:

· The Global Construction Industry Driving the Steel Rebar Market –

According to the World Bank, the construction industry contributed a significant share of 25.39% to the global GDP in 2016. The industry, which is another major steel rebar marketplace, will play an important role in fulfilling the SDGs of the UN. Increase in construction activities worldwide will further create opportunities for the steel rebar market over the forecast period.

· The Growth Prospects in the Oil & Gas Industry –

Oil and gas industry presents one of the most lucrative opportunities for the steel rebar market as the industry needs non-corrosive conduits made of steel rebar. There will be an increase in production of oil & gas over the forecast period as the Organization of Petroleum Exporting Countries (OPEC) projects the demand for oil & gas to collectively reach from 145.7 mboe/d in 2015 to 177.8 mboe/d in 2030.This will lead to an increase in the capacity of refineries across the globe, and these refineries will generate a demand for steel rebar for use in conduits. Steel rebar used in the oil and gas, and other manufacturing industries such as pharmaceuticals and fertilizer plants are generally epoxy coated in order to resist corrosion. The epoxy-coated steel rebar market is poised to witness growth in coming years.


 Steel Rebar Market

Steel Rebar Market Trends –

·      In January 2018, North-American steel producer Commercial Metals Company (CMC) acquired a number of steel rebar mills in the U.S. The company also acquired a steel rebar fabrication company called Gerdau S.A. for a sum of $600m. The acquisitions of steel rebar mills and fabrication units will help the organization capitalize on the demand influx in the North America steel rebar market.

Steel Rebar Market Key Players Perspective –

The major players in the steel rebar market are Gerdau, Nippon Steel Corporation, Steel Authority of India Ltd., Tata Steel Ltd., Essar Steel, EVRAZ Plc, Jindal Steel & Power Ltd., Steel Dynamics, Inc., Acerinox S.A., and Hyundai Steel Co. Ltd. 

Steel Rebar Market Research Scope:

The base year of the study is 2018, with forecast done up to 2025. The study presents a thorough analysis of the competitive landscape, taking into account the market shares of the leading companies. It also provides information on unit shipments. These provide the key market participants with the necessary business intelligence and help them understand the future of the steel rebar market. The assessment includes the forecast, an overview of the competitive structure, the market shares of the competitors, as well as the market trends, market demands, market drivers, market challenges, and product analysis. The market drivers and restraints have been assessed to fathom their impact over the forecast period. This report further identifies the key opportunities for growth while also detailing the key challenges and possible threats. The steel rebar market research report also analyses the application of steel rebar in various sectors such as construction, infrastructure, oil & gas, and manufacturing industries.

Steel Rebar Market Report: Industry Coverage

The steel rebar market report identified the current trends, opportunities, and challenges in the industry along with a detailed depiction of strategies by the existing market players.

The report also provides facts, figures, and statistics about different types of steel rebar and their use in various sectors.

For more Chemical and Materials related reports, please click here

1. Steel Rebar Market – Market Overview
2. Executive Summary
3. Market Landscape

   3.1. Market Share Analysis
   3.2. Comparative Analysis
   3.3. Product Benchmarking
   3.4. End User Profiling
   3.5. Top 5 Financials Analysis
4. Steel Rebar Market– Market Forces
   4.1. Drivers
      4.1.1. Rapid infrastructure developments in developing nations
   4.2. Restraints
      4.2.1. Environmental regulations
   4.3. Opportunities
   4.4. Challenges
   4.5. Porter’s Five Forces Analysis
      4.5.1. Bargaining Power of Suppliers
      4.5.2. Bargaining Power of Buyers
      4.5.3. Threat of New Entrants
      4.5.4. Threat of Substitutes
      4.5.5. Degree of Competition
5. Steel Rebar Market– Strategic Analysis
   5.1. Value Chain Analysis
   5.2. Pricing Analysis
   5.3. Opportunities Analysis
   5.4. Product/Market Life Cycle Analysis
   5.5. Suppliers and Distributors
6. Steel Rebar Market, By Finishing Type
   6.1. Black Rebar
   6.2. Epoxy Coated Rebar
   6.3. Fabricated Rebar
   6.4. Others
7. Steel Rebar Market, By End-Use Industry
   7.1. Construction & Infrastructure
   7.2. Manufacturing
   7.3. Oil and Gas
8. Steel Rebar Market, By Geography
   8.1. Europe
      8.1.1. Germany
      8.1.2. France
      8.1.3. Italy
      8.1.4. Spain
      8.1.5. Russia
      8.1.6. U.K.
      8.1.7. Rest of Europe
   8.2. Asia Pacific
      8.2.1. China
      8.2.2. India
      8.2.3. Japan
      8.2.4. South Korea
      8.2.5. Rest of Asia-Pacific
   8.3. North America
      8.3.1. U.S.
      8.3.2. Canada
      8.3.3. Mexico
   8.4. Rest of the World (RoW)
      8.4.1. Brazil
      8.4.2. Rest of RoW
9. Steel Rebar Market – Market Entropy
   9.1. Expansion
   9.2. Technological Developments
   9.3. Merger & Acquisitions, and Joint Ventures
   9.4. Supply- Contract
10. Company Profiles (Overview, Financials, SWOT Analysis, Developments, Product Portfolio)
   10.1. Company 1  
   10.2. Company 2  
   10.3. Company 3  
   10.4. Company 4  
   10.5. Company 5  
   10.6. Company 6  
   10.7. Company 7  
   10.8. Company 8  
   10.9. Company 9  
   10.10. Company 10  
*More than 40 Companies are profiled in this Research Report, Complete List available on Request*
"*Financials would be provided on a best efforts basis for private companies"
11. Appendix

   11.1. Abbreviations
   11.2. Sources
   11.3. Research Methodology
   11.4. Bibliography
   11.5. Compilation of Expert Insights
   11.6. Disclaimer
List of Tables:

Table 1: Steel Rebar Market Overview 2021-2026
Table 2: Steel Rebar Market Leader Analysis 2018-2019 (US$)
Table 3: Steel Rebar Market Product Analysis 2018-2019 (US$)
Table 4: Steel Rebar Market End User Analysis 2018-2019 (US$)
Table 5: Steel Rebar Market Patent Analysis 2013-2018* (US$)
Table 6: Steel Rebar Market Financial Analysis 2018-2019 (US$)
Table 7: Steel Rebar Market Driver Analysis 2018-2019 (US$)
Table 8: Steel Rebar Market Challenges Analysis 2018-2019 (US$)
Table 9: Steel Rebar Market Constraint Analysis 2018-2019 (US$)
Table 10: Steel Rebar Market Supplier Bargaining Power Analysis 2018-2019 (US$)
Table 11: Steel Rebar Market Buyer Bargaining Power Analysis 2018-2019 (US$)
Table 12: Steel Rebar Market Threat of Substitutes Analysis 2018-2019 (US$)
Table 13: Steel Rebar Market Threat of New Entrants Analysis 2018-2019 (US$)
Table 14: Steel Rebar Market Degree of Competition Analysis 2018-2019 (US$)
Table 15: Steel Rebar Market Value Chain Analysis 2018-2019 (US$)
Table 16: Steel Rebar Market Pricing Analysis 2021-2026 (US$)
Table 17: Steel Rebar Market Opportunities Analysis 2021-2026 (US$)
Table 18: Steel Rebar Market Product Life Cycle Analysis 2021-2026 (US$)
Table 19: Steel Rebar Market Supplier Analysis 2018-2019 (US$)
Table 20: Steel Rebar Market Distributor Analysis 2018-2019 (US$)
Table 21: Steel Rebar Market Trend Analysis 2018-2019 (US$)
Table 22: Steel Rebar Market Size 2018 (US$)
Table 23: Steel Rebar Market Forecast Analysis 2021-2026 (US$)
Table 24: Steel Rebar Market Sales Forecast Analysis 2021-2026 (Units)
Table 25: Steel Rebar Market, Revenue & Volume, By Finishing Type, 2021-2026 ($)
Table 26: Steel Rebar Market By Finishing Type, Revenue & Volume,By Black Rebar, 2021-2026 ($)
Table 27: Steel Rebar Market By Finishing Type, Revenue & Volume,By Epoxy Coated Rebar, 2021-2026 ($)
Table 28: Steel Rebar Market By Finishing Type, Revenue & Volume,By Fabricated Rebar, 2021-2026 ($)
Table 29: Steel Rebar Market, Revenue & Volume,By End-Use Industry, 2021-2026 ($)
Table 30: Steel Rebar MarketBy End-Use Industry, Revenue & Volume,By Construction & Infrastructure, 2021-2026 ($)
Table 31: Steel Rebar MarketBy End-Use Industry, Revenue & Volume,By Manufacturing, 2021-2026 ($)
Table 32: Steel Rebar MarketBy End-Use Industry, Revenue & Volume,By Oil and Gas, 2021-2026 ($)
Table 33: North America Steel Rebar Market, Revenue & Volume, By Finishing Type, 2021-2026 ($)
Table 34: North America Steel Rebar Market, Revenue & Volume,By End-Use Industry, 2021-2026 ($)
Table 35: South america Steel Rebar Market, Revenue & Volume, By Finishing Type, 2021-2026 ($)
Table 36: South america Steel Rebar Market, Revenue & Volume,By End-Use Industry, 2021-2026 ($)
Table 37: Europe Steel Rebar Market, Revenue & Volume, By Finishing Type, 2021-2026 ($)
Table 38: Europe Steel Rebar Market, Revenue & Volume,By End-Use Industry, 2021-2026 ($)
Table 39: APAC  Steel Rebar Market, Revenue & Volume, By Finishing Type, 2021-2026 ($)
Table 40: APAC  Steel Rebar Market, Revenue & Volume,By End-Use Industry, 2021-2026 ($)
Table 41: Middle East & Africa Steel Rebar Market, Revenue & Volume, By Finishing Type, 2021-2026 ($)
Table 42: Middle East & Africa Steel Rebar Market, Revenue & Volume,By End-Use Industry, 2021-2026 ($)
Table 43: Russia Steel Rebar Market, Revenue & Volume, By Finishing Type, 2021-2026 ($)
Table 44: Russia Steel Rebar Market, Revenue & Volume,By End-Use Industry, 2021-2026 ($)
Table 45: Israel Steel Rebar Market, Revenue & Volume, By Finishing Type, 2021-2026 ($)
Table 46: Israel Steel Rebar Market, Revenue & Volume,By End-Use Industry, 2021-2026 ($)
Table 47: Top Companies 2018 (US$)Steel Rebar Market, Revenue & Volume
Table 48: Product Launch 2018-2019Steel Rebar Market, Revenue & Volume
Table 49: Mergers & Acquistions 2018-2019Steel Rebar Market, Revenue & Volume


List of Figures:

Figure 1: Overview of Steel Rebar Market 2021-2026
Figure 2: Market Share Analysis for Steel Rebar Market 2018 (US$)
Figure 3: Product Comparison in Steel Rebar Market 2018-2019 (US$)
Figure 4: End User Profile for Steel Rebar Market 2018-2019 (US$)
Figure 5: Patent Application and Grant in Steel Rebar Market 2013-2018* (US$)
Figure 6: Top 5 Companies Financial Analysis in Steel Rebar Market 2018-2019 (US$)
Figure 7: Market Entry Strategy in Steel Rebar Market 2018-2019
Figure 8: Ecosystem Analysis in Steel Rebar Market2018
Figure 9: Average Selling Price in Steel Rebar Market 2021-2026
Figure 10: Top Opportunites in Steel Rebar Market 2018-2019
Figure 11: Market Life Cycle Analysis in Steel Rebar Market
Figure 12: Global By Finishing TypeSteel Rebar Market Revenue, 2021-2026 ($)
Figure 13: GlobalBy End-Use IndustrySteel Rebar Market Revenue, 2021-2026 ($)
Figure 14: Global Steel Rebar Market - By Geography
Figure 15: Global Steel Rebar Market Value & Volume, By Geography, 2021-2026 ($) 
Figure 16: Global Steel Rebar Market CAGR, By Geography, 2021-2026 (%)
Figure 17: North America Steel Rebar Market Value & Volume, 2021-2026 ($)
Figure 18: US Steel Rebar Market Value & Volume, 2021-2026 ($)
Figure 19: US GDP and Population, 2018-2019 ($)
Figure 20: US GDP – Composition of 2018, By Sector of Origin
Figure 21: US Export and Import Value & Volume, 2018-2019 ($)
Figure 22: Canada Steel Rebar Market Value & Volume, 2021-2026 ($)
Figure 23: Canada GDP and Population, 2018-2019 ($)
Figure 24: Canada GDP – Composition of 2018, By Sector of Origin
Figure 25: Canada Export and Import Value & Volume, 2018-2019 ($)
Figure 26: Mexico Steel Rebar Market Value & Volume, 2021-2026 ($)
Figure 27: Mexico GDP and Population, 2018-2019 ($)
Figure 28: Mexico GDP – Composition of 2018, By Sector of Origin
Figure 29: Mexico Export and Import Value & Volume, 2018-2019 ($)
Figure 30: South America Steel Rebar MarketSouth America 3D Printing  Market Value & Volume, 2021-2026 ($)
Figure 31: Brazil Steel Rebar Market Value & Volume, 2021-2026 ($)
Figure 32: Brazil GDP and Population, 2018-2019 ($)
Figure 33: Brazil GDP – Composition of 2018, By Sector of Origin
Figure 34: Brazil Export and Import Value & Volume, 2018-2019 ($)
Figure 35: Venezuela Steel Rebar Market Value & Volume, 2021-2026 ($)
Figure 36: Venezuela GDP and Population, 2018-2019 ($)
Figure 37: Venezuela GDP – Composition of 2018, By Sector of Origin
Figure 38: Venezuela Export and Import Value & Volume, 2018-2019 ($)
Figure 39: Argentina Steel Rebar Market Value & Volume, 2021-2026 ($)
Figure 40: Argentina GDP and Population, 2018-2019 ($)
Figure 41: Argentina GDP – Composition of 2018, By Sector of Origin
Figure 42: Argentina Export and Import Value & Volume, 2018-2019 ($)
Figure 43: Ecuador Steel Rebar Market Value & Volume, 2021-2026 ($)
Figure 44: Ecuador GDP and Population, 2018-2019 ($)
Figure 45: Ecuador GDP – Composition of 2018, By Sector of Origin
Figure 46: Ecuador Export and Import Value & Volume, 2018-2019 ($)
Figure 47: Peru Steel Rebar Market Value & Volume, 2021-2026 ($)
Figure 48: Peru GDP and Population, 2018-2019 ($)
Figure 49: Peru GDP – Composition of 2018, By Sector of Origin
Figure 50: Peru Export and Import Value & Volume, 2018-2019 ($)
Figure 51: Colombia Steel Rebar Market Value & Volume, 2021-2026 ($)
Figure 52: Colombia GDP and Population, 2018-2019 ($)
Figure 53: Colombia GDP – Composition of 2018, By Sector of Origin
Figure 54: Colombia Export and Import Value & Volume, 2018-2019 ($)
Figure 55: Costa Rica Steel Rebar MarketCosta Rica 3D Printing  Market Value & Volume, 2021-2026 ($)
Figure 56: Costa Rica GDP and Population, 2018-2019 ($)
Figure 57: Costa Rica GDP – Composition of 2018, By Sector of Origin
Figure 58: Costa Rica Export and Import Value & Volume, 2018-2019 ($)
Figure 59: Europe Steel Rebar Market Value & Volume, 2021-2026 ($)
Figure 60: U.K Steel Rebar Market Value & Volume, 2021-2026 ($)
Figure 61: U.K GDP and Population, 2018-2019 ($)
Figure 62: U.K GDP – Composition of 2018, By Sector of Origin
Figure 63: U.K Export and Import Value & Volume, 2018-2019 ($)
Figure 64: Germany Steel Rebar Market Value & Volume, 2021-2026 ($)
Figure 65: Germany GDP and Population, 2018-2019 ($)
Figure 66: Germany GDP – Composition of 2018, By Sector of Origin
Figure 67: Germany Export and Import Value & Volume, 2018-2019 ($)
Figure 68: Italy Steel Rebar Market Value & Volume, 2021-2026 ($)
Figure 69: Italy GDP and Population, 2018-2019 ($)
Figure 70: Italy GDP – Composition of 2018, By Sector of Origin
Figure 71: Italy Export and Import Value & Volume, 2018-2019 ($)
Figure 72: France Steel Rebar Market Value & Volume, 2021-2026 ($)
Figure 73: France GDP and Population, 2018-2019 ($)
Figure 74: France GDP – Composition of 2018, By Sector of Origin
Figure 75: France Export and Import Value & Volume, 2018-2019 ($)
Figure 76: Netherlands Steel Rebar Market Value & Volume, 2021-2026 ($)
Figure 77: Netherlands GDP and Population, 2018-2019 ($)
Figure 78: Netherlands GDP – Composition of 2018, By Sector of Origin
Figure 79: Netherlands Export and Import Value & Volume, 2018-2019 ($)
Figure 80: Belgium Steel Rebar Market Value & Volume, 2021-2026 ($)
Figure 81: Belgium GDP and Population, 2018-2019 ($)
Figure 82: Belgium GDP – Composition of 2018, By Sector of Origin
Figure 83: Belgium Export and Import Value & Volume, 2018-2019 ($)
Figure 84: Spain Steel Rebar Market Value & Volume, 2021-2026 ($)
Figure 85: Spain GDP and Population, 2018-2019 ($)
Figure 86: Spain GDP – Composition of 2018, By Sector of Origin
Figure 87: Spain Export and Import Value & Volume, 2018-2019 ($)
Figure 88: Denmark Steel Rebar Market Value & Volume, 2021-2026 ($)
Figure 89: Denmark GDP and Population, 2018-2019 ($)
Figure 90: Denmark GDP – Composition of 2018, By Sector of Origin
Figure 91: Denmark Export and Import Value & Volume, 2018-2019 ($)
Figure 92: APAC Steel Rebar Market Value & Volume, 2021-2026 ($)
Figure 93: China Steel Rebar MarketValue & Volume, 2021-2026
Figure 94: China GDP and Population, 2018-2019 ($)
Figure 95: China GDP – Composition of 2018, By Sector of Origin
Figure 96: China Export and Import Value & Volume, 2018-2019 ($)Steel Rebar MarketChina Export and Import Value & Volume, 2018-2019 ($)
Figure 97: Australia Steel Rebar Market Value & Volume, 2021-2026 ($)
Figure 98: Australia GDP and Population, 2018-2019 ($)
Figure 99: Australia GDP – Composition of 2018, By Sector of Origin
Figure 100: Australia Export and Import Value & Volume, 2018-2019 ($)
Figure 101: South Korea Steel Rebar Market Value & Volume, 2021-2026 ($)
Figure 102: South Korea GDP and Population, 2018-2019 ($)
Figure 103: South Korea GDP – Composition of 2018, By Sector of Origin
Figure 104: South Korea Export and Import Value & Volume, 2018-2019 ($)
Figure 105: India Steel Rebar Market Value & Volume, 2021-2026 ($)
Figure 106: India GDP and Population, 2018-2019 ($)
Figure 107: India GDP – Composition of 2018, By Sector of Origin
Figure 108: India Export and Import Value & Volume, 2018-2019 ($)
Figure 109: Taiwan Steel Rebar MarketTaiwan 3D Printing  Market Value & Volume, 2021-2026 ($)
Figure 110: Taiwan GDP and Population, 2018-2019 ($)
Figure 111: Taiwan GDP – Composition of 2018, By Sector of Origin
Figure 112: Taiwan Export and Import Value & Volume, 2018-2019 ($)
Figure 113: Malaysia Steel Rebar MarketMalaysia 3D Printing  Market Value & Volume, 2021-2026 ($)
Figure 114: Malaysia GDP and Population, 2018-2019 ($)
Figure 115: Malaysia GDP – Composition of 2018, By Sector of Origin
Figure 116: Malaysia Export and Import Value & Volume, 2018-2019 ($)
Figure 117: Hong Kong Steel Rebar MarketHong Kong 3D Printing  Market Value & Volume, 2021-2026 ($)
Figure 118: Hong Kong GDP and Population, 2018-2019 ($)
Figure 119: Hong Kong GDP – Composition of 2018, By Sector of Origin
Figure 120: Hong Kong Export and Import Value & Volume, 2018-2019 ($)
Figure 121: Middle East & Africa Steel Rebar MarketMiddle East & Africa 3D Printing  Market Value & Volume, 2021-2026 ($)
Figure 122: Russia Steel Rebar MarketRussia 3D Printing  Market Value & Volume, 2021-2026 ($)
Figure 123: Russia GDP and Population, 2018-2019 ($)
Figure 124: Russia GDP – Composition of 2018, By Sector of Origin
Figure 125: Russia Export and Import Value & Volume, 2018-2019 ($)
Figure 126: Israel Steel Rebar Market Value & Volume, 2021-2026 ($)
Figure 127: Israel GDP and Population, 2018-2019 ($)
Figure 128: Israel GDP – Composition of 2018, By Sector of Origin
Figure 129: Israel Export and Import Value & Volume, 2018-2019 ($)
Figure 130:  Entropy Share, By Strategies, 2018-2019* (%)Steel Rebar Market
Figure 131:  Developments, 2018-2019*Steel Rebar Market
Figure 132: Company 1 Steel Rebar Market Net Revenue, By Years, 2018-2019* ($)
Figure 133: Company 1 Steel Rebar Market Net Revenue Share, By Business segments, 2018 (%)
Figure 134: Company 1 Steel Rebar Market Net Sales Share, By Geography, 2018 (%)
Figure 135: Company 2 Steel Rebar Market Net Revenue, By Years, 2018-2019* ($)
Figure 136: Company 2 Steel Rebar Market Net Revenue Share, By Business segments, 2018 (%)
Figure 137: Company 2 Steel Rebar Market Net Sales Share, By Geography, 2018 (%)
Figure 138: Company 3Steel Rebar Market Net Revenue, By Years, 2018-2019* ($)
Figure 139: Company 3Steel Rebar Market Net Revenue Share, By Business segments, 2018 (%)
Figure 140: Company 3Steel Rebar Market Net Sales Share, By Geography, 2018 (%)
Figure 141: Company 4 Steel Rebar Market Net Revenue, By Years, 2018-2019* ($)
Figure 142: Company 4 Steel Rebar Market Net Revenue Share, By Business segments, 2018 (%)
Figure 143: Company 4 Steel Rebar Market Net Sales Share, By Geography, 2018 (%)
Figure 144: Company 5 Steel Rebar Market Net Revenue, By Years, 2018-2019* ($)
Figure 145: Company 5 Steel Rebar Market Net Revenue Share, By Business segments, 2018 (%)
Figure 146: Company 5 Steel Rebar Market Net Sales Share, By Geography, 2018 (%)
Figure 147: Company 6 Steel Rebar Market Net Revenue, By Years, 2018-2019* ($)
Figure 148: Company 6 Steel Rebar Market Net Revenue Share, By Business segments, 2018 (%)
Figure 149: Company 6 Steel Rebar Market Net Sales Share, By Geography, 2018 (%)
Figure 150: Company 7 Steel Rebar Market  Net Revenue, By Years, 2018-2019* ($)
Figure 151: Company 7 Steel Rebar Market  Net Revenue Share, By Business segments, 2018 (%)
Figure 152: Company 7 Steel Rebar Market  Net Sales Share, By Geography, 2018 (%)
Figure 153: Company 8 Steel Rebar Market  Net Revenue, By Years, 2018-2019* ($)
Figure 154: Company 8 Steel Rebar Market  Net Revenue Share, By Business segments, 2018 (%)
Figure 155: Company 8 Steel Rebar Market  Net Sales Share, By Geography, 2018 (%)
Figure 156: Company 9 Steel Rebar Market  Net Revenue, By Years, 2018-2019* ($)
Figure 157: Company 9 Steel Rebar Market  Net Revenue Share, By Business segments, 2018 (%)
Figure 158: Company 9 Steel Rebar Market  Net Sales Share, By Geography, 2018 (%)
Figure 159: Company 10 Steel Rebar Market  Net Revenue, By Years, 2018-2019* ($)
Figure 160: Company 10 Steel Rebar Market  Net Revenue Share, By Business segments, 2018 (%)
Figure 161: Company 10 Steel Rebar Market  Net Sales Share, By Geography, 2018 (%)
Figure 162: Company 11 Steel Rebar Market  Net Revenue, By Years, 2018-2019* ($)
Figure 163: Company 11 Steel Rebar Market  Net Revenue Share, By Business segments, 2018 (%)
Figure 164: Company 11 Steel Rebar Market  Net Sales Share, By Geography, 2018 (%)
Figure 165: Company 12 Steel Rebar Market  Net Revenue, By Years, 2018-2019* ($)
Figure 166: Company 12 Steel Rebar Market  Net Revenue Share, By Business segments, 2018 (%)
Figure 167: Company 12 Steel Rebar Market  Net Sales Share, By Geography, 2018 (%)
Figure 168: Company 13Steel Rebar Market  Net Revenue, By Years, 2018-2019* ($)
Figure 169: Company 13Steel Rebar Market Net Revenue Share, By Business segments, 2018 (%)
Figure 170: Company 13Steel Rebar Market  Net Sales Share, By Geography, 2018 (%)
Figure 171: Company 14 Steel Rebar Market  Net Revenue, By Years, 2018-2019* ($)
Figure 172: Company 14 Steel Rebar Market  Net Revenue Share, By Business segments, 2018 (%)
Figure 173: Company 14 Steel Rebar Market  Net Sales Share, By Geography, 2018 (%)
Figure 174: Company 15 Steel Rebar Market  Net Revenue, By Years, 2018-2019* ($)
Figure 175: Company 15 Steel Rebar Market  Net Revenue Share, By Business segments, 2018 (%)
Figure 176: Company 15 Steel Rebar Market  Net Sales Share, By Geography, 2018 (%)