 Email
Email Print
Print


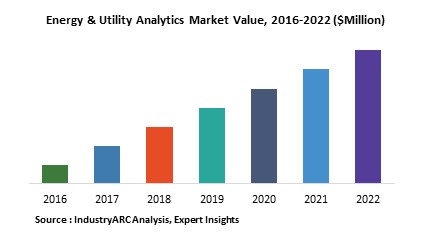
Energy & Utility Analytics Market-By Analytics; By Type (Software and Service); By Deployment (On Premise, Cloud and Hybrid); By Vertical; By Geography (Americas, Europe, Asia Pacific, RoW) Forecast (2024 - 2030)
- Top level CEOS and industry leaders are increasingly adopting analytics in their daily business operations. Environmental awareness and increasing costs are terms which are heard on a regular basis in this industry. To combat these issues companies are ditching traditional methods and are increasingly opting for smart devices. Major players use analytical tools such as big data, predictive, descriptive, diagnostic and prescriptive to evaluate trends and obtain actionable information.
- The EnergyIP Analytics Suite service introduced by Siemens helps consumer’s access energy efficiently and effectively. The company uses a metering system and an app to record all the important energy data from their sources. Smart meters and smart energy grids record and transfer data regularly to service providers. With the help of excellence teams and analytics companies are able to understand consumer usage patterns, forecast demand, maintain energy constraints more efficiently, check upon fraud, minimize losses and enhance customer services. Also, many companies are providing full-fledged home automation services, a system is installed at home to track and remotely control all the devices at home. Users can access all appliances from their smartphones and either turn on or turn off depending on their usage without being physically present.
- Evaluate market potential through analyzing growth rates (CAGR %), Volume (Units) and Value ($M) data given at country level – for product types, end use applications and by different industry verticals.
- Understand the different dynamics influencing the market – key driving factors, challenges and hidden opportunities.
- Get in-depth insights on your competitor performance – market shares, strategies, financial benchmarking, product benchmarking, SWOT and more.
- Analyze the sales and distribution channels across key geographies to improve top-line revenues.
- Understand the industry supply chain with a deep-dive on the value augmentation at each step, in order to optimize value and bring efficiencies in your processes.
- Get a quick outlook on the market entropy – M&A’s, deals, partnerships, product launches of all key players for the past 4 years.
- Evaluate the supply-demand gaps, import-export statistics and regulatory landscape for more than top 20 countries globally for the market.
Key Market Players:
The Top 5 companies in the Energy & Utility Analytics Market are:
1 IBM Corporation
2 Siemens
3 SAP
4. Oracle Corporation
5 Salesforce, Inc
List of Tables:
Table 1: Energy & Utility Analytics Market Overview 2023-2030
Table 2: Energy & Utility Analytics Market Leader Analysis 2023-2030 (US$)
Table 3: Energy & Utility Analytics Market Product Analysis 2023-2030 (US$)
Table 4: Energy & Utility Analytics Market End User Analysis 2023-2030 (US$)
Table 5: Energy & Utility Analytics Market Patent Analysis 2013-2023* (US$)
Table 6: Energy & Utility Analytics Market Financial Analysis 2023-2030 (US$)
Table 7: Energy & Utility Analytics Market Driver Analysis 2023-2030 (US$)
Table 8: Energy & Utility Analytics Market Challenges Analysis 2023-2030 (US$)
Table 9: Energy & Utility Analytics Market Constraint Analysis 2023-2030 (US$)
Table 10: Energy & Utility Analytics Market Supplier Bargaining Power Analysis 2023-2030 (US$)
Table 11: Energy & Utility Analytics Market Buyer Bargaining Power Analysis 2023-2030 (US$)
Table 12: Energy & Utility Analytics Market Threat of Substitutes Analysis 2023-2030 (US$)
Table 13: Energy & Utility Analytics Market Threat of New Entrants Analysis 2023-2030 (US$)
Table 14: Energy & Utility Analytics Market Degree of Competition Analysis 2023-2030 (US$)
Table 15: Energy & Utility Analytics Market Value Chain Analysis 2023-2030 (US$)
Table 16: Energy & Utility Analytics Market Pricing Analysis 2023-2030 (US$)
Table 17: Energy & Utility Analytics Market Opportunities Analysis 2023-2030 (US$)
Table 18: Energy & Utility Analytics Market Product Life Cycle Analysis 2023-2030 (US$)
Table 19: Energy & Utility Analytics Market Supplier Analysis 2023-2030 (US$)
Table 20: Energy & Utility Analytics Market Distributor Analysis 2023-2030 (US$)
Table 21: Energy & Utility Analytics Market Trend Analysis 2023-2030 (US$)
Table 22: Energy & Utility Analytics Market Size 2023 (US$)
Table 23: Energy & Utility Analytics Market Forecast Analysis 2023-2030 (US$)
Table 24: Energy & Utility Analytics Market Sales Forecast Analysis 2023-2030 (Units)
Table 25: Energy & Utility Analytics Market, Revenue & Volume, By Type, 2023-2030 ($)
Table 26: Energy & Utility Analytics Market By Type, Revenue & Volume, By Software, 2023-2030 ($)
Table 27: Energy & Utility Analytics Market By Type, Revenue & Volume, By Service, 2023-2030 ($)
Table 28: Energy & Utility Analytics Market, Revenue & Volume, By Deployment, 2023-2030 ($)
Table 29: Energy & Utility Analytics Market By Deployment, Revenue & Volume, By Onsite, 2023-2030 ($)
Table 30: Energy & Utility Analytics Market By Deployment, Revenue & Volume, By Hosted, 2023-2030 ($)
Table 31: Energy & Utility Analytics Market, Revenue & Volume, By Vertical, 2023-2030 ($)
Table 32: Energy & Utility Analytics Market By Vertical, Revenue & Volume, By Oil & Gas, 2023-2030 ($)
Table 33: Energy & Utility Analytics Market By Vertical, Revenue & Volume, By Utility Services, 2023-2030 ($)
Table 34: Energy & Utility Analytics Market, Revenue & Volume, By Application, 2023-2030 ($)
Table 35: Energy & Utility Analytics Market By Application, Revenue & Volume, By Load Research & Forecasting, 2023-2030 ($)
Table 36: Energy & Utility Analytics Market By Application, Revenue & Volume, By Meter Operation & Optimization, 2023-2030 ($)
Table 37: Energy & Utility Analytics Market By Application, Revenue & Volume, By Transmission & Distribution Management, 2023-2030 ($)
Table 38: Energy & Utility Analytics Market By Application, Revenue & Volume, By Predictive Maintenance, 2023-2030 ($)
Table 39: Energy & Utility Analytics Market By Application, Revenue & Volume, By Workforce Management, 2023-2030 ($)
Table 40: North America Energy & Utility Analytics Market, Revenue & Volume, By Type, 2023-2030 ($)
Table 41: North America Energy & Utility Analytics Market, Revenue & Volume, By Deployment, 2023-2030 ($)
Table 42: North America Energy & Utility Analytics Market, Revenue & Volume, By Vertical, 2023-2030 ($)
Table 43: North America Energy & Utility Analytics Market, Revenue & Volume, By Application, 2023-2030 ($)
Table 44: South america Energy & Utility Analytics Market, Revenue & Volume, By Type, 2023-2030 ($)
Table 45: South america Energy & Utility Analytics Market, Revenue & Volume, By Deployment, 2023-2030 ($)
Table 46: South america Energy & Utility Analytics Market, Revenue & Volume, By Vertical, 2023-2030 ($)
Table 47: South america Energy & Utility Analytics Market, Revenue & Volume, By Application, 2023-2030 ($)
Table 48: Europe Energy & Utility Analytics Market, Revenue & Volume, By Type, 2023-2030 ($)
Table 49: Europe Energy & Utility Analytics Market, Revenue & Volume, By Deployment, 2023-2030 ($)
Table 50: Europe Energy & Utility Analytics Market, Revenue & Volume, By Vertical, 2023-2030 ($)
Table 51: Europe Energy & Utility Analytics Market, Revenue & Volume, By Application, 2023-2030 ($)
Table 52: APAC Energy & Utility Analytics Market, Revenue & Volume, By Type, 2023-2030 ($)
Table 53: APAC Energy & Utility Analytics Market, Revenue & Volume, By Deployment, 2023-2030 ($)
Table 54: APAC Energy & Utility Analytics Market, Revenue & Volume, By Vertical, 2023-2030 ($)
Table 55: APAC Energy & Utility Analytics Market, Revenue & Volume, By Application, 2023-2030 ($)
Table 56: Middle East & Africa Energy & Utility Analytics Market, Revenue & Volume, By Type, 2023-2030 ($)
Table 57: Middle East & Africa Energy & Utility Analytics Market, Revenue & Volume, By Deployment, 2023-2030 ($)
Table 58: Middle East & Africa Energy & Utility Analytics Market, Revenue & Volume, By Vertical, 2023-2030 ($)
Table 59: Middle East & Africa Energy & Utility Analytics Market, Revenue & Volume, By Application, 2023-2030 ($)
Table 60: Russia Energy & Utility Analytics Market, Revenue & Volume, By Type, 2023-2030 ($)
Table 61: Russia Energy & Utility Analytics Market, Revenue & Volume, By Deployment, 2023-2030 ($)
Table 62: Russia Energy & Utility Analytics Market, Revenue & Volume, By Vertical, 2023-2030 ($)
Table 63: Russia Energy & Utility Analytics Market, Revenue & Volume, By Application, 2023-2030 ($)
Table 64: Israel Energy & Utility Analytics Market, Revenue & Volume, By Type, 2023-2030 ($)
Table 65: Israel Energy & Utility Analytics Market, Revenue & Volume, By Deployment, 2023-2030 ($)
Table 66: Israel Energy & Utility Analytics Market, Revenue & Volume, By Vertical, 2023-2030 ($)
Table 67: Israel Energy & Utility Analytics Market, Revenue & Volume, By Application, 2023-2030 ($)
Table 68: Top Companies 2023 (US$) Energy & Utility Analytics Market, Revenue & Volume
Table 69: Product Launch 2023-2030 Energy & Utility Analytics Market, Revenue & Volume
Table 70: Mergers & Acquistions 2023-2030 Energy & Utility Analytics Market, Revenue & Volume
List of Figures:
Figure 1: Overview of Energy & Utility Analytics Market 2023-2030
Figure 2: Market Share Analysis for Energy & Utility Analytics Market 2023 (US$)
Figure 3: Product Comparison in Energy & Utility Analytics Market 2023-2030 (US$)
Figure 4: End User Profile for Energy & Utility Analytics Market 2023-2030 (US$)
Figure 5: Patent Application and Grant in Energy & Utility Analytics Market 2013-2023* (US$)
Figure 6: Top 5 Companies Financial Analysis in Energy & Utility Analytics Market 2023-2030 (US$)
Figure 7: Market Entry Strategy in Energy & Utility Analytics Market 2023-2030
Figure 8: Ecosystem Analysis in Energy & Utility Analytics Market 2023
Figure 9: Average Selling Price in Energy & Utility Analytics Market 2023-2030
Figure 10: Top Opportunites in Energy & Utility Analytics Market 2023-2030
Figure 11: Market Life Cycle Analysis in Energy & Utility Analytics Market
Figure 12: GlobalBy Type Energy & Utility Analytics Market Revenue, 2023-2030 ($)
Figure 13: GlobalBy Deployment Energy & Utility Analytics Market Revenue, 2023-2030 ($)
Figure 14: GlobalBy Vertical Energy & Utility Analytics Market Revenue, 2023-2030 ($)
Figure 15: GlobalBy Application Energy & Utility Analytics Market Revenue, 2023-2030 ($)
Figure 16: Global Energy & Utility Analytics Market - By Geography
Figure 17: Global Energy & Utility Analytics Market Value & Volume, By Geography, 2023-2030 ($)
Figure 18: Global Energy & Utility Analytics Market CAGR, By Geography, 2023-2030 (%)
Figure 19: North America Energy & Utility Analytics Market Value & Volume, 2023-2030 ($)
Figure 20: US Energy & Utility Analytics Market Value & Volume, 2023-2030 ($)
Figure 21: US GDP and Population, 2023-2030 ($)
Figure 22: US GDP – Composition of 2023, By Sector of Origin
Figure 23: US Export and Import Value & Volume, 2023-2030 ($)
Figure 24: Canada Energy & Utility Analytics Market Value & Volume, 2023-2030 ($)
Figure 25: Canada GDP and Population, 2023-2030 ($)
Figure 26: Canada GDP – Composition of 2023, By Sector of Origin
Figure 27: Canada Export and Import Value & Volume, 2023-2030 ($)
Figure 28: Mexico Energy & Utility Analytics Market Value & Volume, 2023-2030 ($)
Figure 29: Mexico GDP and Population, 2023-2030 ($)
Figure 30: Mexico GDP – Composition of 2023, By Sector of Origin
Figure 31: Mexico Export and Import Value & Volume, 2023-2030 ($)
Figure 32: South America Energy & Utility Analytics Market Value & Volume, 2023-2030 ($)
Figure 33: Brazil Energy & Utility Analytics Market Value & Volume, 2023-2030 ($)
Figure 34: Brazil GDP and Population, 2023-2030 ($)
Figure 35: Brazil GDP – Composition of 2023, By Sector of Origin
Figure 36: Brazil Export and Import Value & Volume, 2023-2030 ($)
Figure 37: Venezuela Energy & Utility Analytics Market Value & Volume, 2023-2030 ($)
Figure 38: Venezuela GDP and Population, 2023-2030 ($)
Figure 39: Venezuela GDP – Composition of 2023, By Sector of Origin
Figure 40: Venezuela Export and Import Value & Volume, 2023-2030 ($)
Figure 41: Argentina Energy & Utility Analytics Market Value & Volume, 2023-2030 ($)
Figure 42: Argentina GDP and Population, 2023-2030 ($)
Figure 43: Argentina GDP – Composition of 2023, By Sector of Origin
Figure 44: Argentina Export and Import Value & Volume, 2023-2030 ($)
Figure 45: Ecuador Energy & Utility Analytics Market Value & Volume, 2023-2030 ($)
Figure 46: Ecuador GDP and Population, 2023-2030 ($)
Figure 47: Ecuador GDP – Composition of 2023, By Sector of Origin
Figure 48: Ecuador Export and Import Value & Volume, 2023-2030 ($)
Figure 49: Peru Energy & Utility Analytics Market Value & Volume, 2023-2030 ($)
Figure 50: Peru GDP and Population, 2023-2030 ($)
Figure 51: Peru GDP – Composition of 2023, By Sector of Origin
Figure 52: Peru Export and Import Value & Volume, 2023-2030 ($)
Figure 53: Colombia Energy & Utility Analytics Market Value & Volume, 2023-2030 ($)
Figure 54: Colombia GDP and Population, 2023-2030 ($)
Figure 55: Colombia GDP – Composition of 2023, By Sector of Origin
Figure 56: Colombia Export and Import Value & Volume, 2023-2030 ($)
Figure 57: Costa Rica Energy & Utility Analytics Market Value & Volume, 2023-2030 ($)
Figure 58: Costa Rica GDP and Population, 2023-2030 ($)
Figure 59: Costa Rica GDP – Composition of 2023, By Sector of Origin
Figure 60: Costa Rica Export and Import Value & Volume, 2023-2030 ($)
Figure 61: Europe Energy & Utility Analytics Market Value & Volume, 2023-2030 ($)
Figure 62: U.K Energy & Utility Analytics Market Value & Volume, 2023-2030 ($)
Figure 63: U.K GDP and Population, 2023-2030 ($)
Figure 64: U.K GDP – Composition of 2023, By Sector of Origin
Figure 65: U.K Export and Import Value & Volume, 2023-2030 ($)
Figure 66: Germany Energy & Utility Analytics Market Value & Volume, 2023-2030 ($)
Figure 67: Germany GDP and Population, 2023-2030 ($)
Figure 68: Germany GDP – Composition of 2023, By Sector of Origin
Figure 69: Germany Export and Import Value & Volume, 2023-2030 ($)
Figure 70: Italy Energy & Utility Analytics Market Value & Volume, 2023-2030 ($)
Figure 71: Italy GDP and Population, 2023-2030 ($)
Figure 72: Italy GDP – Composition of 2023, By Sector of Origin
Figure 73: Italy Export and Import Value & Volume, 2023-2030 ($)
Figure 74: France Energy & Utility Analytics Market Value & Volume, 2023-2030 ($)
Figure 75: France GDP and Population, 2023-2030 ($)
Figure 76: France GDP – Composition of 2023, By Sector of Origin
Figure 77: France Export and Import Value & Volume, 2023-2030 ($)
Figure 78: Netherlands Energy & Utility Analytics Market Value & Volume, 2023-2030 ($)
Figure 79: Netherlands GDP and Population, 2023-2030 ($)
Figure 80: Netherlands GDP – Composition of 2023, By Sector of Origin
Figure 81: Netherlands Export and Import Value & Volume, 2023-2030 ($)
Figure 82: Belgium Energy & Utility Analytics Market Value & Volume, 2023-2030 ($)
Figure 83: Belgium GDP and Population, 2023-2030 ($)
Figure 84: Belgium GDP – Composition of 2023, By Sector of Origin
Figure 85: Belgium Export and Import Value & Volume, 2023-2030 ($)
Figure 86: Spain Energy & Utility Analytics Market Value & Volume, 2023-2030 ($)
Figure 87: Spain GDP and Population, 2023-2030 ($)
Figure 88: Spain GDP – Composition of 2023, By Sector of Origin
Figure 89: Spain Export and Import Value & Volume, 2023-2030 ($)
Figure 90: Denmark Energy & Utility Analytics Market Value & Volume, 2023-2030 ($)
Figure 91: Denmark GDP and Population, 2023-2030 ($)
Figure 92: Denmark GDP – Composition of 2023, By Sector of Origin
Figure 93: Denmark Export and Import Value & Volume, 2023-2030 ($)
Figure 94: APAC Energy & Utility Analytics Market Value & Volume, 2023-2030 ($)
Figure 95: China Energy & Utility Analytics Market Value & Volume, 2023-2030
Figure 96: China GDP and Population, 2023-2030 ($)
Figure 97: China GDP – Composition of 2023, By Sector of Origin
Figure 98: China Export and Import Value & Volume, 2023-2030 ($) Energy & Utility Analytics Market China Export and Import Value & Volume, 2023-2030 ($)
Figure 99: Australia Energy & Utility Analytics Market Value & Volume, 2023-2030 ($)
Figure 100: Australia GDP and Population, 2023-2030 ($)
Figure 101: Australia GDP – Composition of 2023, By Sector of Origin
Figure 102: Australia Export and Import Value & Volume, 2023-2030 ($)
Figure 103: South Korea Energy & Utility Analytics Market Value & Volume, 2023-2030 ($)
Figure 104: South Korea GDP and Population, 2023-2030 ($)
Figure 105: South Korea GDP – Composition of 2023, By Sector of Origin
Figure 106: South Korea Export and Import Value & Volume, 2023-2030 ($)
Figure 107: India Energy & Utility Analytics Market Value & Volume, 2023-2030 ($)
Figure 108: India GDP and Population, 2023-2030 ($)
Figure 109: India GDP – Composition of 2023, By Sector of Origin
Figure 110: India Export and Import Value & Volume, 2023-2030 ($)
Figure 111: Taiwan Energy & Utility Analytics Market Value & Volume, 2023-2030 ($)
Figure 112: Taiwan GDP and Population, 2023-2030 ($)
Figure 113: Taiwan GDP – Composition of 2023, By Sector of Origin
Figure 114: Taiwan Export and Import Value & Volume, 2023-2030 ($)
Figure 115: Malaysia Energy & Utility Analytics Market Value & Volume, 2023-2030 ($)
Figure 116: Malaysia GDP and Population, 2023-2030 ($)
Figure 117: Malaysia GDP – Composition of 2023, By Sector of Origin
Figure 118: Malaysia Export and Import Value & Volume, 2023-2030 ($)
Figure 119: Hong Kong Energy & Utility Analytics Market Value & Volume, 2023-2030 ($)
Figure 120: Hong Kong GDP and Population, 2023-2030 ($)
Figure 121: Hong Kong GDP – Composition of 2023, By Sector of Origin
Figure 122: Hong Kong Export and Import Value & Volume, 2023-2030 ($)
Figure 123: Middle East & Africa Energy & Utility Analytics Market Middle East & Africa 3D Printing Market Value & Volume, 2023-2030 ($)
Figure 124: Russia Energy & Utility Analytics Market Value & Volume, 2023-2030 ($)
Figure 125: Russia GDP and Population, 2023-2030 ($)
Figure 126: Russia GDP – Composition of 2023, By Sector of Origin
Figure 127: Russia Export and Import Value & Volume, 2023-2030 ($)
Figure 128: Israel Energy & Utility Analytics Market Value & Volume, 2023-2030 ($)
Figure 129: Israel GDP and Population, 2023-2030 ($)
Figure 130: Israel GDP – Composition of 2023, By Sector of Origin
Figure 131: Israel Export and Import Value & Volume, 2023-2030 ($)
Figure 132: Entropy Share, By Strategies, 2023-2030* (%) Energy & Utility Analytics Market
Figure 133: Developments, 2023-2030* Energy & Utility Analytics Market
Figure 134: Company 1 Energy & Utility Analytics Market Net Revenue, By Years, 2023-2030* ($)
Figure 135: Company 1 Energy & Utility Analytics Market Net Revenue Share, By Business segments, 2023 (%)
Figure 136: Company 1 Energy & Utility Analytics Market Net Sales Share, By Geography, 2023 (%)
Figure 137: Company 2 Energy & Utility Analytics Market Net Revenue, By Years, 2023-2030* ($)
Figure 138: Company 2 Energy & Utility Analytics Market Net Revenue Share, By Business segments, 2023 (%)
Figure 139: Company 2 Energy & Utility Analytics Market Net Sales Share, By Geography, 2023 (%)
Figure 140: Company 3 Energy & Utility Analytics Market Net Revenue, By Years, 2023-2030* ($)
Figure 141: Company 3 Energy & Utility Analytics Market Net Revenue Share, By Business segments, 2023 (%)
Figure 142: Company 3 Energy & Utility Analytics Market Net Sales Share, By Geography, 2023 (%)
Figure 143: Company 4 Energy & Utility Analytics Market Net Revenue, By Years, 2023-2030* ($)
Figure 144: Company 4 Energy & Utility Analytics Market Net Revenue Share, By Business segments, 2023 (%)
Figure 145: Company 4 Energy & Utility Analytics Market Net Sales Share, By Geography, 2023 (%)
Figure 146: Company 5 Energy & Utility Analytics Market Net Revenue, By Years, 2023-2030* ($)
Figure 147: Company 5 Energy & Utility Analytics Market Net Revenue Share, By Business segments, 2023 (%)
Figure 148: Company 5 Energy & Utility Analytics Market Net Sales Share, By Geography, 2023 (%)
Figure 149: Company 6 Energy & Utility Analytics Market Net Revenue, By Years, 2023-2030* ($)
Figure 150: Company 6 Energy & Utility Analytics Market Net Revenue Share, By Business segments, 2023 (%)
Figure 151: Company 6 Energy & Utility Analytics Market Net Sales Share, By Geography, 2023 (%)
Figure 152: Company 7 Energy & Utility Analytics Market Net Revenue, By Years, 2023-2030* ($)
Figure 153: Company 7 Energy & Utility Analytics Market Net Revenue Share, By Business segments, 2023 (%)
Figure 154: Company 7 Energy & Utility Analytics Market Net Sales Share, By Geography, 2023 (%)
Figure 155: Company 8 Energy & Utility Analytics Market Net Revenue, By Years, 2023-2030* ($)
Figure 156: Company 8 Energy & Utility Analytics Market Net Revenue Share, By Business segments, 2023 (%)
Figure 157: Company 8 Energy & Utility Analytics Market Net Sales Share, By Geography, 2023 (%)
Figure 158: Company 9 Energy & Utility Analytics Market Net Revenue, By Years, 2023-2030* ($)
Figure 159: Company 9 Energy & Utility Analytics Market Net Revenue Share, By Business segments, 2023 (%)
Figure 160: Company 9 Energy & Utility Analytics Market Net Sales Share, By Geography, 2023 (%)
Figure 161: Company 10 Energy & Utility Analytics Market Net Revenue, By Years, 2023-2030* ($)
Figure 162: Company 10 Energy & Utility Analytics Market Net Revenue Share, By Business segments, 2023 (%)
Figure 163: Company 10 Energy & Utility Analytics Market Net Sales Share, By Geography, 2023 (%)
Figure 164: Company 11 Energy & Utility Analytics Market Net Revenue, By Years, 2023-2030* ($)
Figure 165: Company 11 Energy & Utility Analytics Market Net Revenue Share, By Business segments, 2023 (%)
Figure 166: Company 11 Energy & Utility Analytics Market Net Sales Share, By Geography, 2023 (%)
Figure 167: Company 12 Energy & Utility Analytics Market Net Revenue, By Years, 2023-2030* ($)
Figure 168: Company 12 Energy & Utility Analytics Market Net Revenue Share, By Business segments, 2023 (%)
Figure 169: Company 12 Energy & Utility Analytics Market Net Sales Share, By Geography, 2023 (%)
Figure 170: Company 13 Energy & Utility Analytics Market Net Revenue, By Years, 2023-2030* ($)
Figure 171: Company 13 Energy & Utility Analytics Market Net Revenue Share, By Business segments, 2023 (%)
Figure 172: Company 13 Energy & Utility Analytics Market Net Sales Share, By Geography, 2023 (%)
Figure 173: Company 14 Energy & Utility Analytics Market Net Revenue, By Years, 2023-2030* ($)
Figure 174: Company 14 Energy & Utility Analytics Market Net Revenue Share, By Business segments, 2023 (%)
Figure 175: Company 14 Energy & Utility Analytics Market Net Sales Share, By Geography, 2023 (%)
Figure 176: Company 15 Energy & Utility Analytics Market Net Revenue, By Years, 2023-2030* ($)
Figure 177: Company 15 Energy & Utility Analytics Market Net Revenue Share, By Business segments, 2023 (%)
Figure 178: Company 15 Energy & Utility Analytics Market Net Sales Share, By Geography, 2023 (%)