 Email
Email Print
Print


Smart Weapon Market- By Product By Platform By Technology & By Region-Forecast (2024 - 2030)
Smart Weapon Market overview
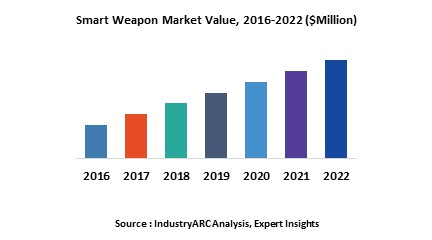
Smart Weapon Market Size is forecast to reach $ 33953 Million by 2030, at a CAGR of 8.34% during forecast period 2024-2030. Smart weapon can be defined as a guided munition equipped with a laser, television, or satellite guidance system intended to precisely hit a specific target, and to minimize collateral damage. Such weapons use guidance systems that rely on external assistance, are distinguished from brilliant weapons, which are totally self-guided. Globally, changing warfare tactics and rising need for precision munitions are expected to remain the key growth drivers for the smart weapons during the period of study.
Geographically, North America dominated the smart weapon market driven by higher defense budget and high spending on up gradation of its weapons technology. North America was followed by Europe and Asia-Pacific as second and third largest market for the smart weapon market. Asia Pacific is projected to have the fastest growth due to increasing defense budget of major economies like India and China to protect its borders from terrorism and intrusion activities in the region.
This report identifies the smart weapon market size for the years 2014-2016, and forecast of the same till the year 2022. It also highlights the market drivers, restraints, growth indicators, challenges, and other key aspects with respect to the smart weapon market.
This report segments the smart weapon market on the basis of product type, platform, technology and regional market as follows:
- Smart weapon market research report is classified on the basis of product type. Some of the major product types covered in this report are as follows: Missiles, Munitions, Guided Projectile, Guided Rocket, Guided Firearms
- Smart weapon market research report is classified on the basis of platform. Some of the major platforms covered in this report are as follows: Air, Land, Naval
- Smart weapon market research report is classified on the basis of technology. Some of the major technologies covered in this report are as follows: Laser, Infrared, Radar, GPS, Others)
- This report has been further segmented into major regions, which includes detailed analysis of each region such as: North America, Europe, Asia-Pacific (APAC), and Rest of the World (RoW) covering all the major country level markets in each of the region
Sample Companies profiled in this Report are:
- Lockheed Martin Corporation
- Raytheon Company
- MBDA, Inc.
- General Dynamics Corporation
- Orbital ATK
- 10+.
Key Market Players:
The Top 5 companies in the Smart Weapon Market are:
1.Lockheed Martin Corporation
2.Raytheon Company
3.The Boeing Company
4.Northrop Grumman Corporation
5.Rheinmetall AG
For more Aerospace and Defense Market reports, please click here
1. Smart weapon Market – Overview
2. Executive Summary
3. Smart weapon Market Landscape
3.1. Market Share Analysis
3.2. Comparative Analysis
3.3. Product Benchmarking
3.4. End User Profiling
3.5. Top 5 Financials Analysis
4. Smart weapon Market– Forces
4.1. Drivers
4.1.1. Rising Need for Precision Munitions
4.1.2. Reducing Logistics Burden
4.2. Restraints
4.3. Opportunities
4.4. Challenges
4.5. Porter’s Five Forces Analysis
4.5.1. Bargaining Power of Suppliers
4.5.2. Bargaining Power of Buyers
4.5.3. Threat of New Entrants
4.5.4. Threat of Substitutes
4.5.5. Degree of Competition
5. Smart weapon Market– Strategic Analysis
5.1. Value Chain Analysis
5.2. Pricing Analysis
5.3. Opportunities Analysis
5.4. Product/Market Life Cycle Analysis
5.5. Suppliers and Distributors
6. Smart weapon Market, By Product Type
6.1. Missiles
6.2. Munitions
6.3. Guided Projectile
6.4. Guided Rocket
6.5. Guided Firearms
6.6. Others
7. Smart weapon Market, By Platform
7.1. Air
7.2. Land
7.3. Naval
8. Smart weapon Market, By Technology
8.1. Laser
8.2. Infrared
8.3. Radar
8.4. GPS
8.5. Others
9. Smart weapon Market, By Geography
9.1. Europe
9.1.1. Germany
9.1.2. France
9.1.3. Italy
9.1.4. Spain
9.1.5. Russia
9.1.6. U.K.
9.1.7. Rest of Europe
9.2. Asia Pacific
9.2.1. China
9.2.2. India
9.2.3. Japan
9.2.4. South Korea
9.2.5. Rest of Asia-Pacific
9.3. North America
9.3.1. U.S.
9.3.2. Canada
9.3.3. Mexico
9.4. Rest of the World (RoW)
9.4.1. Brazil
9.4.2. Rest of RoW
10. Smart weapon Market – Entropy
10.1. Expansion
10.2. Technological Developments
10.3. Merger & Acquisitions, and Joint Ventures
10.4. Supply- Contract
11. Company Profiles (Overview, Financials, SWOT Analysis, Developments, Product Portfolio)
11.1. Lockheed Martin Corporation
11.2. Raytheon Company
11.3. MBDA, Inc.
11.4. General Dynamics Corporation
11.5. Orbital ATK
11.6. BAE Systems, PLC.
11.7. The Boeing Company
11.8. L-3 Communications Holdings, Inc.
11.9. Thales Group
11.10. Textron Inc.
11.11. Rheinmetall Ag
*More than 10 Companies are profiled in this Research Report*
"*Financials would be provided on a best efforts basis for private companies"
12. Appendix
12.1. Abbreviations
12.2. Sources
12.3. Research Methodology
12.4. Bibliography
12.5. Compilation of Expert Insights
12.6. Disclaimer
List of Tables:
Table 1: Smart Weapon Market Overview 2023-2030
Table 2: Smart Weapon Market Leader Analysis 2023-2030 (US$)
Table 3: Smart Weapon Market Product Analysis 2023-2030 (US$)
Table 4: Smart Weapon Market End User Analysis 2023-2030 (US$)
Table 5: Smart Weapon Market Patent Analysis 2013-2023* (US$)
Table 6: Smart Weapon Market Financial Analysis 2023-2030 (US$)
Table 7: Smart Weapon Market Driver Analysis 2023-2030 (US$)
Table 8: Smart Weapon Market Challenges Analysis 2023-2030 (US$)
Table 9: Smart Weapon Market Constraint Analysis 2023-2030 (US$)
Table 10: Smart Weapon Market Supplier Bargaining Power Analysis 2023-2030 (US$)
Table 11: Smart Weapon Market Buyer Bargaining Power Analysis 2023-2030 (US$)
Table 12: Smart Weapon Market Threat of Substitutes Analysis 2023-2030 (US$)
Table 13: Smart Weapon Market Threat of New Entrants Analysis 2023-2030 (US$)
Table 14: Smart Weapon Market Degree of Competition Analysis 2023-2030 (US$)
Table 15: Smart Weapon Market Value Chain Analysis 2023-2030 (US$)
Table 16: Smart Weapon Market Pricing Analysis 2023-2030 (US$)
Table 17: Smart Weapon Market Opportunities Analysis 2023-2030 (US$)
Table 18: Smart Weapon Market Product Life Cycle Analysis 2023-2030 (US$)
Table 19: Smart Weapon Market Supplier Analysis 2023-2030 (US$)
Table 20: Smart Weapon Market Distributor Analysis 2023-2030 (US$)
Table 21: Smart Weapon Market Trend Analysis 2023-2030 (US$)
Table 22: Smart Weapon Market Size 2023 (US$)
Table 23: Smart Weapon Market Forecast Analysis 2023-2030 (US$)
Table 24: Smart Weapon Market Sales Forecast Analysis 2023-2030 (Units)
Table 25: Smart Weapon Market, Revenue & Volume,By Product Type, 2023-2030 ($)
Table 26: Smart Weapon MarketBy Product Type, Revenue & Volume,By Missiles, 2023-2030 ($)
Table 27: Smart Weapon MarketBy Product Type, Revenue & Volume,By Munitions, 2023-2030 ($)
Table 28: Smart Weapon MarketBy Product Type, Revenue & Volume,By Guided Projectile, 2023-2030 ($)
Table 29: Smart Weapon MarketBy Product Type, Revenue & Volume,By Guided Rocket, 2023-2030 ($)
Table 30: Smart Weapon MarketBy Product Type, Revenue & Volume,By Guided Firearms, 2023-2030 ($)
Table 31: Smart Weapon Market, Revenue & Volume,By Technology, 2023-2030 ($)
Table 32: Smart Weapon MarketBy Technology, Revenue & Volume,By Laser, 2023-2030 ($)
Table 33: Smart Weapon MarketBy Technology, Revenue & Volume,By Infrared, 2023-2030 ($)
Table 34: Smart Weapon MarketBy Technology, Revenue & Volume,By Radar, 2023-2030 ($)
Table 35: Smart Weapon MarketBy Technology, Revenue & Volume,By GPS, 2023-2030 ($)
Table 36: Smart Weapon Market, Revenue & Volume,By Platform, 2023-2030 ($)
Table 37: Smart Weapon MarketBy Platform, Revenue & Volume,By Air, 2023-2030 ($)
Table 38: Smart Weapon MarketBy Platform, Revenue & Volume,By Land, 2023-2030 ($)
Table 39: Smart Weapon MarketBy Platform, Revenue & Volume,By Naval, 2023-2030 ($)
Table 40: North America Smart Weapon Market, Revenue & Volume,By Product Type, 2023-2030 ($)
Table 41: North America Smart Weapon Market, Revenue & Volume,By Technology, 2023-2030 ($)
Table 42: North America Smart Weapon Market, Revenue & Volume,By Platform, 2023-2030 ($)
Table 43: South america Smart Weapon Market, Revenue & Volume,By Product Type, 2023-2030 ($)
Table 44: South america Smart Weapon Market, Revenue & Volume,By Technology, 2023-2030 ($)
Table 45: South america Smart Weapon Market, Revenue & Volume,By Platform, 2023-2030 ($)
Table 46: Europe Smart Weapon Market, Revenue & Volume,By Product Type, 2023-2030 ($)
Table 47: Europe Smart Weapon Market, Revenue & Volume,By Technology, 2023-2030 ($)
Table 48: Europe Smart Weapon Market, Revenue & Volume,By Platform, 2023-2030 ($)
Table 49: APAC Smart Weapon Market, Revenue & Volume,By Product Type, 2023-2030 ($)
Table 50: APAC Smart Weapon Market, Revenue & Volume,By Technology, 2023-2030 ($)
Table 51: APAC Smart Weapon Market, Revenue & Volume,By Platform, 2023-2030 ($)
Table 52: Middle East & Africa Smart Weapon Market, Revenue & Volume,By Product Type, 2023-2030 ($)
Table 53: Middle East & Africa Smart Weapon Market, Revenue & Volume,By Technology, 2023-2030 ($)
Table 54: Middle East & Africa Smart Weapon Market, Revenue & Volume,By Platform, 2023-2030 ($)
Table 55: Russia Smart Weapon Market, Revenue & Volume,By Product Type, 2023-2030 ($)
Table 56: Russia Smart Weapon Market, Revenue & Volume,By Technology, 2023-2030 ($)
Table 57: Russia Smart Weapon Market, Revenue & Volume,By Platform, 2023-2030 ($)
Table 58: Israel Smart Weapon Market, Revenue & Volume,By Product Type, 2023-2030 ($)
Table 59: Israel Smart Weapon Market, Revenue & Volume,By Technology, 2023-2030 ($)
Table 60: Israel Smart Weapon Market, Revenue & Volume,By Platform, 2023-2030 ($)
Table 61: Top Companies 2023 (US$)Smart Weapon Market, Revenue & Volume
Table 62: Product Launch 2023-2030Smart Weapon Market, Revenue & Volume
Table 63: Mergers & Acquistions 2023-2030Smart Weapon Market, Revenue & Volume
List of Figures:
Figure 1: Overview of Smart Weapon Market 2023-2030
Figure 2: Market Share Analysis for Smart Weapon Market 2023 (US$)
Figure 3: Product Comparison in Smart Weapon Market 2023-2030 (US$)
Figure 4: End User Profile for Smart Weapon Market 2023-2030 (US$)
Figure 5: Patent Application and Grant in Smart Weapon Market 2013-2023* (US$)
Figure 6: Top 5 Companies Financial Analysis in Smart Weapon Market 2023-2030 (US$)
Figure 7: Market Entry Strategy in Smart Weapon Market 2023-2030
Figure 8: Ecosystem Analysis in Smart Weapon Market2023
Figure 9: Average Selling Price in Smart Weapon Market 2023-2030
Figure 10: Top Opportunites in Smart Weapon Market 2023-2030
Figure 11: Market Life Cycle Analysis in Smart Weapon Market
Figure 12: GlobalBy Product TypeSmart Weapon Market Revenue, 2023-2030 ($)
Figure 13: GlobalBy TechnologySmart Weapon Market Revenue, 2023-2030 ($)
Figure 14: GlobalBy PlatformSmart Weapon Market Revenue, 2023-2030 ($)
Figure 15: Global Smart Weapon Market - By Geography
Figure 16: Global Smart Weapon Market Value & Volume, By Geography, 2023-2030 ($)
Figure 17: Global Smart Weapon Market CAGR, By Geography, 2023-2030 (%)
Figure 18: North America Smart Weapon Market Value & Volume, 2023-2030 ($)
Figure 19: US Smart Weapon Market Value & Volume, 2023-2030 ($)
Figure 20: US GDP and Population, 2023-2030 ($)
Figure 21: US GDP – Composition of 2023, By Sector of Origin
Figure 22: US Export and Import Value & Volume, 2023-2030 ($)
Figure 23: Canada Smart Weapon Market Value & Volume, 2023-2030 ($)
Figure 24: Canada GDP and Population, 2023-2030 ($)
Figure 25: Canada GDP – Composition of 2023, By Sector of Origin
Figure 26: Canada Export and Import Value & Volume, 2023-2030 ($)
Figure 27: Mexico Smart Weapon Market Value & Volume, 2023-2030 ($)
Figure 28: Mexico GDP and Population, 2023-2030 ($)
Figure 29: Mexico GDP – Composition of 2023, By Sector of Origin
Figure 30: Mexico Export and Import Value & Volume, 2023-2030 ($)
Figure 31: South America Smart Weapon MarketSouth America 3D Printing Market Value & Volume, 2023-2030 ($)
Figure 32: Brazil Smart Weapon Market Value & Volume, 2023-2030 ($)
Figure 33: Brazil GDP and Population, 2023-2030 ($)
Figure 34: Brazil GDP – Composition of 2023, By Sector of Origin
Figure 35: Brazil Export and Import Value & Volume, 2023-2030 ($)
Figure 36: Venezuela Smart Weapon Market Value & Volume, 2023-2030 ($)
Figure 37: Venezuela GDP and Population, 2023-2030 ($)
Figure 38: Venezuela GDP – Composition of 2023, By Sector of Origin
Figure 39: Venezuela Export and Import Value & Volume, 2023-2030 ($)
Figure 40: Argentina Smart Weapon Market Value & Volume, 2023-2030 ($)
Figure 41: Argentina GDP and Population, 2023-2030 ($)
Figure 42: Argentina GDP – Composition of 2023, By Sector of Origin
Figure 43: Argentina Export and Import Value & Volume, 2023-2030 ($)
Figure 44: Ecuador Smart Weapon Market Value & Volume, 2023-2030 ($)
Figure 45: Ecuador GDP and Population, 2023-2030 ($)
Figure 46: Ecuador GDP – Composition of 2023, By Sector of Origin
Figure 47: Ecuador Export and Import Value & Volume, 2023-2030 ($)
Figure 48: Peru Smart Weapon Market Value & Volume, 2023-2030 ($)
Figure 49: Peru GDP and Population, 2023-2030 ($)
Figure 50: Peru GDP – Composition of 2023, By Sector of Origin
Figure 51: Peru Export and Import Value & Volume, 2023-2030 ($)
Figure 52: Colombia Smart Weapon Market Value & Volume, 2023-2030 ($)
Figure 53: Colombia GDP and Population, 2023-2030 ($)
Figure 54: Colombia GDP – Composition of 2023, By Sector of Origin
Figure 55: Colombia Export and Import Value & Volume, 2023-2030 ($)
Figure 56: Costa Rica Smart Weapon MarketCosta Rica 3D Printing Market Value & Volume, 2023-2030 ($)
Figure 57: Costa Rica GDP and Population, 2023-2030 ($)
Figure 58: Costa Rica GDP – Composition of 2023, By Sector of Origin
Figure 59: Costa Rica Export and Import Value & Volume, 2023-2030 ($)
Figure 60: Europe Smart Weapon Market Value & Volume, 2023-2030 ($)
Figure 61: U.K Smart Weapon Market Value & Volume, 2023-2030 ($)
Figure 62: U.K GDP and Population, 2023-2030 ($)
Figure 63: U.K GDP – Composition of 2023, By Sector of Origin
Figure 64: U.K Export and Import Value & Volume, 2023-2030 ($)
Figure 65: Germany Smart Weapon Market Value & Volume, 2023-2030 ($)
Figure 66: Germany GDP and Population, 2023-2030 ($)
Figure 67: Germany GDP – Composition of 2023, By Sector of Origin
Figure 68: Germany Export and Import Value & Volume, 2023-2030 ($)
Figure 69: Italy Smart Weapon Market Value & Volume, 2023-2030 ($)
Figure 70: Italy GDP and Population, 2023-2030 ($)
Figure 71: Italy GDP – Composition of 2023, By Sector of Origin
Figure 72: Italy Export and Import Value & Volume, 2023-2030 ($)
Figure 73: France Smart Weapon Market Value & Volume, 2023-2030 ($)
Figure 74: France GDP and Population, 2023-2030 ($)
Figure 75: France GDP – Composition of 2023, By Sector of Origin
Figure 76: France Export and Import Value & Volume, 2023-2030 ($)
Figure 77: Netherlands Smart Weapon Market Value & Volume, 2023-2030 ($)
Figure 78: Netherlands GDP and Population, 2023-2030 ($)
Figure 79: Netherlands GDP – Composition of 2023, By Sector of Origin
Figure 80: Netherlands Export and Import Value & Volume, 2023-2030 ($)
Figure 81: Belgium Smart Weapon Market Value & Volume, 2023-2030 ($)
Figure 82: Belgium GDP and Population, 2023-2030 ($)
Figure 83: Belgium GDP – Composition of 2023, By Sector of Origin
Figure 84: Belgium Export and Import Value & Volume, 2023-2030 ($)
Figure 85: Spain Smart Weapon Market Value & Volume, 2023-2030 ($)
Figure 86: Spain GDP and Population, 2023-2030 ($)
Figure 87: Spain GDP – Composition of 2023, By Sector of Origin
Figure 88: Spain Export and Import Value & Volume, 2023-2030 ($)
Figure 89: Denmark Smart Weapon Market Value & Volume, 2023-2030 ($)
Figure 90: Denmark GDP and Population, 2023-2030 ($)
Figure 91: Denmark GDP – Composition of 2023, By Sector of Origin
Figure 92: Denmark Export and Import Value & Volume, 2023-2030 ($)
Figure 93: APAC Smart Weapon Market Value & Volume, 2023-2030 ($)
Figure 94: China Smart Weapon MarketValue & Volume, 2023-2030
Figure 95: China GDP and Population, 2023-2030 ($)
Figure 96: China GDP – Composition of 2023, By Sector of Origin
Figure 97: China Export and Import Value & Volume, 2023-2030 ($)Smart Weapon MarketChina Export and Import Value & Volume, 2023-2030 ($)
Figure 98: Australia Smart Weapon Market Value & Volume, 2023-2030 ($)
Figure 99: Australia GDP and Population, 2023-2030 ($)
Figure 100: Australia GDP – Composition of 2023, By Sector of Origin
Figure 101: Australia Export and Import Value & Volume, 2023-2030 ($)
Figure 102: South Korea Smart Weapon Market Value & Volume, 2023-2030 ($)
Figure 103: South Korea GDP and Population, 2023-2030 ($)
Figure 104: South Korea GDP – Composition of 2023, By Sector of Origin
Figure 105: South Korea Export and Import Value & Volume, 2023-2030 ($)
Figure 106: India Smart Weapon Market Value & Volume, 2023-2030 ($)
Figure 107: India GDP and Population, 2023-2030 ($)
Figure 108: India GDP – Composition of 2023, By Sector of Origin
Figure 109: India Export and Import Value & Volume, 2023-2030 ($)
Figure 110: Taiwan Smart Weapon MarketTaiwan 3D Printing Market Value & Volume, 2023-2030 ($)
Figure 111: Taiwan GDP and Population, 2023-2030 ($)
Figure 112: Taiwan GDP – Composition of 2023, By Sector of Origin
Figure 113: Taiwan Export and Import Value & Volume, 2023-2030 ($)
Figure 114: Malaysia Smart Weapon MarketMalaysia 3D Printing Market Value & Volume, 2023-2030 ($)
Figure 115: Malaysia GDP and Population, 2023-2030 ($)
Figure 116: Malaysia GDP – Composition of 2023, By Sector of Origin
Figure 117: Malaysia Export and Import Value & Volume, 2023-2030 ($)
Figure 118: Hong Kong Smart Weapon MarketHong Kong 3D Printing Market Value & Volume, 2023-2030 ($)
Figure 119: Hong Kong GDP and Population, 2023-2030 ($)
Figure 120: Hong Kong GDP – Composition of 2023, By Sector of Origin
Figure 121: Hong Kong Export and Import Value & Volume, 2023-2030 ($)
Figure 122: Middle East & Africa Smart Weapon MarketMiddle East & Africa 3D Printing Market Value & Volume, 2023-2030 ($)
Figure 123: Russia Smart Weapon MarketRussia 3D Printing Market Value & Volume, 2023-2030 ($)
Figure 124: Russia GDP and Population, 2023-2030 ($)
Figure 125: Russia GDP – Composition of 2023, By Sector of Origin
Figure 126: Russia Export and Import Value & Volume, 2023-2030 ($)
Figure 127: Israel Smart Weapon Market Value & Volume, 2023-2030 ($)
Figure 128: Israel GDP and Population, 2023-2030 ($)
Figure 129: Israel GDP – Composition of 2023, By Sector of Origin
Figure 130: Israel Export and Import Value & Volume, 2023-2030 ($)
Figure 131: Entropy Share, By Strategies, 2023-2030* (%)Smart Weapon Market
Figure 132: Developments, 2023-2030*Smart Weapon Market
Figure 133: Company 1 Smart Weapon Market Net Revenue, By Years, 2023-2030* ($)
Figure 134: Company 1 Smart Weapon Market Net Revenue Share, By Business segments, 2023 (%)
Figure 135: Company 1 Smart Weapon Market Net Sales Share, By Geography, 2023 (%)
Figure 136: Company 2 Smart Weapon Market Net Revenue, By Years, 2023-2030* ($)
Figure 137: Company 2 Smart Weapon Market Net Revenue Share, By Business segments, 2023 (%)
Figure 138: Company 2 Smart Weapon Market Net Sales Share, By Geography, 2023 (%)
Figure 139: Company 3Smart Weapon Market Net Revenue, By Years, 2023-2030* ($)
Figure 140: Company 3Smart Weapon Market Net Revenue Share, By Business segments, 2023 (%)
Figure 141: Company 3Smart Weapon Market Net Sales Share, By Geography, 2023 (%)
Figure 142: Company 4 Smart Weapon Market Net Revenue, By Years, 2023-2030* ($)
Figure 143: Company 4 Smart Weapon Market Net Revenue Share, By Business segments, 2023 (%)
Figure 144: Company 4 Smart Weapon Market Net Sales Share, By Geography, 2023 (%)
Figure 145: Company 5 Smart Weapon Market Net Revenue, By Years, 2023-2030* ($)
Figure 146: Company 5 Smart Weapon Market Net Revenue Share, By Business segments, 2023 (%)
Figure 147: Company 5 Smart Weapon Market Net Sales Share, By Geography, 2023 (%)
Figure 148: Company 6 Smart Weapon Market Net Revenue, By Years, 2023-2030* ($)
Figure 149: Company 6 Smart Weapon Market Net Revenue Share, By Business segments, 2023 (%)
Figure 150: Company 6 Smart Weapon Market Net Sales Share, By Geography, 2023 (%)
Figure 151: Company 7 Smart Weapon Market Net Revenue, By Years, 2023-2030* ($)
Figure 152: Company 7 Smart Weapon Market Net Revenue Share, By Business segments, 2023 (%)
Figure 153: Company 7 Smart Weapon Market Net Sales Share, By Geography, 2023 (%)
Figure 154: Company 8 Smart Weapon Market Net Revenue, By Years, 2023-2030* ($)
Figure 155: Company 8 Smart Weapon Market Net Revenue Share, By Business segments, 2023 (%)
Figure 156: Company 8 Smart Weapon Market Net Sales Share, By Geography, 2023 (%)
Figure 157: Company 9 Smart Weapon Market Net Revenue, By Years, 2023-2030* ($)
Figure 158: Company 9 Smart Weapon Market Net Revenue Share, By Business segments, 2023 (%)
Figure 159: Company 9 Smart Weapon Market Net Sales Share, By Geography, 2023 (%)
Figure 160: Company 10 Smart Weapon Market Net Revenue, By Years, 2023-2030* ($)
Figure 161: Company 10 Smart Weapon Market Net Revenue Share, By Business segments, 2023 (%)
Figure 162: Company 10 Smart Weapon Market Net Sales Share, By Geography, 2023 (%)
Figure 163: Company 11 Smart Weapon Market Net Revenue, By Years, 2023-2030* ($)
Figure 164: Company 11 Smart Weapon Market Net Revenue Share, By Business segments, 2023 (%)
Figure 165: Company 11 Smart Weapon Market Net Sales Share, By Geography, 2023 (%)
Figure 166: Company 12 Smart Weapon Market Net Revenue, By Years, 2023-2030* ($)
Figure 167: Company 12 Smart Weapon Market Net Revenue Share, By Business segments, 2023 (%)
Figure 168: Company 12 Smart Weapon Market Net Sales Share, By Geography, 2023 (%)
Figure 169: Company 13Smart Weapon Market Net Revenue, By Years, 2023-2030* ($)
Figure 170: Company 13Smart Weapon Market Net Revenue Share, By Business segments, 2023 (%)
Figure 171: Company 13Smart Weapon Market Net Sales Share, By Geography, 2023 (%)
Figure 172: Company 14 Smart Weapon Market Net Revenue, By Years, 2023-2030* ($)
Figure 173: Company 14 Smart Weapon Market Net Revenue Share, By Business segments, 2023 (%)
Figure 174: Company 14 Smart Weapon Market Net Sales Share, By Geography, 2023 (%)
Figure 175: Company 15 Smart Weapon Market Net Revenue, By Years, 2023-2030* ($)
Figure 176: Company 15 Smart Weapon Market Net Revenue Share, By Business segments, 2023 (%)
Figure 177: Company 15 Smart Weapon Market Net Sales Share, By Geography, 2023 (%)