 Email
Email Print
Print


Augmented Reality & Virtual Reality Component Market - Forecast(2025 - 2031)
Geographically, North America dominated the augmented & virtual reality component market driven by higher penetration, demand, consumption and popularity of AR & VR technology in day to day life of its residents. North America was followed by Europe and Asia-Pacific as second and third largest market for the augmented & virtual reality market by component market. Asia Pacific is projected to have the fastest growth, owing to rapidly growing popularity of AR & VR technology, and a growing technological user base in nations such as Japan, China, and India located in this region.
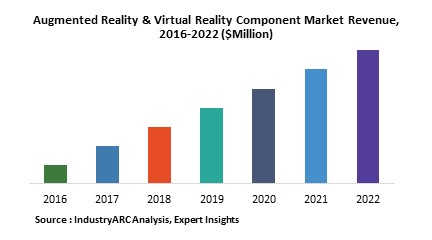
This report identifies the augmented & virtual reality component market size for the years 2014-2016, and forecast of the same till the year 2022. It also highlights the market drivers, restraints, growth indicators, challenges, and other key aspects with respect to augmented & virtual reality component market.
This report segments the augmented & virtual reality component market on the basis of component, application and regional market as follows:
- AR & VR Component market research report is classified on the basis of component. Some of the major components covered in this report are as follows: Hardware Component (3D Camera Sensors (Accelerometer), Gyroscope, Magnetometer, Global Positioning Systems, Proximity Sensor) Semiconductor Component (Controller/Processor, Integrated Circuits), Displays) Software Component (Software Development Kits, Cloud-Based Services).
- AR & VR Component market research report is classified on the basis of application. Some of the major applications covered in this report are as follows: Augmented Reality Applications(Aerospace and Defense, Consumer, Gaming, Sports and Entertainment, Medical, Commercial, Automotive, Others), Virtual Reality Applications (Consumer, Gaming, Sports & Entertainment, Commercial, Aerospace & Defense, Medical, Industrial, Others).
- This report has been further segmented into major regions, which includes detailed analysis of each region such as: North America, Europe, Asia-Pacific (APAC), and Rest of the World (RoW) covering all the major country level markets in each of the region.
Sample companies profiled in this report are:
- Google Inc.
- Microsoft Corporation
- Vuzix Corporation
- Samsung Electronics Co., Ltd.
- Qaulcomm Inc.,
- 10+.
Key Market Players:
The Top 5 companies in the Augmented Reality & Virtual Reality Component Market are:
- Google Inc.
- Microsoft Corporation
- Vuzix Corporation
- Samsung Electronics Co., Ltd.
- Qualcomm Inc.
For more Electronics Market reports, please click here
List of Tables:
Table 1: Augmented Reality & Virtual Reality Component Market Overview 2023-2030
Table 2: Augmented Reality & Virtual Reality Component Market Leader Analysis 2023-2030 (US$)
Table 3: Augmented Reality & Virtual Reality Component Market Product Analysis 2023-2030 (US$)
Table 4: Augmented Reality & Virtual Reality Component Market End User Analysis 2023-2030 (US$)
Table 5: Augmented Reality & Virtual Reality Component Market Patent Analysis 2013-2023* (US$)
Table 6: Augmented Reality & Virtual Reality Component Market Financial Analysis 2023-2030 (US$)
Table 7: Augmented Reality & Virtual Reality Component Market Driver Analysis 2023-2030 (US$)
Table 8: Augmented Reality & Virtual Reality Component Market Challenges Analysis 2023-2030 (US$)
Table 9: Augmented Reality & Virtual Reality Component Market Constraint Analysis 2023-2030 (US$)
Table 10: Augmented Reality & Virtual Reality Component Market Supplier Bargaining Power Analysis 2023-2030 (US$)
Table 11: Augmented Reality & Virtual Reality Component Market Buyer Bargaining Power Analysis 2023-2030 (US$)
Table 12: Augmented Reality & Virtual Reality Component Market Threat of Substitutes Analysis 2023-2030 (US$)
Table 13: Augmented Reality & Virtual Reality Component Market Threat of New Entrants Analysis 2023-2030 (US$)
Table 14: Augmented Reality & Virtual Reality Component Market Degree of Competition Analysis 2023-2030 (US$)
Table 15: Augmented Reality & Virtual Reality Component Market Value Chain Analysis 2023-2030 (US$)
Table 16: Augmented Reality & Virtual Reality Component Market Pricing Analysis 2023-2030 (US$)
Table 17: Augmented Reality & Virtual Reality Component Market Opportunities Analysis 2023-2030 (US$)
Table 18: Augmented Reality & Virtual Reality Component Market Product Life Cycle Analysis 2023-2030 (US$)
Table 19: Augmented Reality & Virtual Reality Component Market Supplier Analysis 2023-2030 (US$)
Table 20: Augmented Reality & Virtual Reality Component Market Distributor Analysis 2023-2030 (US$)
Table 21: Augmented Reality & Virtual Reality Component Market Trend Analysis 2023-2030 (US$)
Table 22: Augmented Reality & Virtual Reality Component Market Size 2023 (US$)
Table 23: Augmented Reality & Virtual Reality Component Market Forecast Analysis 2023-2030 (US$)
Table 24: Augmented Reality & Virtual Reality Component Market Sales Forecast Analysis 2023-2030 (Units)
Table 25: Augmented Reality & Virtual Reality Component Market, Revenue & Volume, By Component, 2023-2030 ($)
Table 26: Augmented Reality & Virtual Reality Component Market By Component, Revenue & Volume, By Augmented Reality and Virtual Reality Hardware Component, 2023-2030 ($)
Table 27: Augmented Reality & Virtual Reality Component Market By Component, Revenue & Volume, By Augmented Reality and Virtual Reality Software Component, 2023-2030 ($)
Table 28: Augmented Reality & Virtual Reality Component Market, Revenue & Volume, By Application, 2023-2030 ($)
Table 29: Augmented Reality & Virtual Reality Component Market By Application, Revenue & Volume, By Augmented Reality Applications, 2023-2030 ($)
Table 30: Augmented Reality & Virtual Reality Component Market By Application, Revenue & Volume, By Virtual Reality Applications, 2023-2030 ($)
Table 31: North America Augmented Reality & Virtual Reality Component Market, Revenue & Volume, By Component, 2023-2030 ($)
Table 32: North America Augmented Reality & Virtual Reality Component Market, Revenue & Volume, By Application, 2023-2030 ($)
Table 33: South america Augmented Reality & Virtual Reality Component Market, Revenue & Volume, By Component, 2023-2030 ($)
Table 34: South america Augmented Reality & Virtual Reality Component Market, Revenue & Volume, By Application, 2023-2030 ($)
Table 35: Europe Augmented Reality & Virtual Reality Component Market, Revenue & Volume, By Component, 2023-2030 ($)
Table 36: Europe Augmented Reality & Virtual Reality Component Market, Revenue & Volume, By Application, 2023-2030 ($)
Table 37: APAC Augmented Reality & Virtual Reality Component Market, Revenue & Volume, By Component, 2023-2030 ($)
Table 38: APAC Augmented Reality & Virtual Reality Component Market, Revenue & Volume, By Application, 2023-2030 ($)
Table 39: Middle East & Africa Augmented Reality & Virtual Reality Component Market, Revenue & Volume, By Component, 2023-2030 ($)
Table 40: Middle East & Africa Augmented Reality & Virtual Reality Component Market, Revenue & Volume, By Application, 2023-2030 ($)
Table 41: Russia Augmented Reality & Virtual Reality Component Market, Revenue & Volume, By Component, 2023-2030 ($)
Table 42: Russia Augmented Reality & Virtual Reality Component Market, Revenue & Volume, By Application, 2023-2030 ($)
Table 43: Israel Augmented Reality & Virtual Reality Component Market, Revenue & Volume, By Component, 2023-2030 ($)
Table 44: Israel Augmented Reality & Virtual Reality Component Market, Revenue & Volume, By Application, 2023-2030 ($)
Table 45: Top Companies 2023 (US$) Augmented Reality & Virtual Reality Component Market, Revenue & Volume
Table 46: Product Launch 2023-2030 Augmented Reality & Virtual Reality Component Market, Revenue & Volume
Table 47: Mergers & Acquistions 2023-2030 Augmented Reality & Virtual Reality Component Market, Revenue & Volume
List of Figures:
Figure 1: Overview of Augmented Reality & Virtual Reality Component Market 2023-2030
Figure 2: Market Share Analysis for Augmented Reality & Virtual Reality Component Market 2023 (US$)
Figure 3: Product Comparison in Augmented Reality & Virtual Reality Component Market 2023-2030 (US$)
Figure 4: End User Profile for Augmented Reality & Virtual Reality Component Market 2023-2030 (US$)
Figure 5: Patent Application and Grant in Augmented Reality & Virtual Reality Component Market 2013-2023* (US$)
Figure 6: Top 5 Companies Financial Analysis in Augmented Reality & Virtual Reality Component Market 2023-2030 (US$)
Figure 7: Market Entry Strategy in Augmented Reality & Virtual Reality Component Market 2023-2030
Figure 8: Ecosystem Analysis in Augmented Reality & Virtual Reality Component Market 2023
Figure 9: Average Selling Price in Augmented Reality & Virtual Reality Component Market 2023-2030
Figure 10: Top Opportunites in Augmented Reality & Virtual Reality Component Market 2023-2030
Figure 11: Market Life Cycle Analysis in Augmented Reality & Virtual Reality Component Market
Figure 12: GlobalBy Component Augmented Reality & Virtual Reality Component Market Revenue, 2023-2030 ($)
Figure 13: GlobalBy Application Augmented Reality & Virtual Reality Component Market Revenue, 2023-2030 ($)
Figure 14: Global Augmented Reality & Virtual Reality Component Market - By Geography
Figure 15: Global Augmented Reality & Virtual Reality Component Market Value & Volume, By Geography, 2023-2030 ($)
Figure 16: Global Augmented Reality & Virtual Reality Component Market CAGR, By Geography, 2023-2030 (%)
Figure 17: North America Augmented Reality & Virtual Reality Component Market Value & Volume, 2023-2030 ($)
Figure 18: US Augmented Reality & Virtual Reality Component Market Value & Volume, 2023-2030 ($)
Figure 19: US GDP and Population, 2023-2030 ($)
Figure 20: US GDP – Composition of 2023, By Sector of Origin
Figure 21: US Export and Import Value & Volume, 2023-2030 ($)
Figure 22: Canada Augmented Reality & Virtual Reality Component Market Value & Volume, 2023-2030 ($)
Figure 23: Canada GDP and Population, 2023-2030 ($)
Figure 24: Canada GDP – Composition of 2023, By Sector of Origin
Figure 25: Canada Export and Import Value & Volume, 2023-2030 ($)
Figure 26: Mexico Augmented Reality & Virtual Reality Component Market Value & Volume, 2023-2030 ($)
Figure 27: Mexico GDP and Population, 2023-2030 ($)
Figure 28: Mexico GDP – Composition of 2023, By Sector of Origin
Figure 29: Mexico Export and Import Value & Volume, 2023-2030 ($)
Figure 30: South America Augmented Reality & Virtual Reality Component Market Value & Volume, 2023-2030 ($)
Figure 31: Brazil Augmented Reality & Virtual Reality Component Market Value & Volume, 2023-2030 ($)
Figure 32: Brazil GDP and Population, 2023-2030 ($)
Figure 33: Brazil GDP – Composition of 2023, By Sector of Origin
Figure 34: Brazil Export and Import Value & Volume, 2023-2030 ($)
Figure 35: Venezuela Augmented Reality & Virtual Reality Component Market Value & Volume, 2023-2030 ($)
Figure 36: Venezuela GDP and Population, 2023-2030 ($)
Figure 37: Venezuela GDP – Composition of 2023, By Sector of Origin
Figure 38: Venezuela Export and Import Value & Volume, 2023-2030 ($)
Figure 39: Argentina Augmented Reality & Virtual Reality Component Market Value & Volume, 2023-2030 ($)
Figure 40: Argentina GDP and Population, 2023-2030 ($)
Figure 41: Argentina GDP – Composition of 2023, By Sector of Origin
Figure 42: Argentina Export and Import Value & Volume, 2023-2030 ($)
Figure 43: Ecuador Augmented Reality & Virtual Reality Component Market Value & Volume, 2023-2030 ($)
Figure 44: Ecuador GDP and Population, 2023-2030 ($)
Figure 45: Ecuador GDP – Composition of 2023, By Sector of Origin
Figure 46: Ecuador Export and Import Value & Volume, 2023-2030 ($)
Figure 47: Peru Augmented Reality & Virtual Reality Component Market Value & Volume, 2023-2030 ($)
Figure 48: Peru GDP and Population, 2023-2030 ($)
Figure 49: Peru GDP – Composition of 2023, By Sector of Origin
Figure 50: Peru Export and Import Value & Volume, 2023-2030 ($)
Figure 51: Colombia Augmented Reality & Virtual Reality Component Market Value & Volume, 2023-2030 ($)
Figure 52: Colombia GDP and Population, 2023-2030 ($)
Figure 53: Colombia GDP – Composition of 2023, By Sector of Origin
Figure 54: Colombia Export and Import Value & Volume, 2023-2030 ($)
Figure 55: Costa Rica Augmented Reality & Virtual Reality Component Market Value & Volume, 2023-2030 ($)
Figure 56: Costa Rica GDP and Population, 2023-2030 ($)
Figure 57: Costa Rica GDP – Composition of 2023, By Sector of Origin
Figure 58: Costa Rica Export and Import Value & Volume, 2023-2030 ($)
Figure 59: Europe Augmented Reality & Virtual Reality Component Market Value & Volume, 2023-2030 ($)
Figure 60: U.K Augmented Reality & Virtual Reality Component Market Value & Volume, 2023-2030 ($)
Figure 61: U.K GDP and Population, 2023-2030 ($)
Figure 62: U.K GDP – Composition of 2023, By Sector of Origin
Figure 63: U.K Export and Import Value & Volume, 2023-2030 ($)
Figure 64: Germany Augmented Reality & Virtual Reality Component Market Value & Volume, 2023-2030 ($)
Figure 65: Germany GDP and Population, 2023-2030 ($)
Figure 66: Germany GDP – Composition of 2023, By Sector of Origin
Figure 67: Germany Export and Import Value & Volume, 2023-2030 ($)
Figure 68: Italy Augmented Reality & Virtual Reality Component Market Value & Volume, 2023-2030 ($)
Figure 69: Italy GDP and Population, 2023-2030 ($)
Figure 70: Italy GDP – Composition of 2023, By Sector of Origin
Figure 71: Italy Export and Import Value & Volume, 2023-2030 ($)
Figure 72: France Augmented Reality & Virtual Reality Component Market Value & Volume, 2023-2030 ($)
Figure 73: France GDP and Population, 2023-2030 ($)
Figure 74: France GDP – Composition of 2023, By Sector of Origin
Figure 75: France Export and Import Value & Volume, 2023-2030 ($)
Figure 76: Netherlands Augmented Reality & Virtual Reality Component Market Value & Volume, 2023-2030 ($)
Figure 77: Netherlands GDP and Population, 2023-2030 ($)
Figure 78: Netherlands GDP – Composition of 2023, By Sector of Origin
Figure 79: Netherlands Export and Import Value & Volume, 2023-2030 ($)
Figure 80: Belgium Augmented Reality & Virtual Reality Component Market Value & Volume, 2023-2030 ($)
Figure 81: Belgium GDP and Population, 2023-2030 ($)
Figure 82: Belgium GDP – Composition of 2023, By Sector of Origin
Figure 83: Belgium Export and Import Value & Volume, 2023-2030 ($)
Figure 84: Spain Augmented Reality & Virtual Reality Component Market Value & Volume, 2023-2030 ($)
Figure 85: Spain GDP and Population, 2023-2030 ($)
Figure 86: Spain GDP – Composition of 2023, By Sector of Origin
Figure 87: Spain Export and Import Value & Volume, 2023-2030 ($)
Figure 88: Denmark Augmented Reality & Virtual Reality Component Market Value & Volume, 2023-2030 ($)
Figure 89: Denmark GDP and Population, 2023-2030 ($)
Figure 90: Denmark GDP – Composition of 2023, By Sector of Origin
Figure 91: Denmark Export and Import Value & Volume, 2023-2030 ($)
Figure 92: APAC Augmented Reality & Virtual Reality Component Market Value & Volume, 2023-2030 ($)
Figure 93: China Augmented Reality & Virtual Reality Component Market Value & Volume, 2023-2030
Figure 94: China GDP and Population, 2023-2030 ($)
Figure 95: China GDP – Composition of 2023, By Sector of Origin
Figure 96: China Export and Import Value & Volume, 2023-2030 ($) Augmented Reality & Virtual Reality Component Market China Export and Import Value & Volume, 2023-2030 ($)
Figure 97: Australia Augmented Reality & Virtual Reality Component Market Value & Volume, 2023-2030 ($)
Figure 98: Australia GDP and Population, 2023-2030 ($)
Figure 99: Australia GDP – Composition of 2023, By Sector of Origin
Figure 100: Australia Export and Import Value & Volume, 2023-2030 ($)
Figure 101: South Korea Augmented Reality & Virtual Reality Component Market Value & Volume, 2023-2030 ($)
Figure 102: South Korea GDP and Population, 2023-2030 ($)
Figure 103: South Korea GDP – Composition of 2023, By Sector of Origin
Figure 104: South Korea Export and Import Value & Volume, 2023-2030 ($)
Figure 105: India Augmented Reality & Virtual Reality Component Market Value & Volume, 2023-2030 ($)
Figure 106: India GDP and Population, 2023-2030 ($)
Figure 107: India GDP – Composition of 2023, By Sector of Origin
Figure 108: India Export and Import Value & Volume, 2023-2030 ($)
Figure 109: Taiwan Augmented Reality & Virtual Reality Component Market Value & Volume, 2023-2030 ($)
Figure 110: Taiwan GDP and Population, 2023-2030 ($)
Figure 111: Taiwan GDP – Composition of 2023, By Sector of Origin
Figure 112: Taiwan Export and Import Value & Volume, 2023-2030 ($)
Figure 113: Malaysia Augmented Reality & Virtual Reality Component Market Value & Volume, 2023-2030 ($)
Figure 114: Malaysia GDP and Population, 2023-2030 ($)
Figure 115: Malaysia GDP – Composition of 2023, By Sector of Origin
Figure 116: Malaysia Export and Import Value & Volume, 2023-2030 ($)
Figure 117: Hong Kong Augmented Reality & Virtual Reality Component Market Value & Volume, 2023-2030 ($)
Figure 118: Hong Kong GDP and Population, 2023-2030 ($)
Figure 119: Hong Kong GDP – Composition of 2023, By Sector of Origin
Figure 120: Hong Kong Export and Import Value & Volume, 2023-2030 ($)
Figure 121: Middle East & Africa Augmented Reality & Virtual Reality Component Market Middle East & Africa 3D Printing Market Value & Volume, 2023-2030 ($)
Figure 122: Russia Augmented Reality & Virtual Reality Component Market Value & Volume, 2023-2030 ($)
Figure 123: Russia GDP and Population, 2023-2030 ($)
Figure 124: Russia GDP – Composition of 2023, By Sector of Origin
Figure 125: Russia Export and Import Value & Volume, 2023-2030 ($)
Figure 126: Israel Augmented Reality & Virtual Reality Component Market Value & Volume, 2023-2030 ($)
Figure 127: Israel GDP and Population, 2023-2030 ($)
Figure 128: Israel GDP – Composition of 2023, By Sector of Origin
Figure 129: Israel Export and Import Value & Volume, 2023-2030 ($)
Figure 130: Entropy Share, By Strategies, 2023-2030* (%) Augmented Reality & Virtual Reality Component Market
Figure 131: Developments, 2023-2030* Augmented Reality & Virtual Reality Component Market
Figure 132: Company 1 Augmented Reality & Virtual Reality Component Market Net Revenue, By Years, 2023-2030* ($)
Figure 133: Company 1 Augmented Reality & Virtual Reality Component Market Net Revenue Share, By Business segments, 2023 (%)
Figure 134: Company 1 Augmented Reality & Virtual Reality Component Market Net Sales Share, By Geography, 2023 (%)
Figure 135: Company 2 Augmented Reality & Virtual Reality Component Market Net Revenue, By Years, 2023-2030* ($)
Figure 136: Company 2 Augmented Reality & Virtual Reality Component Market Net Revenue Share, By Business segments, 2023 (%)
Figure 137: Company 2 Augmented Reality & Virtual Reality Component Market Net Sales Share, By Geography, 2023 (%)
Figure 138: Company 3 Augmented Reality & Virtual Reality Component Market Net Revenue, By Years, 2023-2030* ($)
Figure 139: Company 3 Augmented Reality & Virtual Reality Component Market Net Revenue Share, By Business segments, 2023 (%)
Figure 140: Company 3 Augmented Reality & Virtual Reality Component Market Net Sales Share, By Geography, 2023 (%)
Figure 141: Company 4 Augmented Reality & Virtual Reality Component Market Net Revenue, By Years, 2023-2030* ($)
Figure 142: Company 4 Augmented Reality & Virtual Reality Component Market Net Revenue Share, By Business segments, 2023 (%)
Figure 143: Company 4 Augmented Reality & Virtual Reality Component Market Net Sales Share, By Geography, 2023 (%)
Figure 144: Company 5 Augmented Reality & Virtual Reality Component Market Net Revenue, By Years, 2023-2030* ($)
Figure 145: Company 5 Augmented Reality & Virtual Reality Component Market Net Revenue Share, By Business segments, 2023 (%)
Figure 146: Company 5 Augmented Reality & Virtual Reality Component Market Net Sales Share, By Geography, 2023 (%)
Figure 147: Company 6 Augmented Reality & Virtual Reality Component Market Net Revenue, By Years, 2023-2030* ($)
Figure 148: Company 6 Augmented Reality & Virtual Reality Component Market Net Revenue Share, By Business segments, 2023 (%)
Figure 149: Company 6 Augmented Reality & Virtual Reality Component Market Net Sales Share, By Geography, 2023 (%)
Figure 150: Company 7 Augmented Reality & Virtual Reality Component Market Net Revenue, By Years, 2023-2030* ($)
Figure 151: Company 7 Augmented Reality & Virtual Reality Component Market Net Revenue Share, By Business segments, 2023 (%)
Figure 152: Company 7 Augmented Reality & Virtual Reality Component Market Net Sales Share, By Geography, 2023 (%)
Figure 153: Company 8 Augmented Reality & Virtual Reality Component Market Net Revenue, By Years, 2023-2030* ($)
Figure 154: Company 8 Augmented Reality & Virtual Reality Component Market Net Revenue Share, By Business segments, 2023 (%)
Figure 155: Company 8 Augmented Reality & Virtual Reality Component Market Net Sales Share, By Geography, 2023 (%)
Figure 156: Company 9 Augmented Reality & Virtual Reality Component Market Net Revenue, By Years, 2023-2030* ($)
Figure 157: Company 9 Augmented Reality & Virtual Reality Component Market Net Revenue Share, By Business segments, 2023 (%)
Figure 158: Company 9 Augmented Reality & Virtual Reality Component Market Net Sales Share, By Geography, 2023 (%)
Figure 159: Company 10 Augmented Reality & Virtual Reality Component Market Net Revenue, By Years, 2023-2030* ($)
Figure 160: Company 10 Augmented Reality & Virtual Reality Component Market Net Revenue Share, By Business segments, 2023 (%)
Figure 161: Company 10 Augmented Reality & Virtual Reality Component Market Net Sales Share, By Geography, 2023 (%)
Figure 162: Company 11 Augmented Reality & Virtual Reality Component Market Net Revenue, By Years, 2023-2030* ($)
Figure 163: Company 11 Augmented Reality & Virtual Reality Component Market Net Revenue Share, By Business segments, 2023 (%)
Figure 164: Company 11 Augmented Reality & Virtual Reality Component Market Net Sales Share, By Geography, 2023 (%)
Figure 165: Company 12 Augmented Reality & Virtual Reality Component Market Net Revenue, By Years, 2023-2030* ($)
Figure 166: Company 12 Augmented Reality & Virtual Reality Component Market Net Revenue Share, By Business segments, 2023 (%)
Figure 167: Company 12 Augmented Reality & Virtual Reality Component Market Net Sales Share, By Geography, 2023 (%)
Figure 168: Company 13 Augmented Reality & Virtual Reality Component Market Net Revenue, By Years, 2023-2030* ($)
Figure 169: Company 13 Augmented Reality & Virtual Reality Component Market Net Revenue Share, By Business segments, 2023 (%)
Figure 170: Company 13 Augmented Reality & Virtual Reality Component Market Net Sales Share, By Geography, 2023 (%)
Figure 171: Company 14 Augmented Reality & Virtual Reality Component Market Net Revenue, By Years, 2023-2030* ($)
Figure 172: Company 14 Augmented Reality & Virtual Reality Component Market Net Revenue Share, By Business segments, 2023 (%)
Figure 173: Company 14 Augmented Reality & Virtual Reality Component Market Net Sales Share, By Geography, 2023 (%)
Figure 174: Company 15 Augmented Reality & Virtual Reality Component Market Net Revenue, By Years, 2023-2030* ($)
Figure 175: Company 15 Augmented Reality & Virtual Reality Component Market Net Revenue Share, By Business segments, 2023 (%)
Figure 176: Company 15 Augmented Reality & Virtual Reality Component Market Net Sales Share, By Geography, 2023 (%)