Farm Equipment Market- By Type; By Phase ; By Application; By Geography - Forecast (2024-2030)

Report Code: AGR 0006 Report Format: PDF + Excel


Farm Equipment Market Overview: 
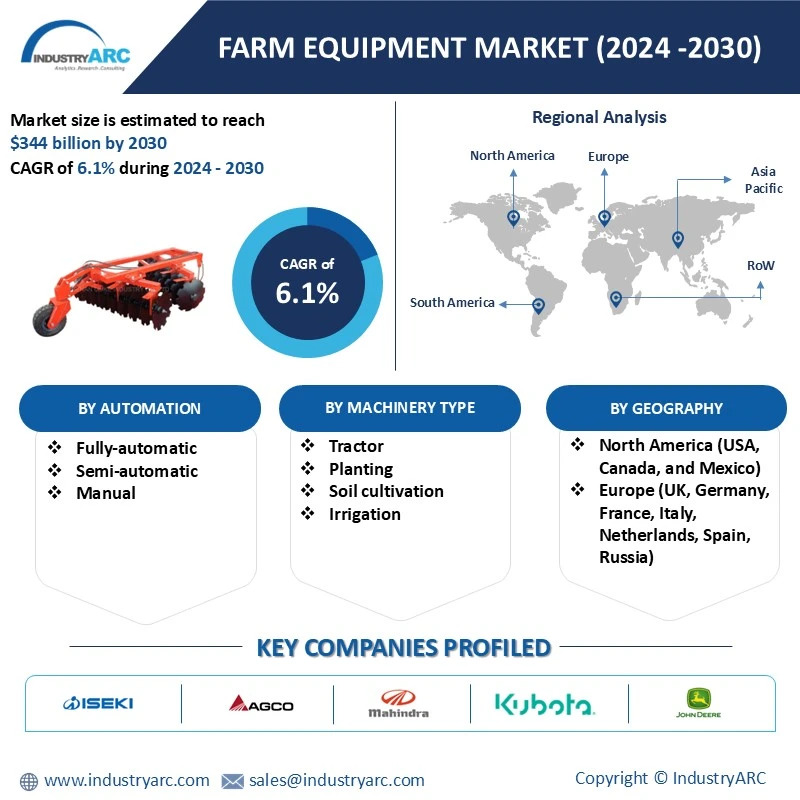
The global Farm Equipment market size is $227.5 billion as of 2023 and is forecast to grow at a CAGR of around 6.1% going through 2024-2030.  The Farm Equipment market is experiencing a transformative evolution driven by technological advancements, sustainability concerns, and a growing global population. As per the Food and Agriculture Organization of the United Nations, the global population will mark an astonishing 9.1 billion figure by 2050 witnessing a surge of 34%, and to feed these 9 billion mouths global agricultural expenses in developing countries would amount to $83 billion per annum.  To enhance efficiency and productivity in agriculture, the industry is witnessing a surge in the adoption of smart and precision farming technologies. Automation and data-driven solutions are becoming integral to modern farming practices, optimizing resource utilization and reducing environmental impact. To counterpart such unprecedented food production demand coupled with depleting arable land, efficient and mechanized agriculture is the main objective, and Farm Equipment is the tool to meet the objectives. Moreover, Sustainability is a key driver in shaping the future of Farm Equipment. There is a growing emphasis on developing eco-friendly equipment with reduced carbon footprints. Electric and hybrid tractors, powered by renewable energy sources, are becoming increasingly popular, aligning with global efforts to address climate change. Furthermore, the Farm Equipment market is witnessing a shift towards integrated farming systems. This involves combining various agricultural activities, such as crop cultivation and livestock management, to create synergies that enhance overall farm productivity, these are the factors propelling the Farm Equipment market growth in the forecast year.

Market Snapshot:

Farm Equipment Market

Report Coverage

The report: “Farm Equipment Market Forecast (2024-2030)”, by Industry ARC, covers an in-depth analysis of the following segments of the Active Wheelchair Market.

By Automation- Fully automatic, Semi-automatic, and Manual.

By Machinery Type- Tractor, Soil Cultivation, Planting, Irrigation, Fertilization, Harvesting, Hay Making, Loader and Agriculture Robots.

By Geography: North America (U.S, Canada, and Mexico), Europe (UK, Germany, France, Italy, Spain, Russia and Rest of Europe), Asia Pacific (China, India, Japan, South Korea, Australia & New Zealand, and Rest of Asia Pacific), South America (Brazil, Argentina, Rest of South America) and Rest of The World (Middle East, Africa).

Key Takeaways

  • In 2023, APAC's Farm Equipment sector dominated with 43% revenue share, driven by robust demand in India and China due to modernization needs, population growth, fostering innovation and economic growth.
  • The global Farm Equipment market has been witnessing steady growth due to the increasing demand for food and the need for efficient and modern farming practices.
  • Tractors and harvesters remain pivotal in the Farm Equipment market. Technological advancements, such as autonomous tractors and smart harvesters, are gaining traction. 
  • Government initiatives and subsidies for farmers to adopt modern machinery play a crucial role in the market. Policies promoting farm mechanization and modernization contribute to market growth.
  • Precision farming technologies, including GPS-guided tractors, drones, and sensors, continue to gain prominence. These technologies help farmers optimize crop yields, reduce waste, and enhance overall efficiency.

For more details on this report - Request for Sample

Farm Equipment Market Segment Analysis – By Automation:

Manual Segment dominated the Farm Equipment Market with a value share of approximately 43% in 2023. The manual segment of the Farm Equipment market plays a crucial role, driven by factors such as the utilization of natural forces, availability of cost-effective labor, and enhanced precision in tasks. In sub-continent countries like China and India, where manual labor is abundant, the demand for manual Farm Equipment is expected to surge. The reliance on natural forces and cost-efficient labor aligns with the economic landscape of these regions, fostering market growth. Moreover, the emphasis on precision in agricultural operations contributes to the increasing adoption of manual machinery, especially in tasks that require a delicate touch or intricate handling. As these factors converge, the manual segment is poised to witness substantial demand, reflecting the symbiosis between traditional practices, economic considerations, and the quest for operational accuracy in the Farm Equipment market.

Farm Equipment Market Segment Analysis – By Machinery Type:

Based on Machinery Type, the tractor segment has the largest revenue market share of 29% in 2023. This surge is primarily fuelled by the imperative need to address labor shortages and meet the escalating global food demand due to a burgeoning population. Tractors have emerged as a vital tool for enhancing agricultural productivity in response to these challenges. Moreover, in 2022, Europe registered approximately 215,000 tractors, with 59,300 falling below 37kW (50 hp) and 155,700 at 38kW and above. The European Farm Equipment Association (CEMA) estimates 165,200 of these to be agricultural tractors, while the remainder comprises diverse vehicles like quad bikes, side-by-sides, telehandlers, and other equipment. This data underscores a thriving market, fuelled by a dynamic agricultural landscape and a substantial demand for tractor production in the Machinery Market. Moreover, the emergence of electric tractors presents a promising growth opportunity for market participants. Electric tractors offer a range of benefits, including cost-effectiveness, eco-friendliness, and high efficiency. These attributes make electric tractors an attractive option for farmers looking to reduce their environmental impact while boosting productivity. As the demand for Farm Equipment continues to surge, the tractors segment is poised to maintain its dominance in the market. With ongoing advancements in technology and a focus on sustainable farming practices, tractors are expected to play a crucial role in meeting the growing global food requirements.

Farm Equipment Market Segment Analysis – By Geography

Based on Geography, the APAC Farm Equipment accounted for the dominant revenue share of 43% in 2023. The Farm Equipment Market in the Asia-Pacific (APAC) region is poised for significant growth, driven primarily by the substantial agricultural activities in countries like India and China. With a large portion of their population engaged in agriculture, there is a heightened demand for advanced machinery to enhance productivity and efficiency in the sector. China, with its vast agricultural landscape, also exhibits a robust demand for Farm Equipment. The rapid industrialization in the country has led to a shift in labor dynamics, making the deployment of mechanized solutions imperative for maintaining agricultural output. For instance, according to the National Bureau of Statistics of China In 2022, China's agriculture and related industries contributed 16.24% to the GDP, totaling $ 2724.91 billion an annual increase of 0.19 percentage points. In India, where agriculture plays a pivotal role in the economy, the demand for Farm Equipment has surged due to the increasing need to modernize farming practices. Factors such as rising population, shrinking arable land, and the government's focus on agricultural mechanization contribute to the heightened demand. The adoption of advanced technologies like precision farming and smart agriculture practices further propels the need for innovative machinery.  Also, Indian fiscal policy projects a 3.5% growth for the agriculture sector in FY 2022-23, indicating positive economic prospects for the country's farming industry, as per Invest India. Additionally, the increasing adoption of modern farming techniques and the shift towards larger-scale commercial agriculture contribute to the demand for technologically advanced machinery in the forecast year.

Farm Equipment Market Growth Drivers:

Government Support and Subsidies driving the market growth

Government support and subsidies have become pivotal factors propelling the growth of the Farm Equipment Market. Initiatives such as financial aid, tax incentives, and technology adoption programs incentivize farmers to invest in advanced equipment, enhancing productivity and sustainability. This support fosters a conducive environment for market expansion, driving demand for modern Farm Equipment as farmers seek to capitalize on these benefits to optimize their operations and meet the increasing global food demand. Some of the other factors indirectly but positively influencing the market are agriculture finance and agriculture insurance initiated by The World Bank to aid the financially fragile agriculture production sector participants. The World Bank Group is a leading financier of agriculture, In FY 2023, approved IBRD/IDA commitments for agriculture and related sectors reached $5.9 billion, with $3 billion dedicated to climate action within new agriculture and food projects, reinforcing sustainable development and resilience. Moreover, according to the Indian Directorate of Economics and Statistics, the Ministry of Agriculture's number of subsidized machines and equipment given to farmers rose from 1,378,755 in January 2022 to 1,388,314 by December 2022, indicating increased support for agriculture. Other prominent factors equipped with a tendency to support the agriculture machinery market for exponential growth are a rise in research and development by various economies sponsored by various organizations such as The World Bank Group, rise in disposable income of the urban population creating demand for higher quality and organic agricultural products, and reduction in global farmland, which require advanced Farm Equipment to meet copious loads of vigorous production.

Rising Agriculture Mechanization Rates in Developing Countries

The rising trend of agriculture mechanization in developing countries is significantly impacting the demand for Farm Equipment. Faced with challenges such as diminishing land availability, water scarcity, and a shrinking labor force, these nations are increasingly adopting mechanized solutions to enhance productivity and efficiency in agriculture. This shift is fuelling a robust demand for various Farm Equipment, including tractors, harvesters, irrigation systems, and precision agriculture tools. Farmers in developing countries are recognizing the need for modern technology to overcome traditional constraints and optimize resource utilization. The demand for tractors is surging as they become essential for plowing, planting, and cultivating large expanses of land swiftly. For instance, Sonalika International Tractors unveiled 5 new series, including an e-model, at the Global Partners Summit 200 in Gurugram, featuring compact designs and advanced emission control systems for global exports. With compact designs and advanced emission control systems, these innovations cater to rising agriculture mechanization rates in developing countries, driving increased demand in the market. Additionally, there is a growing interest in precision agriculture tools and irrigation systems, reflecting a desire for optimized resource management and sustainable farming practices. As these nations embrace mechanization, the Farm Equipment market is witnessing a substantial upswing, driven by the imperative to secure food production in the face of resource constraints.

Farm Equipment Market Challenges:

High Cost of Agriculture Machinery Limit the Market Expansion

The high cost of Farm Equipment stands as a formidable impediment to the growth of the agriculture machinery market. This cost factor encompasses the initial purchase price, maintenance expenses, and the overall financial burden on farmers. Small and medium-sized farmers, in particular, find it challenging to invest in modern, technologically advanced equipment due to their limited financial resources. Additionally, the evolving nature of agricultural technology necessitates constant upgrades, exacerbating the economic strain on farmers. High capital requirements for machinery contribute to a digital divide, limiting access to innovative tools that could enhance productivity and sustainability. Addressing this challenge requires concerted efforts from policymakers, industry stakeholders, and financial institutions to develop cost-effective solutions, subsidies, or financing options that can alleviate the financial burden on farmers, promoting the widespread adoption of modern Farm Equipment.

Farm Equipment Market Key Players Perspective:

Market Landscape

Technology launches, acquisitions, and R&D activities are key strategies adopted by players in the Farm Equipment market. Major players in the Farm Equipment Market are Deere & Company, Kubota Corporation, Mahindra and Mahindra Limited, AGCO Corporation., Iseki & Co. Ltd, Escorts Limited Source, Daedong Industrial Co. Ltd, JCB, Tractors and Farm Equipment Limited, Sonalika, among others

Recent Developments

  • In January 2023, John Deere commemorates its 25th anniversary in the industry by unveiling 7 new tractors and 3 implements in India, showcasing the latest Power and Technology 4.0 edition. The celebratory launch includes a special limited-edition tractor, the John Deere 5045 D Power Pro 4WD V3, alongside tailored solutions for specific crops, promising Indian farmers enhanced efficiency and productivity.
  • In August 2023, Mahindra and Mahindra unveiled 7 lightweight tractors under the OJA platform in Cape Town, South Africa, in partnership with Mitsubishi Mahindra Agriculture Machinery, Japan. Ranging from 20 hp to 40 hp, these models will soon be introduced in India, with larger utility tractors expected next year
  • In September 2022, AGCO Corporation introduced the latest Fendt 300 Vario tractors to North American farmers in early 2022, enhancing agricultural efficiency with advanced technology and performance.
     

For more Agriculture related reports, please click here

  
  1.    Farm Equipment Market - Overview
      1.1     Definitions and Scope
  2.    Farm Equipment Market - Executive Summary
      2.1    Key Trends by Automation
      2.2    Key Trends by Type of Material
      2.3    Key Trends by Type
      2.4    Key Trends by Geography
  3.    Farm Equipment Market - Comparative Analysis
      3.1    Company Benchmarking 
      3.2    Global Financial Analysis
      3.3    Market Share Analysis
      3.4    Patent Analysis
      3.5    Pricing Analysis
  4.    Farm Equipment Market - Start-up Companies Scenario
      4.1     Key Start-up Company Analysis by
            4.1.1    Investment
            4.1.2    Revenue
            4.1.3    Venture Capital and Funding Scenario
  5.    Farm Equipment Market – Market Entry Scenario Premium
      5.1    Regulatory Framework Overview
      5.2    New Business and Ease of Doing Business Index
      5.3    Case Studies of Successful Ventures
  6.    Farm Equipment Market - Forces
      6.1    Market Drivers
      6.2    Market Constraints/Challenges
      6.3    Porter’s Five Force Model
            6.3.1    Bargaining power of suppliers
            6.3.2    Bargaining powers of customers
            6.3.3    Threat of new entrants
            6.3.4    Rivalry among existing players
            6.3.5    Threat of substitutes 
  7.    Farm Equipment Market – Strategic Analysis
      7.1     Value Chain Analysis
      7.2     Opportunities Analysis
      7.3     Market Life Cycle
  8.    Farm Equipment Market – By Automation (Market Size -$Million/Billion)
      8.1    Fully-automatic
      8.2    Semi-automatic
      8.3     Manual 
  9.    Farm Equipment Market – By Type (Market Size -$Million / $Billion)
      9.1    Tractor
            9.1.1    Utility tractor
            9.1.2    Row crop tractor
            9.1.3    Orchard tractor
      9.2    Planting
            9.2.1     Seed drill
      9.3    Soil cultivation
            9.3.1    Cultivator
            9.3.2    Cultipacker
            9.3.3    Chisel plow
            9.3.4    Rotator
            9.3.5    Subsoiler
            9.3.6    Plough
            9.3.7    Roller
            9.3.8    Stone picker
            9.3.9    Others 
      9.4    Irrigation
            9.4.1    Drip irrigation
            9.4.2    Central pivot irrigation
            9.4.3    Sprinkler system
            9.4.4     Hydroponics
      9.5    Fertilization
            9.5.1    Fertilize drill
            9.5.2    Fertilizer spreader
                    9.5.2.1    Liquid manure spreader
                    9.5.2.2    Dry manure spreader
            9.5.3    Sprayer
            9.5.4    Biomass plant
            9.5.5    Others 
      9.6    Harvesting
            9.6.1    Grain cart
            9.6.2    Conveyor belt
            9.6.3    Cotton picker
            9.6.4    Farm truck
            9.6.5    Grain dryer
            9.6.6     Haulm topper
            9.6.7    Mower
            9.6.8    Rake
            9.6.9    Others
      9.7     Hay making
            9.7.1    Bale lifter
            9.7.2    Bale wrapper
            9.7.3    Baler
            9.7.4    Hay rake
            9.7.5     Hay tedder
            9.7.6    Hay Fork
            9.7.7    Others
      9.8    Loader
            9.8.1    Backhoe loader
            9.8.2    Skid steer loader
            9.8.3    Others
      9.9    Agricultural robots
      9.10    Others
  10.    Farm Equipment Market – by Geography (Market Size - $Million/$Billion)
      10.1    North America
            10.1.1    U.S.
            10.1.2    Canada
            10.1.3    Mexico
      10.2    Europe
            10.2.1     U.K.
            10.2.2     Germany
            10.2.3    France
            10.2.4    Italy
            10.2.5    Netherlands
            10.2.6    Spain
            10.2.7    Rest of Europe
      10.3    Asia-Pacific
            10.3.1    China
            10.3.2    Japan
            10.3.3    India
            10.3.4    South Korea
            10.3.5    Australia & New Zealand
            10.3.6    Rest of Asia-Pacific
      10.4    South America
            10.4.1    Brazil
            10.4.2    Argentina
            10.4.3    Chile
            10.4.4    Colombia
            10.4.5    Rest of South America
      10.5    Rest of The World
            10.5.1    Middle East
            10.5.2    Africa
  11.    Farm Equipment Market - Entropy
  12.    Farm Equipment Market – Industry/Segment Competition Landscape
      12.1    Market Share Analysis
            12.1.1    Global Market Share – Key Companies
            12.1.2    Market Share by Region – Key Companies
            12.1.3    Market Share by Countries – Key Companies
      12.2    Competition Matrix
      12.3    Best Practices for Companies
  13.    Farm Equipment Market – Key Company List by Country Premium
  14.    Farm Equipment Market - Company Analysis
      14.1    Deere & Company,
      14.2    Kubota Corporation
      14.3    Mahindra and Mahindra Limited
      14.4    AGCO Corporation.
      14.5    Iseki & Co. Ltd 
      14.6    Escorts Limited 
      14.7    Daedong Industrial Co. Ltd
      14.8    JCB
      14.9    Tractors and Farm Equipment Limited
      14.10    Sonalika
 
  * "Financials would be provided to private companies on best-efforts basis." *
  Connect with our experts to get customized reports that best suit your requirements. Our reports include global-level data, niche markets and competitive landscape.
   
List of Tables:
 
Table 1: Farm Equipment Market Overview 2023-2030
Table 2: Farm Equipment Market Leader Analysis 2023-2024 (US$)
Table 3: Farm Equipment Market Product Analysis 2023-2024 (US$)
Table 4: Farm Equipment Market End User Analysis 2023-2024 (US$)
Table 5: Farm Equipment Market Patent Analysis 2021-2023* (US$)
Table 6: Farm Equipment Market Financial Analysis 2023-2024 (US$)
Table 7: Farm Equipment Market Driver Analysis 2023-2024 (US$)
Table 8: Farm Equipment Market Challenges Analysis 2023-2024 (US$)
Table 9: Farm Equipment Market Constraint Analysis 2023-2024 (US$)
Table 10: Farm Equipment Market Supplier Bargaining Power Analysis 2023-2024 (US$)
Table 11: Farm Equipment Market Buyer Bargaining Power Analysis 2023-2024 (US$)
Table 12: Farm Equipment Market Threat of Substitutes Analysis 2023-2024 (US$)
Table 13: Farm Equipment Market Threat of New Entrants Analysis 2023-2024 (US$)
Table 14: Farm Equipment Market Degree of Competition Analysis 2023-2024 (US$)
Table 15: Farm Equipment Market Value Chain Analysis 2023-2024 (US$)
Table 16: Farm Equipment Market Pricing Analysis 2023-2030 (US$)
Table 17: Farm Equipment Market Opportunities Analysis 2023-2030 (US$)
Table 18: Farm Equipment Market Product Life Cycle Analysis 2023-2030 (US$)
Table 19: Farm Equipment Market Supplier Analysis 2023-2024 (US$)
Table 20: Farm Equipment Market Distributor Analysis 2023-2024 (US$)
Table 21: Farm Equipment Market Trend Analysis 2023-2024 (US$)
Table 22: Farm Equipment Market Size 2023 (US$)
Table 23: Farm Equipment Market Forecast Analysis 2023-2030 (US$)
Table 24: Farm Equipment Market Sales Forecast Analysis 2023-2030 (Units)
Table 25: Farm Equipment Market, Revenue & Volume, By Type, 2023-2030 ($)
Table 26: Farm Equipment Market By Type, Revenue & Volume, By Trailers and Trucks, 2023-2030 ($)
Table 27: Farm Equipment Market By Type, Revenue & Volume, By Tractors, 2023-2030 ($)
Table 28: Farm Equipment Market By Type, Revenue & Volume, By Tillage Equipment, 2023-2030 ($)
Table 29: Farm Equipment Market By Type, Revenue & Volume, By Planting Equipment, 2023-2030 ($)
Table 30: Farm Equipment Market By Type, Revenue & Volume, By Irrigation Equipment, 2023-2030 ($)
Table 31: Farm Equipment Market, Revenue & Volume, By Phase, 2023-2030 ($)
Table 32: Farm Equipment Market By Phase, Revenue & Volume, By Land Development, 2023-2030 ($)
Table 33: Farm Equipment Market By Phase, Revenue & Volume, By Sowing and Planting, 2023-2030 ($)
Table 34: Farm Equipment Market By Phase, Revenue & Volume, By Cultivation, 2023-2030 ($)
Table 35: Farm Equipment Market By Phase, Revenue & Volume, By Harvesting and Threshing, 2023-2030 ($)
Table 36: Farm Equipment Market By Phase, Revenue & Volume, By Post Harvesting, 2023-2030 ($)
Table 37: North America Farm Equipment Market, Revenue & Volume, By Type, 2023-2030 ($)
Table 38: North America Farm Equipment Market, Revenue & Volume, By Phase, 2023-2030 ($)
Table 39: South america Farm Equipment Market, Revenue & Volume, By Type, 2023-2030 ($)
Table 40: South america Farm Equipment Market, Revenue & Volume, By Phase, 2023-2030 ($)
Table 41: Europe Farm Equipment Market, Revenue & Volume, By Type, 2023-2030 ($)
Table 42: Europe Farm Equipment Market, Revenue & Volume, By Phase, 2023-2030 ($)
Table 43: APAC Farm Equipment Market, Revenue & Volume, By Type, 2023-2030 ($)
Table 44: APAC Farm Equipment Market, Revenue & Volume, By Phase, 2023-2030 ($)
Table 45: Middle East & Africa Farm Equipment Market, Revenue & Volume, By Type, 2023-2030 ($)
Table 46: Middle East & Africa Farm Equipment Market, Revenue & Volume, By Phase, 2023-2030 ($)
Table 47: Russia Farm Equipment Market, Revenue & Volume, By Type, 2023-2030 ($)
Table 48: Russia Farm Equipment Market, Revenue & Volume, By Phase, 2023-2030 ($)
Table 49: Israel Farm Equipment Market, Revenue & Volume, By Type, 2023-2030 ($)
Table 50: Israel Farm Equipment Market, Revenue & Volume, By Phase, 2023-2030 ($)
Table 51: Top Companies 2023 (US$) Farm Equipment Market, Revenue & Volume
Table 52: Product Launch 2023-2024 Farm Equipment Market, Revenue & Volume
Table 53: Mergers & Acquistions 2023-2024 Farm Equipment Market, Revenue & Volume
 
 
List of Figures:
 
Figure 1: Overview of Farm Equipment Market 2023-2030
Figure 2: Market Share Analysis for Farm Equipment Market 2023 (US$)
Figure 3: Product Comparison in Farm Equipment Market 2023-2024 (US$)
Figure 4: End User Profile for Farm Equipment Market 2023-2024 (US$)
Figure 5: Patent Application and Grant in Farm Equipment Market 2021-2023* (US$)
Figure 6: Top 5 Companies Financial Analysis in Farm Equipment Market 2023-2024 (US$)
Figure 7: Market Entry Strategy in Farm Equipment Market 2023-2024
Figure 8: Ecosystem Analysis in Farm Equipment Market 2023
Figure 9: Average Selling Price in Farm Equipment Market 2023-2030
Figure 10: Top Opportunites in Farm Equipment Market 2023-2024
Figure 11: Market Life Cycle Analysis in Farm Equipment Market
Figure 12: GlobalBy Type Farm Equipment Market Revenue, 2023-2030 ($)
Figure 13: GlobalBy Phase Farm Equipment Market Revenue, 2023-2030 ($)
Figure 14: Global Farm Equipment Market - By Geography
Figure 15: Global Farm Equipment Market Value & Volume, By Geography, 2023-2030 ($) 
Figure 16: Global Farm Equipment Market CAGR, By Geography, 2023-2030 (%)
Figure 17: North America Farm Equipment Market Value & Volume, 2023-2030 ($)
Figure 18: US Farm Equipment Market Value & Volume, 2023-2030 ($)
Figure 19: US GDP and Population, 2023-2024 ($)
Figure 20: US GDP – Composition of 2023, By Sector of Origin
Figure 21: US Export and Import Value & Volume, 2023-2024 ($)
Figure 22: Canada Farm Equipment Market Value & Volume, 2023-2030 ($)
Figure 23: Canada GDP and Population, 2023-2024 ($)
Figure 24: Canada GDP – Composition of 2023, By Sector of Origin
Figure 25: Canada Export and Import Value & Volume, 2023-2024 ($)
Figure 26: Mexico Farm Equipment Market Value & Volume, 2023-2030 ($)
Figure 27: Mexico GDP and Population, 2023-2024 ($)
Figure 28: Mexico GDP – Composition of 2023, By Sector of Origin
Figure 29: Mexico Export and Import Value & Volume, 2023-2024 ($)
Figure 30: South America Farm Equipment Market Value & Volume, 2023-2030 ($)
Figure 31: Brazil Farm Equipment Market Value & Volume, 2023-2030 ($)
Figure 32: Brazil GDP and Population, 2023-2024 ($)
Figure 33: Brazil GDP – Composition of 2023, By Sector of Origin
Figure 34: Brazil Export and Import Value & Volume, 2023-2024 ($)
Figure 35: Venezuela Farm Equipment Market Value & Volume, 2023-2030 ($)
Figure 36: Venezuela GDP and Population, 2023-2024 ($)
Figure 37: Venezuela GDP – Composition of 2023, By Sector of Origin
Figure 38: Venezuela Export and Import Value & Volume, 2023-2024 ($)
Figure 39: Argentina Farm Equipment Market Value & Volume, 2023-2030 ($)
Figure 40: Argentina GDP and Population, 2023-2024 ($)
Figure 41: Argentina GDP – Composition of 2023, By Sector of Origin
Figure 42: Argentina Export and Import Value & Volume, 2023-2024 ($)
Figure 43: Ecuador Farm Equipment Market Value & Volume, 2023-2030 ($)
Figure 44: Ecuador GDP and Population, 2023-2024 ($)
Figure 45: Ecuador GDP – Composition of 2023, By Sector of Origin
Figure 46: Ecuador Export and Import Value & Volume, 2023-2024 ($)
Figure 47: Peru Farm Equipment Market Value & Volume, 2023-2030 ($)
Figure 48: Peru GDP and Population, 2023-2024 ($)
Figure 49: Peru GDP – Composition of 2023, By Sector of Origin
Figure 50: Peru Export and Import Value & Volume, 2023-2024 ($)
Figure 51: Colombia Farm Equipment Market Value & Volume, 2023-2030 ($)
Figure 52: Colombia GDP and Population, 2023-2024 ($)
Figure 53: Colombia GDP – Composition of 2023, By Sector of Origin
Figure 54: Colombia Export and Import Value & Volume, 2023-2024 ($)
Figure 55: Costa Rica Farm Equipment Market Value & Volume, 2023-2030 ($)
Figure 56: Costa Rica GDP and Population, 2023-2024 ($)
Figure 57: Costa Rica GDP – Composition of 2023, By Sector of Origin
Figure 58: Costa Rica Export and Import Value & Volume, 2023-2024 ($)
Figure 59: Europe Farm Equipment Market Value & Volume, 2023-2030 ($)
Figure 60: U.K Farm Equipment Market Value & Volume, 2023-2030 ($)
Figure 61: U.K GDP and Population, 2023-2024 ($)
Figure 62: U.K GDP – Composition of 2023, By Sector of Origin
Figure 63: U.K Export and Import Value & Volume, 2023-2024 ($)
Figure 64: Germany Farm Equipment Market Value & Volume, 2023-2030 ($)
Figure 65: Germany GDP and Population, 2023-2024 ($)
Figure 66: Germany GDP – Composition of 2023, By Sector of Origin
Figure 67: Germany Export and Import Value & Volume, 2023-2024 ($)
Figure 68: Italy Farm Equipment Market Value & Volume, 2023-2030 ($)
Figure 69: Italy GDP and Population, 2023-2024 ($)
Figure 70: Italy GDP – Composition of 2023, By Sector of Origin
Figure 71: Italy Export and Import Value & Volume, 2023-2024 ($)
Figure 72: France Farm Equipment Market Value & Volume, 2023-2030 ($)
Figure 73: France GDP and Population, 2023-2024 ($)
Figure 74: France GDP – Composition of 2023, By Sector of Origin
Figure 75: France Export and Import Value & Volume, 2023-2024 ($)
Figure 76: Netherlands Farm Equipment Market Value & Volume, 2023-2030 ($)
Figure 77: Netherlands GDP and Population, 2023-2024 ($)
Figure 78: Netherlands GDP – Composition of 2023, By Sector of Origin
Figure 79: Netherlands Export and Import Value & Volume, 2023-2024 ($)
Figure 80: Belgium Farm Equipment Market Value & Volume, 2023-2030 ($)
Figure 81: Belgium GDP and Population, 2023-2024 ($)
Figure 82: Belgium GDP – Composition of 2023, By Sector of Origin
Figure 83: Belgium Export and Import Value & Volume, 2023-2024 ($)
Figure 84: Spain Farm Equipment Market Value & Volume, 2023-2030 ($)
Figure 85: Spain GDP and Population, 2023-2024 ($)
Figure 86: Spain GDP – Composition of 2023, By Sector of Origin
Figure 87: Spain Export and Import Value & Volume, 2023-2024 ($)
Figure 88: Denmark Farm Equipment Market Value & Volume, 2023-2030 ($)
Figure 89: Denmark GDP and Population, 2023-2024 ($)
Figure 90: Denmark GDP – Composition of 2023, By Sector of Origin
Figure 91: Denmark Export and Import Value & Volume, 2023-2024 ($)
Figure 92: APAC Farm Equipment Market Value & Volume, 2023-2030 ($)
Figure 93: China Farm Equipment Market Value & Volume, 2023-2030
Figure 94: China GDP and Population, 2023-2024 ($)
Figure 95: China GDP – Composition of 2023, By Sector of Origin
Figure 96: China Export and Import Value & Volume, 2023-2024 ($) Farm Equipment Market China Export and Import Value & Volume, 2023-2024 ($)
Figure 97: Australia Farm Equipment Market Value & Volume, 2023-2030 ($)
Figure 98: Australia GDP and Population, 2023-2024 ($)
Figure 99: Australia GDP – Composition of 2023, By Sector of Origin
Figure 100: Australia Export and Import Value & Volume, 2023-2024 ($)
Figure 101: South Korea Farm Equipment Market Value & Volume, 2023-2030 ($)
Figure 102: South Korea GDP and Population, 2023-2024 ($)
Figure 103: South Korea GDP – Composition of 2023, By Sector of Origin
Figure 104: South Korea Export and Import Value & Volume, 2023-2024 ($)
Figure 105: India Farm Equipment Market Value & Volume, 2023-2030 ($)
Figure 106: India GDP and Population, 2023-2024 ($)
Figure 107: India GDP – Composition of 2023, By Sector of Origin
Figure 108: India Export and Import Value & Volume, 2023-2024 ($)
Figure 109: Taiwan Farm Equipment Market Value & Volume, 2023-2030 ($)
Figure 110: Taiwan GDP and Population, 2023-2024 ($)
Figure 111: Taiwan GDP – Composition of 2023, By Sector of Origin
Figure 112: Taiwan Export and Import Value & Volume, 2023-2024 ($)
Figure 113: Malaysia Farm Equipment Market Value & Volume, 2023-2030 ($)
Figure 114: Malaysia GDP and Population, 2023-2024 ($)
Figure 115: Malaysia GDP – Composition of 2023, By Sector of Origin
Figure 116: Malaysia Export and Import Value & Volume, 2023-2024 ($)
Figure 117: Hong Kong Farm Equipment Market Value & Volume, 2023-2030 ($)
Figure 118: Hong Kong GDP and Population, 2023-2024 ($)
Figure 119: Hong Kong GDP – Composition of 2023, By Sector of Origin
Figure 120: Hong Kong Export and Import Value & Volume, 2023-2024 ($)
Figure 121: Middle East & Africa Farm Equipment Market Middle East & Africa 3D Printing Market Value & Volume, 2023-2030 ($)
Figure 122: Russia Farm Equipment Market Value & Volume, 2023-2030 ($)
Figure 123: Russia GDP and Population, 2023-2024 ($)
Figure 124: Russia GDP – Composition of 2023, By Sector of Origin
Figure 125: Russia Export and Import Value & Volume, 2023-2024 ($)
Figure 126: Israel Farm Equipment Market Value & Volume, 2023-2030 ($)
Figure 127: Israel GDP and Population, 2023-2024 ($)
Figure 128: Israel GDP – Composition of 2023, By Sector of Origin
Figure 129: Israel Export and Import Value & Volume, 2023-2024 ($)
Figure 130: Entropy Share, By Strategies, 2023-2024* (%) Farm Equipment Market 
Figure 131: Developments, 2023-2024* Farm Equipment Market 
Figure 132: Company 1 Farm Equipment Market Net Revenue, By Years, 2023-2024* ($)
Figure 133: Company 1 Farm Equipment Market Net Revenue Share, By Business segments, 2023 (%)
Figure 134: Company 1 Farm Equipment Market Net Sales Share, By Geography, 2023 (%)
Figure 135: Company 2 Farm Equipment Market Net Revenue, By Years, 2023-2024* ($)
Figure 136: Company 2 Farm Equipment Market Net Revenue Share, By Business segments, 2023 (%)
Figure 137: Company 2 Farm Equipment Market Net Sales Share, By Geography, 2023 (%)
Figure 138: Company 3 Farm Equipment Market Net Revenue, By Years, 2023-2024* ($)
Figure 139: Company 3 Farm Equipment Market Net Revenue Share, By Business segments, 2023 (%)
Figure 140: Company 3 Farm Equipment Market Net Sales Share, By Geography, 2023 (%)
Figure 141: Company 4 Farm Equipment Market Net Revenue, By Years, 2023-2024* ($)
Figure 142: Company 4 Farm Equipment Market Net Revenue Share, By Business segments, 2023 (%)
Figure 143: Company 4 Farm Equipment Market Net Sales Share, By Geography, 2023 (%)
Figure 144: Company 5 Farm Equipment Market Net Revenue, By Years, 2023-2024* ($)
Figure 145: Company 5 Farm Equipment Market Net Revenue Share, By Business segments, 2023 (%)
Figure 146: Company 5 Farm Equipment Market Net Sales Share, By Geography, 2023 (%)
Figure 147: Company 6 Farm Equipment Market Net Revenue, By Years, 2023-2024* ($)
Figure 148: Company 6 Farm Equipment Market Net Revenue Share, By Business segments, 2023 (%)
Figure 149: Company 6 Farm Equipment Market Net Sales Share, By Geography, 2023 (%)
Figure 150: Company 7 Farm Equipment Market Net Revenue, By Years, 2023-2024* ($)
Figure 151: Company 7 Farm Equipment Market Net Revenue Share, By Business segments, 2023 (%)
Figure 152: Company 7 Farm Equipment Market Net Sales Share, By Geography, 2023 (%)
Figure 153: Company 8 Farm Equipment Market Net Revenue, By Years, 2023-2024* ($)
Figure 154: Company 8 Farm Equipment Market Net Revenue Share, By Business segments, 2023 (%)
Figure 155: Company 8 Farm Equipment Market Net Sales Share, By Geography, 2023 (%)
Figure 156: Company 9 Farm Equipment Market Net Revenue, By Years, 2023-2024* ($)
Figure 157: Company 9 Farm Equipment Market Net Revenue Share, By Business segments, 2023 (%)
Figure 158: Company 9 Farm Equipment Market Net Sales Share, By Geography, 2023 (%)
Figure 159: Company 10 Farm Equipment Market Net Revenue, By Years, 2023-2024* ($)
Figure 160: Company 10 Farm Equipment Market Net Revenue Share, By Business segments, 2023 (%)
Figure 161: Company 10 Farm Equipment Market Net Sales Share, By Geography, 2023 (%)
Figure 162: Company 11 Farm Equipment Market Net Revenue, By Years, 2023-2024* ($)
Figure 163: Company 11 Farm Equipment Market Net Revenue Share, By Business segments, 2023 (%)
Figure 164: Company 11 Farm Equipment Market Net Sales Share, By Geography, 2023 (%)
Figure 165: Company 12 Farm Equipment Market Net Revenue, By Years, 2023-2024* ($)
Figure 166: Company 12 Farm Equipment Market Net Revenue Share, By Business segments, 2023 (%)
Figure 167: Company 12 Farm Equipment Market Net Sales Share, By Geography, 2023 (%)
Figure 168: Company 13 Farm Equipment Market Net Revenue, By Years, 2023-2024* ($)
Figure 169: Company 13 Farm Equipment Market Net Revenue Share, By Business segments, 2023 (%)
Figure 170: Company 13 Farm Equipment Market Net Sales Share, By Geography, 2023 (%)
Figure 171: Company 14 Farm Equipment Market Net Revenue, By Years, 2023-2024* ($)
Figure 172: Company 14 Farm Equipment Market Net Revenue Share, By Business segments, 2023 (%)
Figure 173: Company 14 Farm Equipment Market Net Sales Share, By Geography, 2023 (%)
Figure 174: Company 15 Farm Equipment Market Net Revenue, By Years, 2023-2024* ($)
Figure 175: Company 15 Farm Equipment Market Net Revenue Share, By Business segments, 2023 (%)
Figure 176: Company 15 Farm Equipment Market Net Sales Share, By Geography, 2023 (%)