 Email
Email Print
Print


Voltage Detector Market- By Type ; By End-Users ; & By Geography - Forecast (2024 - 2030)
Voltage Sensor Market Outlook
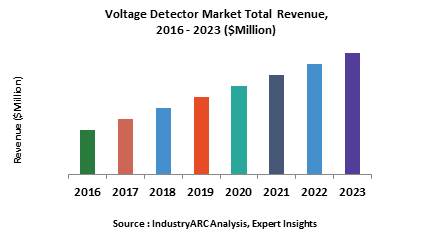
Voltage Detector Market Size is forecast to reach $ 5760 Million by 2030, at a CAGR of 11% during forecast period 2024-2030.A voltage sensor is used to determine, monitor, and measure both the voltage supply, AC as well as DC. It can convert the measured voltage into a physical signal, which is proportional to the voltage. It is highly recommended for situations where there exists power issues. In traditional voltage sensors, there is a needle or a pointer to detect the voltage supply, whereas in digital voltage sensors, there is an alphanumeric interface. It can detect the voltage supply without making any physical contact. These are majorly used in power demand control areas, for power failure detection, and for safety switching and load control. According to IndustryARC findings, Hall Effect Technology will hold the largest market share during the forecast period. Hall Effect voltage sensors are highly reliable components that work on the principle of closed-loop Hall Effect and magnetic compensation. These are used for measuring both AC and DC voltages with different waveforms.
Voltage Sensor Market Growth Drivers
The growing penetration of electronic devices across residential, commercial, and industrial applications and the rising utilization of RFID (Radio Frequency Identification) tags and micro sensor networks that require energy measuring devices are some of the driving factors for the market growth.
Voltage Sensor Market Challenges
Low operating temperature of voltage sensors make them unsuitable for use in high power distribution circuits. Capital and time intensive product development is restricting the companies to invest in research activities, thus limiting the market growth.
Voltage Sensor Market Research Scope
The base year of the study is 2017, with forecast done up to 2023. The study presents a thorough analysis of the competitive landscape, taking into account the market shares of the leading companies. It also provides information on unit shipments. These provide the key market participants with the necessary business intelligence and help them understand the future of the Voltage Sensor market. The assessment includes the forecast, an overview of the competitive structure, the market shares of the competitors, as well as the market trends, market demands, market drivers, market challenges, and product analysis. The market drivers and restraints have been assessed to fathom their impact over the forecast period. This report further identifies the key opportunities for growth while also detailing the key challenges and possible threats. The key areas of focus include the types of voltage sensors market, and their specific applications in different industries.
Voltage Sensor Market Report: Industry Coverage
Types of Voltage Sensors: Electronic, Hall Effect Technology and Others
Applications of Voltage Sensors: Power (Generation, Transmission, Distribution), Railway (Main and Auxiliary Converters, Battery Chargers, Choppers, Substations & Others), Industrial (Machineries, Motor Protection Systems & Others), Telecommunication (Data Centers, Servers, Base Stations & Others), Consumer Electronics (Inverters, UPS, & Others) and Others
The Voltage Sensor market report also analyzes the major geographic regions for the market as well as the major countries for the market in these regions. The regions and countries covered in the study include:
- North America: The U.S., Canada, Mexico
- South America: Brazil, Argentina, and Rest of Americas
- Europe: The U.K., Germany, Italy, France, and Rest of Europe
- APAC: China, Japan, India, South Korea and Rest of APAC
- Rest of the World (RoW): The Middle East and Africa
Voltage Sensor Market Key Players Perspective
Secheron Hasler Group has its headquarters at Switzerland. Recently, in October 2018, it launched TMS new voltage sensor at INNOTRANS. TMS is a scalable platform dedicated to rolling stock applications and used for different functions including traction control, vehicle protection, and energy metering.
Some of the other key players mentioned in this report are Eaton Corporation plc, ABB Ltd., Broadcom Inc., Altea B.V., and Arteche Group.
Voltage Sensor Market Trends
- The advancements in technology is leading to price reduction in smart digital solutions, making it feasible to implement sensor technology in the grid to help improve operational efficiencies. Development of high and medium voltage sensors for measuring filters, systems, and bushing has been emerging in the recent years.
- The impending availability of data services based on 5G network technology will provide online access to more data, even faster. This will require 5G infrastructure installed at data centers, with a major focus on micro-datacenters, whose lower capacities but higher numbers would be sufficient to support more distributed cloud infrastructure. All this will lead to better voltage sensors for optimizing assets.
- In many applications, UPS plays a mission critical role, where the loss of power is not an option. Voltage sensors play a key role in controlling the output current accurately to ensure efficiency, and manage charging and discharging cycles to ensure longer battery life.
Key Market Players:
The Top 5 companies in Voltage Detector Market are:
- ABB Ltd.
- Siemens AG
- Schneider Electric
- Honeywell International Inc.
- Eaton Corporation
1. Voltage Sensor Market – Market Overview
1.1. Definitions and Scope
2. Voltage Sensor Market – Executive Summary
2.1. Market Revenue, Market Size and Key Trends by Company
2.2. Key Trends by Type of Application
2.3. Key Trends Segmented by Geography
3. Voltage Sensor Market — Comparative Analysis
3.1. Comparative Analysis
3.1.1. Product Benchmarking — Top 10 Companies
3.1.2. Top 5 Financials Analysis
3.1.3. Market Value Split by Top 10 Companies
3.1.4. Patent Analysis — Top 10 Companies
3.1.5. Pricing Analysis
4. Voltage Sensor Market — Startup Companies Scenario
4.1. Top 10 Startup Company Analysis by
4.1.1. Investment
4.1.2. Revenue
4.1.3. Market Shares
4.1.4. Market Size and Application Analysis
4.1.5. Venture Capital and Funding Scenario
5. Voltage Sensor Market – Industry Market Entry Scenario Premium
5.1. Regulatory Framework Overview
5.2. New Business and Ease of Doing Business Index
5.3. Case Studies of Successful Ventures
5.4. Customer Analysis – Top 10 Companies
6. Voltage Sensor Market — Market Forces
6.1. Drivers
6.2. Constraints
6.3. Challenges
6.4. Porter’s Five Force Model
6.4.1. Bargaining Power of Suppliers
6.4.2. Bargaining Power of Customers
6.4.3. Threat of New Entrants
6.4.4. Rivalry Among Existing Players
6.4.5. Threat of Substitutes
7. Voltage Sensor Market – Strategic Analysis
7.1. Value Chain Analysis
7.2. Opportunities Analysis
7.3. Product Life Cycle
7.4. Suppliers and Distributors Market Share
8. Voltage Sensor Market – By Type (Market Size — $Million/$Billion)
8.1. Market Size and Market Share Analysis
8.2. Application Revenue and Trend Research
8.3. Product Segment Analysis
8.3.1. Electronic
8.3.2. Hall Effect Technology
8.3.3. Others
9. Voltage Sensor Market – By End-Users (Market Size — $Million/$Billion)
9.1. Segment Type Size and Market Share Analysis
9.2. Application Revenue and Trends by Type of Application
9.3. Application Segment Analysis by Type
9.3.1. Power
9.3.1.1. Generation
9.3.1.2. Transmission
9.3.1.3. Distribution
9.3.2. Railway
9.3.2.1. Main and Auxiliary Converters
9.3.2.2. Battery Chargers
9.3.2.3. Choppers
9.3.2.4. Substations
9.3.2.5. Others
9.3.3. Industrial
9.3.3.1. Machineries
9.3.3.2. Motor Protection Systems
9.3.3.3. Others
9.3.4. Telecommunication
9.3.4.1. Data Centers
9.3.4.2. Servers
9.3.4.3. Base Stations
9.3.4.4. Others
9.3.5. Consumer Electronics
9.3.5.1. Inverters
9.3.5.2. UPS
9.3.5.3. Others
9.3.6. Others
10. Voltage Sensor Market – By Geography (Market Size — $Million/$Billion)
10.1. Voltage Sensor Market – North America Segment Research
10.2. North America Market Research (Market Share — $Million/$Billion)
10.2.1. Segment Type Size and Market Size Analysis
10.2.2. Revenue and Trends
10.2.3. Application Revenue and Trends by Type of Application
10.2.4. Company Revenue and Product Analysis
10.2.5. North America Segment — Product type and Application Market Size
10.2.5.1. U.S.
10.2.5.2. Canada
10.2.5.3. Mexico
10.3. Voltage Sensor Market – South America Segment Research
10.4. South America Market Research (Market Size — $Million/$Billion)
10.4.1. Segment Type Size and Market Size Analysis
10.4.2. Revenue and Trends
10.4.3. Application Revenue and Trends by Type of Application
10.4.4. Company Revenue and Product Analysis
10.4.5. South America Segment — Product Type and Application Market Size
10.4.5.1. Brazil
10.4.5.2. Argentina
10.4.5.3. Rest of Americas
10.5. Voltage Sensor Market – Europe Segment Research
10.6. Europe Market Research (Market Size — $Million/$Billion)
10.6.1. Segment Type Size and Market Size Analysis
10.6.2. Revenue and Trends
10.6.3. Application Revenue and Trends by Type of Application
10.6.4. Company Revenue and Product Analysis
10.6.5. Europe Segment — Product Type and Application Market Size
10.6.5.1. U.K.
10.6.5.2. Germany
10.6.5.3. France
10.6.5.4. Italy
10.6.5.5. Rest of Europe
10.7. Voltage Sensor Market – APAC Segment Research
10.8. APAC Market Research (Market Size — $Million/$Billion)
10.8.1. Segment Type Size and Market Size Analysis
10.8.2. Revenue and Trends
10.8.3. Application Revenue and Trends by Type of Application
10.8.4. Company Revenue and Product Analysis
10.8.5. APAC Segment —Product Type and Application Market Size
10.8.5.1. China
10.8.5.2. Japan
10.8.5.3. India
10.8.5.4. South Korea
10.8.5.5. Rest of APAC
10.9. Voltage Sensor Market – RoW Segment Research
10.10. RoW Market Research (Market Size — $Million/$Billion)
10.10.1. Segment Type Size and Market Size Analysis
10.10.2. Revenue and Trends
10.10.3. Application Revenue and Trends by Type of Application
10.10.4. Company Revenue and Product Analysis
10.10.5. RoW Segment — Product type and Application Market Size
10.10.5.1. Middle East
10.10.5.2. Africa
11. Voltage Sensor Market – Market Entropy
11.1. New Product Launches
11.2. M&As, Collaborations, JVs and Partnerships
12. Voltage Sensor Market – Industry/Segment Competition Landscape
12.1. Market Share Analysis
12.1.1. Market Share by Country — Top Companies
12.1.2. Market Share by Region — Top 10 Companies
12.1.3. Market Share by Type of Application – Top 10 Companies
12.1.4. Market Share by Type of Product/Product Category — Top 10 Companies
12.1.5. Market Share at Global Level — Top 10 Companies
12.1.6. Best Practices for Companies
13. Voltage Sensor Market – Key Company List by Country Premium
14. Voltage Sensor Market – Company Analysis
14.1. Market Share, Company Revenue, Products, M&A, Developments
14.2. Eaton Corporation plc
14.3. ABB Ltd.
14.4. Broadcom Inc.
14.5. Altea B.V.
14.6. Arteche Group
14.7. Company 6
14.8. Company 7
14.9. Company 8
14.10. Company 9
14.11. Company 10 and more
"*Financials of private companies would be provided on a best-efforts basis"
15. Voltage Sensor Market – Appendix
15.1. Abbreviations
15.2. Sources
16. Voltage Sensor Market – Methodology
16.1. Research Methodology
16.1.1. Company Expert Interviews
16.1.2. Industry Databases
16.1.3. Associations
16.1.4. Company News
16.1.5. Company Annual Reports
16.1.6. Application Trends
16.1.7. New Products and Product Database
16.1.8. Company Transcripts
16.1.9. R&D Trends
16.1.10. Key Opinion Leaders Interviews
16.1.11. Supply and Demand Trends
LIST OF TABLES:
Table 1: Voltage Detector IC Pricing Analysis
Table 2: Voltage Detector Market, By System Type, 2015-2023 ($Million)
Table 3: Voltage Detector Market Value, By Application, 2015-2023 ($Million)
Table 4: Voltage Detector Market, By Region, 2015-2023 ($Million)
Table 5: North America: Voltage Detector Market, By Type, 2015-2023 ($Million)
Table 6: North America: Voltage Detector Market, By Application, 2015-2023 ($Million)
Table 7: North America: Voltage Detector Market, By Country, 2015-2023 ($Million)
Table 8: Europe: Voltage Detector Market, By Type, 2015-2023 ($Million)
Table 9: Europe: Voltage Detector Market, By Application, 2015-2023 ($Million)
Table 10: Europe: Voltage Detector Market, By Country, 2015-2023 ($Million)
Table 11: APAC: Voltage Detector Market Value, By Type, 2015-2023 ($Million)
Table 12: APAC: Voltage Detector Market Value, By Application, 2015-2023 ($Million)
Table 13: APAC: Voltage Detector Market Value, By Country, 2015-2023 ($Million)
Table 14: RoW: Voltage Detector Market Value, By Type, 2015-2023 ($Million)
Table 15: RoW: Voltage Detector Market Value, By Application, 2015-2023 ($Million)
Table 16: RoW: Voltage Detector Market Value, By Region, 2015-2023 ($Million)
Table 17: South America: Voltage Detector Market Value, 2015-2023 ($Million)
Table 18: Middle East: Voltage Detector Market Value, 2015-2023 ($Million)
Table 19: Africa: Voltage Detector Market Value, 2015-2023 ($Million)
Table 20: RoW: Voltage Detector Market CAGR, By Region, 2023-2030 (%)
LIST OF FIGURES:
Figure 1: Voltage Detector Market Value, 2015-2023 ($Million)
Figure 2: Voltage Detector Market Value Share, By Type, 2015 (%)
Figure 3: Voltage Detector Market Value, By Application, 2015 & 2023 ($Million)
Figure 4: Voltage Detector Market Value, By Geography, 2015 & 2023 ($Million)
Figure 5: Voltage Detector Market Revenue Share, By Company, 2016 (%)
Figure 6: Voltage Detector Patents, By Year, 2013-2016
Figure 7: Voltage Detector Patents, By Companies (%)
Figure 8: Texas Instruments
Figure 9: STMicroelectronics
Figure 10: Analog Devices
Figure 11: ROHM Semiconductor
Figure 12: ON Semiconductor
Figure 13: EPS, By Company, 2013-2015($)
Figure 14: Voltage Detector Market Size, 2013-2020 ($Billion)
Figure 15: Voltage Detector IC Pricing Analysis, 2015 – 2021 ($/Unit)
Figure 16: High Frequency AC Voltage Detector: Voltage Detector Market, 2015-2023 ($Million)
Figure 17: Low Frequency AC Voltage Detector: Voltage Detector Market, 2015-2023 ($Million)
Figure 18: Pulsed DC Voltage Detector: Voltage Detector Market, 2015-2023 ($Million)
Figure 19: Continuous DC Voltage Detector: Voltage Detector Market, 2015-2023 ($Million)
Figure 20: Residential: Voltage Detector Market Value, 2015-2023 ($Million)
Figure 21: Industrial: Voltage Detector Market Value, 2015-2023 ($Million)
Figure 22: Commercial: Voltage Detector Market Value, 2015-2023 ($Million)
Figure 23: Others: Voltage Detector Market Value, 2015-2023 ($Million)
Figure 24: Voltage Detector Market - By Geography
Figure 25: U.S.: GDP and Population, 2012-2015 ($Trillion, Million)
Figure 26: U.S.: GDP – Composition of 2015, By Sector of Origin
Figure 27: U.S.: Export and Import Value, 2012-2015 ($Trillion)
Figure 28: Canada: GDP and Population, 2012-2015 ($Trillion, Million)
Figure 29: Canada: GDP – Composition of 2015, By Sector of Origin
Figure 30: Canada: Export and Import Value, 2012-2015 ($Million)
Figure 31: Mexico: GDP and Population, 2012-2015 ($Trillion, Million)
Figure 32: Mexico: GDP – Composition of 2015, By Sector of Origin
Figure 33: Mexico: Export and Import Value, 2012-2015 ($Million)
Figure 34: U.S: Voltage Detector Market Value, 2015-2023 ($Million)
Figure 35: Canada: Voltage Detector Market Value, 2015-2023 ($Million)
Figure 36: Mexico: Voltage Detector Market Value, 2015-2023 ($Million)
Figure 37: North America: Voltage Detector Market CAGR, By Country, 2023-2030 (%)
Figure 38: Germany: GDP and Population, 2012-2015 ($Trillion, Million)
Figure 39: Germany: GDP – Composition of 2015, By Sector of Origin
Figure 40: Germany: Export and Import Value, 2012-2015 ($Million)
Figure 41: U.K.: GDP and Population, 2012-2015 ($Trillion, Million)
Figure 42: U.K.: GDP – Composition of 2015, By Sector of Origin
Figure 43: U.K.: Export and Import Value, 2012-2015 ($Million)
Figure 44: France: GDP and Population, 2012-2015 ($Trillion, Million)
Figure 45: France: GDP – Composition of 2015, By Sector of Origin
Figure 46: France: Export and Import Value, 2012-2015 ($Million)
Figure 47: Italy: GDP and Population, 2012-2015 ($Trillion, Million)
Figure 48: Italy: GDP – Composition of 2015, By Sector of Origin
Figure 49: Italy: Export and Import Value, 2012-2015 ($Million)
Figure 50: Spain: GDP and Population, 2012-2015 ($Trillion, Million)
Figure 51: Spain: GDP – Composition of 2015, By Sector of Origin
Figure 52: Spain: Export and Import Value, 2012-2015 ($Million)
Figure 53: Germany: Voltage Detector Market Value 2015-2023 ($Million)
Figure 54: U.K.: Voltage Detector Market Value, 2015-2023 ($Million)
Figure 55: France: Voltage Detector Market Value, 2015-2023 ($Million)
Figure 56: Italy: Voltage Detector Market Value, 2015-2023 ($Million)
Figure 57: Spain: Voltage Detector Market Value, 2015-2023 ($Million)
Figure 58: Russia: Voltage Detector Market Value, 2015-2023 ($Million)
Figure 59: Others: Voltage Detector Market Value, 2015-2023 ($Million)
Figure 60: Europe: Voltage Detector Market CAGR, By Country, 2023-2030 (%)
Figure 61: China: GDP and Population, 2012-2015 ($Trillion, Million)
Figure 62: China: GDP – Composition of 2015, By Sector of Origin
Figure 63: China: Export and Import Value, 2012-2015 ($Million)
Figure 64: Japan: GDP and Population, 2012-2015 ($Trillion, Million)
Figure 65: Japan: GDP – Composition of 2015, By Sector of Origin
Figure 66: Japan: Export and Import Value, 2012-2015 ($Million)
Figure 67: India: GDP and Population, 2012-2015 ($Trillion, Million)
Figure 68: India: GDP – Composition of 2015, By Sector of Origin
Figure 69: India: Export and Import Value, 2012-2015 ($Million)
Figure 70: South Korea: GDP and Population, 2012-2015 ($Trillion, Million)
Figure 71: South Korea: GDP – Composition of 2015, By Sector of Origin
Figure 72: South Korea: Export and Import Value, 2012-2015 ($Million)
Figure 73: China: Voltage Detector Market Value, 2015 -2023 ($Million)
Figure 74: Japan: Voltage Detector Market Value, 2015 -2023 ($Million)
Figure 75: India: Voltage Detector Market Value, 2015 -2023 ($Million)
Figure 76: South Korea: Voltage Detector Market Value, 2015 -2023 ($Million)
Figure 77: Others: Voltage Detector Market Value, 2015 -2023 ($Million)
Figure 78: APAC: Voltage Detector Market CAGR, By Country, 2023 -2023 (%)
Figure 79: Brazil: GDP and Population, 2012-2015 ($Trillion, Million)
Figure 80: Brazil: GDP – Composition of 2015, By Sector of Origin
Figure 81: Brazil: Export and Import Value, 2012-2015 ($Million)
Figure 82: Voltage Detector Market Entropy, By Total Number of Developments, 2012-2016
Figure 83: Danaher. Revenue, 2013-2015 ($Million)
Figure 84: Danaher. Revenue, By Geography, 2015 (%)
Figure 85: Danaher. Revenue, By Region, 2015 (%)
Figure 86: ROHM Semiconductor. Revenue, 2013-2016 ($Million)
Figure 87: ROHM Semiconductor. Revenue, By Geography, 2016 (%)
Figure 88: ROHM Semiconductor. Revenue, By Segment, 2016 (%)
Figure 89: Torex Semiconductors Ltd, Revenue, 2013-2016 *($Million)
Figure 90: Torex Semiconductors Ltd. Revenue, By Geography, FY2015 (%)
Figure 91: Analog Devices, Inc., Revenue, 2013-2016 ($Billion)
Figure 92: Analog Devices, Inc., By Business Segment, 2016 (%)
Figure 93: Analog Devices, Inc., By Geography, 2016 (%)
Figure 94: Toshiba Corporation Revenue, 2013-2016 ($Million)
Figure 95: Toshiba Corporation Revenue, By Business Segment, 2016 (%)
Figure 96 Toshiba Corporation Revenue Revenue, by Geography, 2016 (%)
Figure 97: On Semiconductor Corporation Revenue, 2013-2015 ($Million)
Figure 98: On Semiconductor Corporation Revenue by Business Segment, 2015 (%)
Figure 99: On Semiconductor Corporation Revenue by Geography, 2015 (%)
Figure 100: Sharp Corporation, Revenue, 2013-2015 ($Million)
Figure 101: Sharp Corporation, By Business Segment, 2015 (%)
Figure 102: Sharp Corporation, Revenue, By Geography, 2015 (%)
Figure 103: STMicroelectronics, Net Sales, By Years, 2012-2015 ($Billion)
Figure 104: STMicroelectronics, Net Sales Share, By Business Segment, 2015 (%)
Figure 105: STMicroelectronics, Net Sales Share, By Geography, 2015 (%)
Figure 106: Texas Instruments Incorporated., Revenue, 2012-2016 ($Million)
Figure 107: Texas Instruments Incorporated., By Business Segment, 2015 (%)
Figure 108: Texas Instruments Incorporated., Revenue, By Geography, 2015 (%)
Figure 109: Seiko Holding Corporation Revenue, 2013-2015 ($Billion)
Figure 110: Seiko Holding Corporation Product Share, By Business Segment, 2015 (%)