 Email
Email Print
Print


Blockchain Market In Government - Forecast(2025 - 2031)
Blockchain in Government Market Overview :
Blockchain in Government Market size is projected to reach USD 35.3 Billion in 2030, growing at a CAGR of 50.4% during the forecasted period 2024 to 2030. The increasing adoption of Blockchain in Government market in multiple application areas, such as growing interest in adoption of blockchain by the agencies of the government and fraudulent activities continuously increasing in public sector etc. has been the key driver for the market. The market has also been segmented on the basis of type such as public, private and consortium Blockchain. The worldwide Blockchain Technologies in Government market is going to penetrate deeply into all the industries verticals. This report assimilated an in-depth assessment of Blockchain in government market by type, applications, and geography. Blockchain in Government encompassed in the scope includes various providers such as Application, Middleware and Infrastructure providers Blockchain in Government. A prominent trend in the global blockchain government market is the growing adoption of this technology by various government entities worldwide. Blockchains technology facilitates the deployment of smart contracts, which are automated agreements with predetermined rules. By enabling self-execution of contracts, smart contracts streamline government contract and procurement procedures, diminishing reliance on intermediaries and boosting overall efficiency.
Interoperability has emerged as a key focal point within the realm of blockchain technology, with governments increasingly prioritizing efforts to facilitate seamless integration between disparate blockchain platforms and networks. The overarching goal is to enable the harmonious coexistence and interaction of various blockchain systems, thereby enhancing efficiency and facilitating smoother data exchange processes. Recognizing the diverse array of blockchain frameworks in existence, governments are actively exploring strategies to bridge the interoperability gap, ensuring compatibility with existing systems and infrastructure. By establishing standardized protocols and interfaces, governments aim to unlock the full potential of blockchain technology, fostering a cohesive ecosystem where information flows freely across interconnected networks, ultimately driving innovation and bolstering the effectiveness of public sector operations.
The report: “Blockchain in Government Market – Forecast (2024-2030)”, by IndustryARC, covers an in-depth analysis of the following segments of the Barium Sulphate Industry. Market.
By Type: Public Blockchain, Private Blockchain, Consortium Blockchain, Hybrid Blockchain
By Application: Digital Currency / Payments, Land Registration, Voting (Elections), Identity Management, Supply Chain Traceability, Healthcare, Corporate Registration, Taxation, Entitlements Management, Others
By Geography: By Geography: North America (US, Canada and Mexico), Europe (UK, France, Germany, Italy, Spain, Russia, Netherlands, Belgium, and Rest of Europe), APAC (China, Japan, India, South Korea, Australia and New Zealand, Indonesia, Taiwan, Malaysia and Rest of APAC), South America (Brazil, Argentina, Colombia, Chile, Rest of South America), and RoW (Middle East and Africa).
Key Takeaways
• Evaluate market potential through analyzing growth rates (CAGR %), Volume (Units) and Value ($M) data given at country level – for product types, end use applications and by different industry verticals.
• Understand the different dynamics influencing the market – key driving factors, challenges and hidden opportunities.
• Get in-depth insights on your competitor performance – market shares, strategies, financial benchmarking, product benchmarking, SWOT and more.
• Analyze the sales and distribution channels across key geographies to improve top-line revenues.
• Understand the industry supply chain with a deep-dive on the value augmentation at each step, in order to optimize value and bring efficiencies in your processes.
Blockchain in Government Market Segment Analysis - By Blend
B5 (up to 5% biodiesel) held the largest share of 48% in the Blockchain in Government Market in 2023. B5 and B20 are frequent blends because it signifies a decent balance of cost, emissions, cold-weather performance, materials compatibility, and competence to act as a solvent. Most biodiesel users purchase B20 or lower blends from their normal fuel suppliers or from Blockchain in Government Marketers. B20 and B5 are ASTM-approved for safe function in any compression-ignition engine originated to be operated on petroleum diesel. This can include light-duty and heavy-duty diesel cars and trucks, tractors, boats, and electrical generators. Biodiesel offers more greenhouse gas benefits than conventional diesel fuel. The emissions benefit is roughly commensurate with the blend level, that is, B20 would have 20% of the emissions reduction benefit of B100. Currently, the ethanol blending percentage in petrol is around 2.0% and the biodiesel blending percentage in diesel is less than 0.1%. As an indicative target, the government has approved 20% blending of ethanol in petrol and 5% blending of biodiesel in diesel is proposed by 2030. Additionally, on World Biofuel Day, the Food Safety and Standards Authority of India (FSSAI) launched RUCO – Repurpose Used Cooking Oil, an ecosystem that will enable the collection and conversion of used cooking oil to biodiesel.
The United States is one of the significant consumers of biodiesel. Some local, state, and federal government agencies use biodiesel blends (B20) with fleets of school and transit buses, snowplows, garbage trucks, mail trucks, and military vehicles. Fuelling stations that sell biodiesel blends of B20 or higher to the public are available in almost every state.
Blockchain in Government Market Segment Analysis - By Feedstock
The vegetable oils held the largest share of 98% of the Blockchain in Government Market. Vegetable oils such as rapeseed oil, soybean oil, and palm oil account for the largest share in the production of biodiesel. The fuel is useful to the environment as it lowers the effect of greenhouse gas by releasing lower Volatile Organic Compound (VOC) substances as compared to fossil diesel. The feedstock used in a particular country depends on the accessibility of crops in that country. For instance, rapeseed oil is presently the most popular feedstock used in biodiesel production, followed by soybean oil. Rapeseed oil is commonly used in many European countries, whereas soybean oil is consumed in the U.S and Coconut oil and palm oil is used in Malaysia and Indonesia.
The vegetable oil segment accounted for the largest share of more than 97.00% of the global revenue. However, raw material selection varies by region, based on the availability and feedstock cost. Palm oil is expected to be a major feedstock for the market and has been widely used in the production of biodiesel in countries, such as Indonesia, Thailand, Germany, France, and Colombia. vegetable oils, including UCO and rapeseed, held a notable share in the sector, representing over 17% of the overall feedstock demand. The primary markets for UCO-derived biodiesel in the Asia Pacific region, namely China and India, are anticipated to be pivotal. Nonetheless, manufacturers of UCOME (UCO-based biodiesel) in these areas have expressed apprehensions regarding product availability, which has dampened growth prospects
Blockchain in Government Market Segment Analysis - By Application
Transportation held the largest share of 52% in the Blockchain in Government Market in 2023. The scarcity of petroleum supplies will mark renewable energy resources further attractive. The most practical way to encounter this growing demand is by utilizing alternative fuels. Biodiesel is the top candidate for diesel fuels in diesel engines. The major advantage that biodiesel has over gasoline and petroleum diesel is its environmental friendliness. Biodiesel burns parallel to petroleum diesel as it matters regulated pollutants. On the other hand, biodiesel undoubtedly has improved efficiency than gasoline. One such fuel for compression-ignition engines that show great ability is biodiesel. Diesel fuel can also be replaced by biodiesel made from vegetable oils. Biodiesel is now mainly being produced from soybean, rapeseed, and palm oils.
In January 2023, the US Department of Energy (DOE) unveiled plans to allocate $118 million across 17 initiatives aimed at expediting the advancement of sustainable biofuels to meet the nation's transportation and manufacturing needs. These chosen projects are geared towards enhancing the domestic production of biofuels and bioproducts by advancing biorefinery development stages from pre-pilot to demonstration, thereby offering sustainable fuel options that reduce emissions linked with fossil fuels.
Blockchain in Government Market Segment Analysis - By End-Use Industry
Automotive dominates the Blockchain in Government Market growing at a CAGR of 5.2%. The escalating demands for biodiesel in the automotive industry are increasing due to the extreme pollution caused by automobile pollutants, which are the outcomes of petrol or diesel-based automobiles. As an alternative similar to gasoline and fossil diesel, biodiesel is an advanced form of biofuel. It is biodegradable, non-toxic, and has reduced exhaust emissions as compared to petroleum diesel fuel. Also, the lack of sulfur in 100% biodiesel extends the life of catalytic converters, and also the lubricating property of the biodiesel may lengthen the lifetime of engines. It is the only alternate fuel, which has been approved by the Environment Protection Agency (EPA). It has also passed every Health – Effects Test of the Clean Air Act and meets the necessities of the California Air Resources Board (CARB). Expanding demand for biodiesel to substitute traditional fossil fuel in automotive and power generation applications is likely to hustle industry growth.
Blockchain in Government Market Segment Analysis – Geography
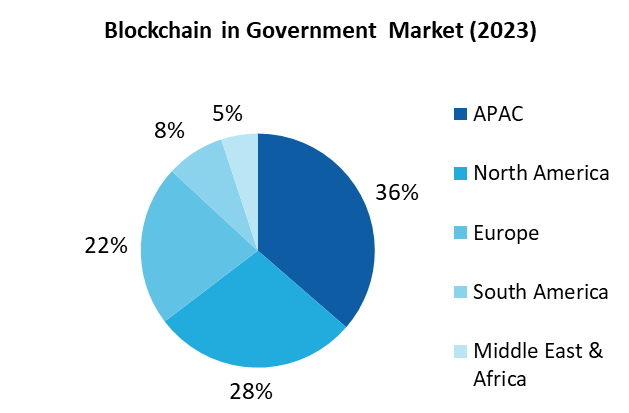
North America attained the highest growth of 42% market share in 2023, as governments in North America are increasingly conducting pilot projects and proof of concepts to explore the potential of blockchain technology. These initiatives allow governments to test the feasibility and benefits of blockchain in specific use cases before implementing them on a larger scale. Examples include blockchain-based voting trials and land registry experiments. Moreover, digital identity is a significant area of focus in the blockchain government market opportunities. However, Asia-Pacific is expected to exhibit the highest growth rate during the forecast period. This is attributed to the fact that digital identity solutions are gaining traction in Asia-Pacific, with governments exploring blockchain technology for secure and decentralized identity management systems. Blockchain-based identity solutions provide citizens with control over their personal data and enable seamless access to e-government services. Several countries in the region are implementing blockchain-based identity systems for various public services.
Blockchain in Government Market Share (%) By Region, 2023
. For More Details on This Report - Request for Sample
Drivers – Blockchain in Government Market
Enhanced Transparency and Accountability
Blockchain technology is revolutionizing the landscape of government operations by providing unparalleled transparency and accountability. With its immutable and transparent record-keeping capabilities, blockchain enables governments to instill trust and integrity in critical sectors such as public procurement, identity management, and voting systems. By leveraging blockchain, governments can create tamper-proof records of transactions and activities, ensuring that data remains secure and unalterable. This significantly reduces the risks of corruption, fraud, and inefficiencies, as every transaction is recorded on a decentralized ledger that is accessible to all authorized parties. As a result, blockchain not only enhances the credibility of government operations but also fosters greater public trust and confidence in the integrity of governmental processes.
Challenges –
Regulatory and Legal Hurdles
One of the significant challenges facing the adoption of blockchain in government is navigating the complex regulatory and legal landscape. Government agencies must grapple with existing regulations that may not be compatible with blockchain technology, as well as uncertainties surrounding the legal status of blockchain-based transactions, contracts, and digital assets. Addressing these regulatory and legal hurdles is essential for widespread adoption of blockchain in government applications.
Interoperability and Standards
The interoperability of blockchain networks and the lack of standardized protocols pose significant challenges for the adoption of blockchain in government. Different blockchain platforms may have varying technical specifications, governance models, and consensus mechanisms, making it difficult to seamlessly integrate disparate systems and share data across government agencies. Developing interoperability standards and protocols is crucial for ensuring the compatibility and scalability of blockchain solutions in government ecosystems.
Market Landscape
Blockchain in Government Market Segment Analysis Market Landscape
Technology launches, acquisitions and R&D activities are key strategies adopted by players in the Window Films Market. Major players in the Blockchain in Government Market are IBM Corp., SAP SE, Microsoft, Oracle, Deloitte, Amazon Web Services, Inc., Infosys, Auxesis Group, Intel Corporation, Accenture
For more Information and Communications Technology Market reports, please click here
1. Blockchain in Government Market - Overview
1.1. Definitions and Scope
2. Blockchain in Government Market - Executive Summary
3. Blockchain in Government Market - Comparative Analysis
3.1. Company Benchmarking - Key Companies
3.2. Global Financial Analysis - Key Companies
3.3. Market Share Analysis - Key Companies
3.4. Patent Analysis
3.5. Pricing Analysis
4.Blockchain in Government Market - Start-up Companies Scenario Premium
4.1. Key Start-up Company Analysis by
4.1.1. Investment
4.1.2. Revenue
4.1.3. Venture Capital and Funding Scenario
5. Blockchain in Government Market – Market Entry Scenario Premium Premium
5.1. Regulatory Framework Overview
5.2. New Business and Ease of Doing Business Index
5.3. Case Studies of Successful Ventures
6. Blockchain in Government Market - Forces
6.1. Market Drivers
6.2. Market Constraints
6.3. Market Challenges
6.4. Porter's Five Force Model
6.4.1. Bargaining Power of Suppliers
6.4.2. Bargaining Powers of Customers
6.4.3. Threat of New Entrants
6.4.4. Rivalry Among Existing Players
6.4.5. Threat of Substitutes
7. Blockchain in Government Market – Strategic Analysis
7.1. Value Chain Analysis
7.2. Opportunities Analysis
7.3. Market Life Cycle
7.4. Suppliers and distributors Analysis
8. Blockchain in Government Market – by Type (Market Size – $Million/$Billion)
8.1. Public Blockchain
8.2. Private Blockchain
8.3. Consortium Blockchain
8.4. Hybrid Blockchain
9. Blockchain in Government Market – by Application (Market Size – $Million/$Billion)
9.1 Digital Currency/ Payments
9.2 Land Registration
9.3 Voting (Elections)
9.4 Identity Management
9.5 Supply Chain Traceability
9.6 Healthcare
9.7 Corporate Registration
9.8 Taxation
9.9 Entitlements Management
9.10 Others
10. Blockchain in Government Market – by Geography (Market Size – $Million/$Billion)
10.1 North America
10.1.1 Canada
10.1.2 Mexico
10.1.3 U.S
10.2 Europe
10.2.1 U.K
10.2.2 Germany
10.2.3 France
10.2.4 Italy
10.2.5 Netherlands
10.2.6 Belgium
10.2.7 Spain
10.2.8 Russia
10.2.9 Others
10.3 Asia-Pacific
10.3.1 China
10.3.2 India
10.3.3 Japan
10.3.4 South Korea
10.3.5 Indonesia
10.3.6 Malaysia
10.3.7 Australia & New Zealand
10.3.8 Others
10.4 South America
10.4.1 Argentina
10.4.2 Brazil
10.4.3 Chile
10.4.4 Colombia
10.4.5 Rest of South America
10.5 Rest of The World
10.5.1 Africa
10.5.2 Middle East
11 Blockchain in Government Market – Entropy
11.1 New product launches
11.2 M&A’s, collaborations, JVs and partnerships
12 Blockchain in Government Market – Industry/Segment Competition Landscape Premium
12.1 Market Share Analysis
12.1.1 Market Share by Product Type – Key Companies
12.1.2 Market Share by Region – Key Companies
12.1.3 Market Share by Country – Key Companies
12.2 Competition Matrix
12.3 Best Practices for Companies
13 Blockchain in Government Market – Key Company List by Country Premium Premium
14 Blockchain in Government Market - Company Analysis
14.1 IBM Corp.
14.2 SAP SE
14.3 Microsoft
14.4 Oracle
14.5 Deloitte
14.6 Amazon Web Services, Inc.
14.7 Infosys
14.8 Auxesis Group
14.9 Intel Corporation
14.10 Accenture
"Financials to the Private Companies would be provided on best-effort basis."
List of Tables
Table 1: Blockchain Market in Government Overview 2023-2030
Table 2: Blockchain Market in Government Leader Analysis 2023-2030 (US$)
Table 3: Blockchain Market in GovernmentProduct Analysis 2023-2030 (US$)
Table 4: Blockchain Market in GovernmentEnd User Analysis 2023-2030 (US$)
Table 5: Blockchain Market in GovernmentPatent Analysis 2013-2023* (US$)
Table 6: Blockchain Market in GovernmentFinancial Analysis 2023-2030 (US$)
Table 7: Blockchain Market in Government Driver Analysis 2023-2030 (US$)
Table 8: Blockchain Market in GovernmentChallenges Analysis 2023-2030 (US$)
Table 9: Blockchain Market in GovernmentConstraint Analysis 2023-2030 (US$)
Table 10: Blockchain Market in Government Supplier Bargaining Power Analysis 2023-2030 (US$)
Table 11: Blockchain Market in Government Buyer Bargaining Power Analysis 2023-2030 (US$)
Table 12: Blockchain Market in Government Threat of Substitutes Analysis 2023-2030 (US$)
Table 13: Blockchain Market in Government Threat of New Entrants Analysis 2023-2030 (US$)
Table 14: Blockchain Market in Government Degree of Competition Analysis 2023-2030 (US$)
Table 15: Blockchain Market in GovernmentValue Chain Analysis 2023-2030 (US$)
Table 16: Blockchain Market in GovernmentPricing Analysis 2023-2030 (US$)
Table 17: Blockchain Market in GovernmentOpportunities Analysis 2023-2030 (US$)
Table 18: Blockchain Market in GovernmentProduct Life Cycle Analysis 2023-2030 (US$)
Table 19: Blockchain Market in GovernmentSupplier Analysis 2023-2030 (US$)
Table 20: Blockchain Market in GovernmentDistributor Analysis 2023-2030 (US$)
Table 21: Blockchain Market in Government Trend Analysis 2023-2030 (US$)
Table 22: Blockchain Market in Government Size 2023 (US$)
Table 23: Blockchain Market in Government Forecast Analysis 2023-2030 (US$)
Table 24: Blockchain Market in Government Sales Forecast Analysis 2023-2030 (Units)
Table 25: Blockchain Market in Government, Revenue & Volume, By Type, 2023-2030 ($)
Table 26: Blockchain Market in GovernmentBy Type, Revenue & Volume, By Public Blockchain, 2023-2030 ($)
Table 27: Blockchain Market in GovernmentBy Type, Revenue & Volume, By Private Blockchain, 2023-2030 ($)
Table 28: Blockchain Market in GovernmentBy Type, Revenue & Volume, By Consortium Blockchain, 2023-2030 ($)
Table 29: Blockchain Market in Government, Revenue & Volume, By Application, 2023-2030 ($)
Table 30: Blockchain Market in GovernmentBy Application, Revenue & Volume, By Smart Contracts, 2023-2030 ($)
Table 31: Blockchain Market in GovernmentBy Application, Revenue & Volume, By Payments Systems, 2023-2030 ($)
Table 32: Blockchain Market in GovernmentBy Application, Revenue & Volume, By Voting, 2023-2030 ($)
Table 33: Blockchain Market in GovernmentBy Application, Revenue & Volume, By Land and other Assets registry, 2023-2030 ($)
Table 34: Blockchain Market in GovernmentBy Application, Revenue & Volume, By Digital Identity, 2023-2030 ($)
Table 35: North America Blockchain Market in Government, Revenue & Volume, By Type, 2023-2030 ($)
Table 36: North America Blockchain Market in Government, Revenue & Volume, By Application, 2023-2030 ($)
Table 37: South america Blockchain Market in Government, Revenue & Volume, By Type, 2023-2030 ($)
Table 38: South america Blockchain Market in Government, Revenue & Volume, By Application, 2023-2030 ($)
Table 39: Europe Blockchain Market in Government, Revenue & Volume, By Type, 2023-2030 ($)
Table 40: Europe Blockchain Market in Government, Revenue & Volume, By Application, 2023-2030 ($)
Table 41: APAC Blockchain Market in Government, Revenue & Volume, By Type, 2023-2030 ($)
Table 42: APAC Blockchain Market in Government, Revenue & Volume, By Application, 2023-2030 ($)
Table 43: Middle East & Africa Blockchain Market in Government, Revenue & Volume, By Type, 2023-2030 ($)
Table 44: Middle East & Africa Blockchain Market in Government, Revenue & Volume, By Application, 2023-2030 ($)
Table 45: Russia Blockchain Market in Government, Revenue & Volume, By Type, 2023-2030 ($)
Table 46: Russia Blockchain Market in Government, Revenue & Volume, By Application, 2023-2030 ($)
Table 47: Israel Blockchain Market in Government, Revenue & Volume, By Type, 2023-2030 ($)
Table 48: Israel Blockchain Market in Government, Revenue & Volume, By Application, 2023-2030 ($)
Table 49: Top Companies 2023 (US$)Blockchain Market in Government, Revenue & Volume
Table 50: Product Launch 2023-2030Blockchain Market in Government, Revenue & Volume
Table 51: Mergers & Acquistions 2023-2030Blockchain Market in Government, Revenue & Volume
List of Figures
Figure 1: Overview of Blockchain Market in Government 2023-2030
Figure 2: Market Share Analysis for Blockchain Market in Government 2023 (US$)
Figure 3: Product Comparison in Blockchain Market in Government 2023-2030 (US$)
Figure 4: End User Profile for Blockchain Market in Government 2023-2030 (US$)
Figure 5: Patent Application and Grant in Blockchain Market in Government 2013-2023* (US$)
Figure 6: Top 5 Companies Financial Analysis in Blockchain Market in Government 2023-2030 (US$)
Figure 7: Market Entry Strategy in Blockchain Market in Government 2023-2030
Figure 8: Ecosystem Analysis in Blockchain Market in Government2023
Figure 9: Average Selling Price in Blockchain Market in Government 2023-2030
Figure 10: Top Opportunites in Blockchain Market in Government 2023-2030
Figure 11: Market Life Cycle Analysis in Blockchain Market in Government
Figure 12: GlobalBy TypeBlockchain Market in Government Revenue, 2023-2030 ($)
Figure 13: GlobalBy ApplicationBlockchain Market in Government Revenue, 2023-2030 ($)
Figure 14: Global Blockchain Market in Government - By Geography
Figure 15: Global Blockchain Market in Government Value & Volume, By Geography, 2023-2030 ($)
Figure 16: Global Blockchain Market in Government CAGR, By Geography, 2023-2030 (%)
Figure 17: North America Blockchain Market in Government Value & Volume, 2023-2030 ($)
Figure 18: US Blockchain Market in Government Value & Volume, 2023-2030 ($)
Figure 19: US GDP and Population, 2023-2030 ($)
Figure 20: US GDP – Composition of 2023, By Sector of Origin
Figure 21: US Export and Import Value & Volume, 2023-2030 ($)
Figure 22: Canada Blockchain Market in Government Value & Volume, 2023-2030 ($)
Figure 23: Canada GDP and Population, 2023-2030 ($)
Figure 24: Canada GDP – Composition of 2023, By Sector of Origin
Figure 25: Canada Export and Import Value & Volume, 2023-2030 ($)
Figure 26: Mexico Blockchain Market in Government Value & Volume, 2023-2030 ($)
Figure 27: Mexico GDP and Population, 2023-2030 ($)
Figure 28: Mexico GDP – Composition of 2023, By Sector of Origin
Figure 29: Mexico Export and Import Value & Volume, 2023-2030 ($)
Figure 30: South America Blockchain Market in GovernmentValue & Volume, 2023-2030 ($)
Figure 31: Brazil Blockchain Market in Government Value & Volume, 2023-2030 ($)
Figure 32: Brazil GDP and Population, 2023-2030 ($)
Figure 33: Brazil GDP – Composition of 2023, By Sector of Origin
Figure 34: Brazil Export and Import Value & Volume, 2023-2030 ($)
Figure 35: Venezuela Blockchain Market in Government Value & Volume, 2023-2030 ($)
Figure 36: Venezuela GDP and Population, 2023-2030 ($)
Figure 37: Venezuela GDP – Composition of 2023, By Sector of Origin
Figure 38: Venezuela Export and Import Value & Volume, 2023-2030 ($)
Figure 39: Argentina Blockchain Market in Government Value & Volume, 2023-2030 ($)
Figure 40: Argentina GDP and Population, 2023-2030 ($)
Figure 41: Argentina GDP – Composition of 2023, By Sector of Origin
Figure 42: Argentina Export and Import Value & Volume, 2023-2030 ($)
Figure 43: Ecuador Blockchain Market in Government Value & Volume, 2023-2030 ($)
Figure 44: Ecuador GDP and Population, 2023-2030 ($)
Figure 45: Ecuador GDP – Composition of 2023, By Sector of Origin
Figure 46: Ecuador Export and Import Value & Volume, 2023-2030 ($)
Figure 47: Peru Blockchain Market in Government Value & Volume, 2023-2030 ($)
Figure 48: Peru GDP and Population, 2023-2030 ($)
Figure 49: Peru GDP – Composition of 2023, By Sector of Origin
Figure 50: Peru Export and Import Value & Volume, 2023-2030 ($)
Figure 51: Colombia Blockchain Market in Government Value & Volume, 2023-2030 ($)
Figure 52: Colombia GDP and Population, 2023-2030 ($)
Figure 53: Colombia GDP – Composition of 2023, By Sector of Origin
Figure 54: Colombia Export and Import Value & Volume, 2023-2030 ($)
Figure 55: Costa Rica Blockchain Market in Government Value & Volume, 2023-2030 ($)
Figure 56: Costa Rica GDP and Population, 2023-2030 ($)
Figure 57: Costa Rica GDP – Composition of 2023, By Sector of Origin
Figure 58: Costa Rica Export and Import Value & Volume, 2023-2030 ($)
Figure 59: Europe Blockchain Market in Government Value & Volume, 2023-2030 ($)
Figure 60: U.K Blockchain Market in Government Value & Volume, 2023-2030 ($)
Figure 61: U.K GDP and Population, 2023-2030 ($)
Figure 62: U.K GDP – Composition of 2023, By Sector of Origin
Figure 63: U.K Export and Import Value & Volume, 2023-2030 ($)
Figure 64: Germany Blockchain Market in Government Value & Volume, 2023-2030 ($)
Figure 65: Germany GDP and Population, 2023-2030 ($)
Figure 66: Germany GDP – Composition of 2023, By Sector of Origin
Figure 67: Germany Export and Import Value & Volume, 2023-2030 ($)
Figure 68: Italy Blockchain Market in Government Value & Volume, 2023-2030 ($)
Figure 69: Italy GDP and Population, 2023-2030 ($)
Figure 70: Italy GDP – Composition of 2023, By Sector of Origin
Figure 71: Italy Export and Import Value & Volume, 2023-2030 ($)
Figure 72: France Blockchain Market in Government Value & Volume, 2023-2030 ($)
Figure 73: France GDP and Population, 2023-2030 ($)
Figure 74: France GDP – Composition of 2023, By Sector of Origin
Figure 75: France Export and Import Value & Volume, 2023-2030 ($)
Figure 76: Netherlands Blockchain Market in Government Value & Volume, 2023-2030 ($)
Figure 77: Netherlands GDP and Population, 2023-2030 ($)
Figure 78: Netherlands GDP – Composition of 2023, By Sector of Origin
Figure 79: Netherlands Export and Import Value & Volume, 2023-2030 ($)
Figure 80: Belgium Blockchain Market in Government Value & Volume, 2023-2030 ($)
Figure 81: Belgium GDP and Population, 2023-2030 ($)
Figure 82: Belgium GDP – Composition of 2023, By Sector of Origin
Figure 83: Belgium Export and Import Value & Volume, 2023-2030 ($)
Figure 84: Spain Blockchain Market in Government Value & Volume, 2023-2030 ($)
Figure 85: Spain GDP and Population, 2023-2030 ($)
Figure 86: Spain GDP – Composition of 2023, By Sector of Origin
Figure 87: Spain Export and Import Value & Volume, 2023-2030 ($)
Figure 88: Denmark Blockchain Market in Government Value & Volume, 2023-2030 ($)
Figure 89: Denmark GDP and Population, 2023-2030 ($)
Figure 90: Denmark GDP – Composition of 2023, By Sector of Origin
Figure 91: Denmark Export and Import Value & Volume, 2023-2030 ($)
Figure 92: APAC Blockchain Market in Government Value & Volume, 2023-2030 ($)
Figure 93: China Blockchain Market in GovernmentValue & Volume, 2023-2030
Figure 94: China GDP and Population, 2023-2030 ($)
Figure 95: China GDP – Composition of 2023, By Sector of Origin
Figure 96: China Export and Import Value & Volume, 2023-2030 ($)Blockchain Market in GovernmentChina Export and Import Value & Volume, 2023-2030 ($)
Figure 97: Australia Blockchain Market in Government Value & Volume, 2023-2030 ($)
Figure 98: Australia GDP and Population, 2023-2030 ($)
Figure 99: Australia GDP – Composition of 2023, By Sector of Origin
Figure 100: Australia Export and Import Value & Volume, 2023-2030 ($)
Figure 101: South Korea Blockchain Market in Government Value & Volume, 2023-2030 ($)
Figure 102: South Korea GDP and Population, 2023-2030 ($)
Figure 103: South Korea GDP – Composition of 2023, By Sector of Origin
Figure 104: South Korea Export and Import Value & Volume, 2023-2030 ($)
Figure 105: India Blockchain Market in Government Value & Volume, 2023-2030 ($)
Figure 106: India GDP and Population, 2023-2030 ($)
Figure 107: India GDP – Composition of 2023, By Sector of Origin
Figure 108: India Export and Import Value & Volume, 2023-2030 ($)
Figure 109: Taiwan Blockchain Market in Government Value & Volume, 2023-2030 ($)
Figure 110: Taiwan GDP and Population, 2023-2030 ($)
Figure 111: Taiwan GDP – Composition of 2023, By Sector of Origin
Figure 112: Taiwan Export and Import Value & Volume, 2023-2030 ($)
Figure 113: Malaysia Blockchain Market in Government Value & Volume, 2023-2030 ($)
Figure 114: Malaysia GDP and Population, 2023-2030 ($)
Figure 115: Malaysia GDP – Composition of 2023, By Sector of Origin
Figure 116: Malaysia Export and Import Value & Volume, 2023-2030 ($)
Figure 117: Hong Kong Blockchain Market in Government Value & Volume, 2023-2030 ($)
Figure 118: Hong Kong GDP and Population, 2023-2030 ($)
Figure 119: Hong Kong GDP – Composition of 2023, By Sector of Origin
Figure 120: Hong Kong Export and Import Value & Volume, 2023-2030 ($)
Figure 121: Middle East & Africa Blockchain Market in GovernmentMiddle East & Africa 3D Printing Market Value & Volume, 2023-2030 ($)
Figure 122: Russia Blockchain Market in Government Value & Volume, 2023-2030 ($)
Figure 123: Russia GDP and Population, 2023-2030 ($)
Figure 124: Russia GDP – Composition of 2023, By Sector of Origin
Figure 125: Russia Export and Import Value & Volume, 2023-2030 ($)
Figure 126: Israel Blockchain Market in Government Value & Volume, 2023-2030 ($)
Figure 127: Israel GDP and Population, 2023-2030 ($)
Figure 128: Israel GDP – Composition of 2023, By Sector of Origin
Figure 129: Israel Export and Import Value & Volume, 2023-2030 ($)
Figure 130: Entropy Share, By Strategies, 2023-2030* (%)Blockchain Market in Government
Figure 131: Developments, 2023-2030*Blockchain Market in Government
Figure 132: Company 1 Blockchain Market in Government Net Revenue, By Years, 2023-2030* ($)
Figure 133: Company 1 Blockchain Market in Government Net Revenue Share, By Business segments, 2023 (%)
Figure 134: Company 1 Blockchain Market in Government Net Sales Share, By Geography, 2023 (%)
Figure 135: Company 2 Blockchain Market in Government Net Revenue, By Years, 2023-2030* ($)
Figure 136: Company 2 Blockchain Market in Government Net Revenue Share, By Business segments, 2023 (%)
Figure 137: Company 2 Blockchain Market in Government Net Sales Share, By Geography, 2023 (%)
Figure 138: Company 3 Blockchain Market in Government Net Revenue, By Years, 2023-2030* ($)
Figure 139: Company 3 Blockchain Market in Government Net Revenue Share, By Business segments, 2023 (%)
Figure 140: Company 3 Blockchain Market in Government Net Sales Share, By Geography, 2023 (%)
Figure 141: Company 4 Blockchain Market in Government Net Revenue, By Years, 2023-2030* ($)
Figure 142: Company 4 Blockchain Market in Government Net Revenue Share, By Business segments, 2023 (%)
Figure 143: Company 4 Blockchain Market in Government Net Sales Share, By Geography, 2023 (%)
Figure 144: Company 5 Blockchain Market in Government Net Revenue, By Years, 2023-2030* ($)
Figure 145: Company 5 Blockchain Market in Government Net Revenue Share, By Business segments, 2023 (%)
Figure 146: Company 5 Blockchain Market in Government Net Sales Share, By Geography, 2023 (%)
Figure 147: Company 6 Blockchain Market in Government Net Revenue, By Years, 2023-2030* ($)
Figure 148: Company 6 Blockchain Market in Government Net Revenue Share, By Business segments, 2023 (%)
Figure 149: Company 6 Blockchain Market in Government Net Sales Share, By Geography, 2023 (%)
Figure 150: Company 7 Blockchain Market in Government Net Revenue, By Years, 2023-2030* ($)
Figure 151: Company 7 Blockchain Market in Government Net Revenue Share, By Business segments, 2023 (%)
Figure 152: Company 7 Blockchain Market in Government Net Sales Share, By Geography, 2023 (%)
Figure 153: Company 8 Blockchain Market in Government Net Revenue, By Years, 2023-2030* ($)
Figure 154: Company 8 Blockchain Market in Government Net Revenue Share, By Business segments, 2023 (%)
Figure 155: Company 8 Blockchain Market in Government Net Sales Share, By Geography, 2023 (%)
Figure 156: Company 9 Blockchain Market in Government Net Revenue, By Years, 2023-2030* ($)
Figure 157: Company 9 Blockchain Market in Government Net Revenue Share, By Business segments, 2023 (%)
Figure 158: Company 9 Blockchain Market in Government Net Sales Share, By Geography, 2023 (%)
Figure 159: Company 10 Blockchain Market in Government Net Revenue, By Years, 2023-2030* ($)
Figure 160: Company 10 Blockchain Market in Government Net Revenue Share, By Business segments, 2023 (%)
Figure 161: Company 10 Blockchain Market in Government Net Sales Share, By Geography, 2023 (%)
Figure 162: Company 11 Blockchain Market in Government Net Revenue, By Years, 2023-2030* ($)
Figure 163: Company 11 Blockchain Market in Government Net Revenue Share, By Business segments, 2023 (%)
Figure 164: Company 11 Blockchain Market in Government Net Sales Share, By Geography, 2023 (%)
Figure 165: Company 12 Blockchain Market in Government Net Revenue, By Years, 2023-2030* ($)
Figure 166: Company 12 Blockchain Market in Government Net Revenue Share, By Business segments, 2023 (%)
Figure 167: Company 12 Blockchain Market in Government Net Sales Share, By Geography, 2023 (%)
Figure 168: Company 13 Blockchain Market in Government Net Revenue, By Years, 2023-2030* ($)
Figure 169: Company 13 Blockchain Market in Government Net Revenue Share, By Business segments, 2023 (%)
Figure 170: Company 13 Blockchain Market in Government Net Sales Share, By Geography, 2023 (%)
Figure 171: Company 14 Blockchain Market in Government Net Revenue, By Years, 2023-2030* ($)
Figure 172: Company 14 Blockchain Market in Government Net Revenue Share, By Business segments, 2023 (%)
Figure 173: Company 14 Blockchain Market in Government Net Sales Share, By Geography, 2023 (%)
Figure 174: Company 15 Blockchain Market in Government Net Revenue, By Years, 2023-2030* ($)
Figure 175: Company 15 Blockchain Market in Government Net Revenue Share, By Business segments, 2023 (%)
Figure 176: Company 15 Blockchain Market in Government Net Sales Share, By Geography, 2023 (%)