 Email
Email Print
Print


Pasta is one of those comfort foods available in a multitude of shapes and made from wheat, rice, corn, beans, and a host of lesser known grains and vegetables. Pasta is a well know sources of carbohydrates. Fresh, frozen and fast pastas are available along with the dried pasta which has a little difference in flavor, nutrition and texture, though fresh pasta does cook faster. For people who are allergic to wheat has an excellent alternative pasta made from plants other than wheat. These pastas have their own nutritional pluses aside from their lack of gluten. Depending upon the source, some types of non-wheat pasta are rich in protein, such as brown rice pasta. Each type offers its own nutritional and culinary merits. The growing awareness about benefits of alternate pastas, demand for new flavors, types and nutritional pastas is set to drive the alternative pasta market during the forecast period.
This report identifies the alternative pasta market size for the year 2016, and forecast the same for year 2023. It also highlights the potential growth opportunities in the coming years, while also reviewing the market drivers, restraints, growth indicators, challenges, market dynamics, competitive landscape, and other key aspects with respect to alternative pasta market.
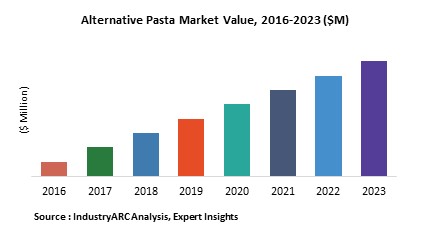
Geographically, Asia-Pacific dominated Alternative pasta market, North America and Europe are the second and third largest markets respectively. Asia-Pacific is estimated to remain fastest growing regional market during the period of study. Pasta is a staple food in traditional Italy and is strongly influencing traditions in Japan and Southeast Asian countries, including Thailand and Vietnam.
This report segments Alternative pasta market based on type, distribution channel and geography. Based on type it is segmented as durum semolina pasta, gluten-free pasta, spelt pasta, ravioli pasta and Others. This report on Alternative pasta also covers in detail about various distribution channels of alternative pasta which includes hypermarket/supermarket, convenience store, specialty food stores, small grocery stores, online stores and others
This report on Alternative pasta has been further segmented into major regions such as North America, Europe, Asia-Pacific (APAC), and Rest of the World (RoW) covering all the major country level markets in each of the region.
Sample Companies Profiled in this Report are:
- Barilla Holding S.p.A. (Italy),
- Ralcorp Holdings Inc. (U.S.),
- Grupo Ebro Puleva SA (Spain),
- 10+.
1. Alternative Pasta Market - Overview
1.1. Definitions and Scope
2. Alternative Pasta Market - Executive summary
2.1. Market Revenue, Market Size and Key Trends by Company
2.2. Key Trends by type of Application
2.3. Key Trends segmented by Geography
3. Alternative Pasta Market
3.1. Comparative analysis
3.1.1. Product Benchmarking - Top 10 companies
3.1.2. Top 5 Financials Analysis
3.1.3. Market Value split by Top 10 companies
3.1.4. Patent Analysis - Top 10 companies
3.1.5. Pricing Analysis
4. Alternative Pasta Market – Startup companies Scenario Premium
4.1. Top 10 startup company Analysis by
4.1.1. Investment
4.1.2. Revenue
4.1.3. Market Shares
4.1.4. Market Size and Application Analysis
4.1.5. Venture Capital and Funding Scenario
5. Alternative Pasta Market – Industry Market Entry Scenario Premium
5.1. Regulatory Framework Overview
5.2. New Business and Ease of Doing business index
5.3. Case studies of successful ventures
5.4. Customer Analysis – Top 10 companies
6. Alternative Pasta Market Forces
6.1. Drivers
6.2. Constraints
6.3. Challenges
6.4. Porters five force model
6.4.1. Bargaining power of suppliers
6.4.2. Bargaining powers of customers
6.4.3. Threat of new entrants
6.4.4. Rivalry among existing players
6.4.5. Threat of substitutes
7. Alternative Pasta Market - Strategic analysis
7.1. Value chain analysis
7.2. Opportunities analysis
7.3. Product life cycle
7.4. Suppliers and distributors Market Share
8. Alternative Pasta Market – By Distribution Channel (Market Size -$Million / $Billion)
8.1. Market Size and Market Share Analysis
8.2. Application Revenue and Trend Research
8.3. Product Segment Analysis
8.3.1. Introduction
8.3.2. Hypermarket/Supermarket
8.3.3. Convenience Store
8.3.4. Specialty Food Stores
8.3.5. Small Grocery Stores
8.3.6. Online Stores
8.3.7. Others
9. Alternative Pasta Market – By Type (Market Size -$Million / $Billion)
9.1. Introduction
9.2. Durum Semolina Pasta
9.3. Gluten-Free Pasta
9.3.1. Quinoa Pasta
9.3.2. Corn Pasta
9.3.3. Brown Rice Pasta
9.3.4. Soybean Pasta
9.3.5. Others
9.4. Spelt Pasta
9.5. Ravioli Pasta
9.6. Others
10. Alternative Pasta - By Geography (Market Size -$Million / $Billion)
10.1. Alternative Pasta Market - North America Segment Research
10.2. North America Market Research (Million / $Billion)
10.2.1. Segment type Size and Market Size Analysis
10.2.2. Revenue and Trends
10.2.3. Application Revenue and Trends by type of Application
10.2.4. Company Revenue and Product Analysis
10.2.5. North America Product type and Application Market Size
10.2.5.1. U.S.
10.2.5.2. Canada
10.2.5.3. Mexico
10.2.5.4. Rest of North America
10.3. Alternative Pasta - South America Segment Research
10.4. South America Market Research (Market Size -$Million / $Billion)
10.4.1. Segment type Size and Market Size Analysis
10.4.2. Revenue and Trends
10.4.3. Application Revenue and Trends by type of Application
10.4.4. Company Revenue and Product Analysis
10.4.5. South America Product type and Application Market Size
10.4.5.1. Brazil
10.4.5.2. Venezuela
10.4.5.3. Argentina
10.4.5.4. Ecuador
10.4.5.5. Peru
10.4.5.6. Colombia
10.4.5.7. Costa Rica
10.4.5.8. Rest of South America
10.5. Alternative Pasta - Europe Segment Research
10.6. Europe Market Research (Market Size -$Million / $Billion)
10.6.1. Segment type Size and Market Size Analysis
10.6.2. Revenue and Trends
10.6.3. Application Revenue and Trends by type of Application
10.6.4. Company Revenue and Product Analysis
10.6.5. Europe Segment Product type and Application Market Size
10.6.5.1. U.K
10.6.5.2. Germany
10.6.5.3. Italy
10.6.5.4. France
10.6.5.5. Netherlands
10.6.5.6. Belgium
10.6.5.7. Spain
10.6.5.8. Denmark
10.6.5.9. Rest of Europe
10.7. Alternative Pasta – APAC Segment Research
10.8. APAC Market Research (Market Size -$Million / $Billion)
10.8.1. Segment type Size and Market Size Analysis
10.8.2. Revenue and Trends
10.8.3. Application Revenue and Trends by type of Application
10.8.4. Company Revenue and Product Analysis
10.8.5. APAC Segment – Product type and Application Market Size
10.8.5.1. China
10.8.5.2. Australia
10.8.5.3. Japan
10.8.5.4. South Korea
10.8.5.5. India
10.8.5.6. Taiwan
10.8.5.7. Malaysia
11. Alternative Pasta Market - Entropy
11.1. New product launches
11.2. M&A's, collaborations, JVs and partnerships
112. Alternative Pasta Market – Industry / Segment Competition landscape Premium
112.1. Market Share Analysis
112.1.1. Market Share by Country- Top companies
112.1.2. Market Share by Region- Top 10 companies
112.1.12. Market Share by type of Application – Top 10 companies
112.1.4. Market Share by type of Product / Product category- Top 10 companies
112.1.5. Market Share at global level- Top 10 companies
112.1.6. Best Practises for companies
13. Alternative Pasta Market – Key Company List by Country Premium
14. Alternative Pasta Market Company Analysis
14.1. Market Share, Company Revenue, Products, M&A, Developments
14.2. Barilla Holding S.p.A. (Italy),
14.3. Ralcorp Holdings Inc. (U.S.),
14.4. Grupo Ebro Puleva SA (Spain),
14.5. Company 4
14.6. Company 5
14.7. Company 6
14.8. Company 7
14.9. Company 8
14.10. Company 9
14.11. Company 10 and more
"*Financials would be provided on a best efforts basis for private companies"
15. Alternative Pasta Market - Appendix
15.1. Abbreviations
15.2. Sources
16. Alternative Pasta Market - Methodology
16.1. Research Methodology
16.1.1. Company Expert Interviews
16.1.2. Industry Databases
16.1.3. Associations
16.1.4. Company News
16.1.5. Company Annual Reports
16.1.6. Application Trends
16.1.7. New Products and Product database
16.1.8. Company Transcripts
16.1.9. R&D Trends
16.1.10. Key Opinion Leaders Interviews
16.1.11. Supply and Demand Trends
List of Tables
Table 1 : Alternative Pasta Market Overview 2023-2030
Table 2 : Alternative Pasta Market Leader Analysis 2023-2030 (US$)
Table 3 : Alternative Pasta Market Product Analysis 2023-2030 (US$)
Table 4 : Alternative Pasta Market End User Analysis 2023-2030 (US$)
Table 5 : Alternative Pasta Market Patent Analysis 2013-2023* (US$)
Table 6 : Alternative Pasta Market Financial Analysis 2023-2030 (US$)
Table 7 : Alternative Pasta Market Driver Analysis 2023-2030 (US$)
Table 8 : Alternative Pasta Market Challenges Analysis 2023-2030 (US$)
Table 9 : Alternative Pasta Market Constraint Analysis 2023-2030 (US$)
Table 10 : Alternative Pasta Market Supplier Bargaining Power Analysis 2023-2030 (US$)
Table 11 : Alternative Pasta Market Buyer Bargaining Power Analysis 2023-2030 (US$)
Table 12 : Alternative Pasta Market Threat of Substitutes Analysis 2023-2030 (US$)
Table 13 : Alternative Pasta Market Threat of New Entrants Analysis 2023-2030 (US$)
Table 14 : Alternative Pasta Market Degree of Competition Analysis 2023-2030 (US$)
Table 15 : Alternative Pasta Market Value Chain Analysis 2023-2030 (US$)
Table 16 : Alternative Pasta Market Pricing Analysis 2023-2030 (US$)
Table 17 : Alternative Pasta Market Opportunities Analysis 2023-2030 (US$)
Table 18 : Alternative Pasta Market Product Life Cycle Analysis 2023-2030 (US$)
Table 19 : Alternative Pasta Market Supplier Analysis 2023-2030 (US$)
Table 20 : Alternative Pasta Market Distributor Analysis 2023-2030 (US$)
Table 21 : Alternative Pasta Market Trend Analysis 2023-2030 (US$)
Table 22 : Alternative Pasta Market Size 2023 (US$)
Table 23 : Alternative Pasta Market Forecast Analysis 2023-2030 (US$)
Table 24 : Alternative Pasta Market Sales Forecast Analysis 2023-2030 (Units)
Table 25 : Alternative Pasta Market, Revenue & Volume,By Type, 2023-2030 ($)
Table 26 : Alternative Pasta Market By Type, Revenue & Volume,By Durum Semolina Pasta, 2023-2030 ($)
Table 27 : Alternative Pasta Market By Type, Revenue & Volume,By Gluten-Free Pasta, 2023-2030 ($)
Table 28 : Alternative Pasta Market By Type, Revenue & Volume,By Spelt Pasta, 2023-2030 ($)
Table 29 : Alternative Pasta Market By Type, Revenue & Volume,By Ravioli Pasta, 2023-2030 ($)
Table 30 : Alternative Pasta Market, Revenue & Volume,By Distribution Channel, 2023-2030 ($)
Table 31 : Alternative Pasta Market By Distribution Channel, Revenue & Volume,By HyperMarket /SuperMarket, 2023-2030 ($)
Table 32 : Alternative Pasta Market By Distribution Channel, Revenue & Volume,By Convenience Store, 2023-2030 ($)
Table 33 : Alternative Pasta Market By Distribution Channel, Revenue & Volume,By Specialty Food Stores, 2023-2030 ($)
Table 34 : Alternative Pasta Market By Distribution Channel, Revenue & Volume,By Small Grocery Stores, 2023-2030 ($)
Table 35 : Alternative Pasta Market By Distribution Channel, Revenue & Volume,By Online Stores, 2023-2030 ($)
Table 36 : North America Alternative Pasta Market, Revenue & Volume,By Type, 2023-2030 ($)
Table 37 : North America Alternative Pasta Market, Revenue & Volume,By Distribution Channel, 2023-2030 ($)
Table 38 : South america Alternative Pasta Market, Revenue & Volume,By Type, 2023-2030 ($)
Table 39 : South america Alternative Pasta Market, Revenue & Volume,By Distribution Channel, 2023-2030 ($)
Table 40 : Europe Alternative Pasta Market, Revenue & Volume,By Type, 2023-2030 ($)
Table 41 : Europe Alternative Pasta Market, Revenue & Volume,By Distribution Channel, 2023-2030 ($)
Table 42 : APAC Alternative Pasta Market, Revenue & Volume,By Type, 2023-2030 ($)
Table 43 : APAC Alternative Pasta Market, Revenue & Volume,By Distribution Channel, 2023-2030 ($)
Table 44 : Middle East & Africa Alternative Pasta Market, Revenue & Volume,By Type, 2023-2030 ($)
Table 45 : Middle East & Africa Alternative Pasta Market, Revenue & Volume,By Distribution Channel, 2023-2030 ($)
Table 46 : Russia Alternative Pasta Market, Revenue & Volume,By Type, 2023-2030 ($)
Table 47 : Russia Alternative Pasta Market, Revenue & Volume,By Distribution Channel, 2023-2030 ($)
Table 48 : Israel Alternative Pasta Market, Revenue & Volume,By Type, 2023-2030 ($)
Table 49 : Israel Alternative Pasta Market, Revenue & Volume,By Distribution Channel, 2023-2030 ($)
Table 50 : Top Companies 2023 (US$)Alternative Pasta Market, Revenue & Volume
Table 51 : Product Launch 2023-2030Alternative Pasta Market, Revenue & Volume
Table 52 : Mergers & Acquistions 2023-2030Alternative Pasta Market, Revenue & Volume
List of Figures
Figure 1 : Overview of Alternative Pasta Market 2023-2030
Figure 2 : Market Share Analysis for Alternative Pasta Market 2023 (US$)
Figure 3 : Product Comparison in Alternative Pasta Market 2023-2030 (US$)
Figure 4 : End User Profile for Alternative Pasta Market 2023-2030 (US$)
Figure 5 : Patent Application and Grant in Alternative Pasta Market 2013-2023* (US$)
Figure 6 : Top 5 Companies Financial Analysis in Alternative Pasta Market 2023-2030 (US$)
Figure 7 : Market Entry Strategy in Alternative Pasta Market 2023-2030
Figure 8 : Ecosystem Analysis in Alternative Pasta Market 2023
Figure 9 : Average Selling Price in Alternative Pasta Market 2023-2030
Figure 10 : Top Opportunites in Alternative Pasta Market 2023-2030
Figure 11 : Market Life Cycle Analysis in Alternative Pasta Market
Figure 12 : GlobalBy TypeAlternative Pasta Market Revenue, 2023-2030 ($)
Figure 13 : GlobalBy Distribution Channel Alternative Pasta Market Revenue, 2023-2030 ($)
Figure 14 : Global Alternative Pasta Market - By Geography
Figure 15 : Global Alternative Pasta Market Value & Volume, By Geography, 2023-2030 ($)
Figure 16 : Global Alternative Pasta Market CAGR, By Geography, 2023-2030 (%)
Figure 17 : North America Alternative Pasta Market Value & Volume, 2023-2030 ($)
Figure 18 : US Alternative Pasta Market Value & Volume, 2023-2030 ($)
Figure 19 : US GDP and Population, 2023-2030 ($)
Figure 20 : US GDP – Composition of 2023, By Sector of Origin
Figure 21 : US Export and Import Value & Volume, 2023-2030 ($)
Figure 22 : Canada Alternative Pasta Market Value & Volume, 2023-2030 ($)
Figure 23 : Canada GDP and Population, 2023-2030 ($)
Figure 24 : Canada GDP – Composition of 2023, By Sector of Origin
Figure 25 : Canada Export and Import Value & Volume, 2023-2030 ($)
Figure 26 : Mexico Alternative Pasta Market Value & Volume, 2023-2030 ($)
Figure 27 : Mexico GDP and Population, 2023-2030 ($)
Figure 28 : Mexico GDP – Composition of 2023, By Sector of Origin
Figure 29 : Mexico Export and Import Value & Volume, 2023-2030 ($)
Figure 30 : South America Alternative Pasta Market Value & Volume, 2023-2030 ($)
Figure 31 : Brazil Alternative Pasta Market Value & Volume, 2023-2030 ($)
Figure 32 : Brazil GDP and Population, 2023-2030 ($)
Figure 33 : Brazil GDP – Composition of 2023, By Sector of Origin
Figure 34 : Brazil Export and Import Value & Volume, 2023-2030 ($)
Figure 35 : Venezuela Alternative Pasta Market Value & Volume, 2023-2030 ($)
Figure 36 : Venezuela GDP and Population, 2023-2030 ($)
Figure 37 : Venezuela GDP – Composition of 2023, By Sector of Origin
Figure 38 : Venezuela Export and Import Value & Volume, 2023-2030 ($)
Figure 39 : Argentina Alternative Pasta Market Value & Volume, 2023-2030 ($)
Figure 40 : Argentina GDP and Population, 2023-2030 ($)
Figure 41 : Argentina GDP – Composition of 2023, By Sector of Origin
Figure 42 : Argentina Export and Import Value & Volume, 2023-2030 ($)
Figure 43 : Ecuador Alternative Pasta Market Value & Volume, 2023-2030 ($)
Figure 44 : Ecuador GDP and Population, 2023-2030 ($)
Figure 45 : Ecuador GDP – Composition of 2023, By Sector of Origin
Figure 46 : Ecuador Export and Import Value & Volume, 2023-2030 ($)
Figure 47 : Peru Alternative Pasta Market Value & Volume, 2023-2030 ($)
Figure 48 : Peru GDP and Population, 2023-2030 ($)
Figure 49 : Peru GDP – Composition of 2023, By Sector of Origin
Figure 50 : Peru Export and Import Value & Volume, 2023-2030 ($)
Figure 51 : Colombia Alternative Pasta Market Value & Volume, 2023-2030 ($)
Figure 52 : Colombia GDP and Population, 2023-2030 ($)
Figure 53 : Colombia GDP – Composition of 2023, By Sector of Origin
Figure 54 : Colombia Export and Import Value & Volume, 2023-2030 ($)
Figure 55 : Costa Rica Alternative Pasta Market Value & Volume, 2023-2030 ($)
Figure 56 : Costa Rica GDP and Population, 2023-2030 ($)
Figure 57 : Costa Rica GDP – Composition of 2023, By Sector of Origin
Figure 58 : Costa Rica Export and Import Value & Volume, 2023-2030 ($)
Figure 59 : Europe Alternative Pasta Market Value & Volume, 2023-2030 ($)
Figure 60 : U.K Alternative Pasta Market Value & Volume, 2023-2030 ($)
Figure 61 : U.K GDP and Population, 2023-2030 ($)
Figure 62 : U.K GDP – Composition of 2023, By Sector of Origin
Figure 63 : U.K Export and Import Value & Volume, 2023-2030 ($)
Figure 64 : Germany Alternative Pasta Market Value & Volume, 2023-2030 ($)
Figure 65 : Germany GDP and Population, 2023-2030 ($)
Figure 66 : Germany GDP – Composition of 2023, By Sector of Origin
Figure 67 : Germany Export and Import Value & Volume, 2023-2030 ($)
Figure 68 : Italy Alternative Pasta Market Value & Volume, 2023-2030 ($)
Figure 69 : Italy GDP and Population, 2023-2030 ($)
Figure 70 : Italy GDP – Composition of 2023, By Sector of Origin
Figure 71 : Italy Export and Import Value & Volume, 2023-2030 ($)
Figure 72 : France Alternative Pasta Market Value & Volume, 2023-2030 ($)
Figure 73 : France GDP and Population, 2023-2030 ($)
Figure 74 : France GDP – Composition of 2023, By Sector of Origin
Figure 75 : France Export and Import Value & Volume, 2023-2030 ($)
Figure 76 : Netherlands Alternative Pasta Market Value & Volume, 2023-2030 ($)
Figure 77 : Netherlands GDP and Population, 2023-2030 ($)
Figure 78 : Netherlands GDP – Composition of 2023, By Sector of Origin
Figure 79 : Netherlands Export and Import Value & Volume, 2023-2030 ($)
Figure 80 : Belgium Alternative Pasta Market Value & Volume, 2023-2030 ($)
Figure 81 : Belgium GDP and Population, 2023-2030 ($)
Figure 82 : Belgium GDP – Composition of 2023, By Sector of Origin
Figure 83 : Belgium Export and Import Value & Volume, 2023-2030 ($)
Figure 84 : Spain Alternative Pasta Market Value & Volume, 2023-2030 ($)
Figure 85 : Spain GDP and Population, 2023-2030 ($)
Figure 86 : Spain GDP – Composition of 2023, By Sector of Origin
Figure 87 : Spain Export and Import Value & Volume, 2023-2030 ($)
Figure 88 : Denmark Alternative Pasta Market Value & Volume, 2023-2030 ($)
Figure 89 : Denmark GDP and Population, 2023-2030 ($)
Figure 90 : Denmark GDP – Composition of 2023, By Sector of Origin
Figure 91 : Denmark Export and Import Value & Volume, 2023-2030 ($)
Figure 92 : APAC Alternative Pasta Market Value & Volume, 2023-2030 ($)
Figure 93 : China Alternative Pasta Market Value & Volume, 2023-2030
Figure 94 : China GDP and Population, 2023-2030 ($)
Figure 95 : China GDP – Composition of 2023, By Sector of Origin
Figure 96 : China Export and Import Value & Volume, 2023-2030 ($)Alternative Pasta Market China Export and Import Value & Volume, 2023-2030 ($)
Figure 97 : Australia Alternative Pasta Market Value & Volume, 2023-2030 ($)
Figure 98 : Australia GDP and Population, 2023-2030 ($)
Figure 99 : Australia GDP – Composition of 2023, By Sector of Origin
Figure 100 : Australia Export and Import Value & Volume, 2023-2030 ($)
Figure 101 : South Korea Alternative Pasta Market Value & Volume, 2023-2030 ($)
Figure 102 : South Korea GDP and Population, 2023-2030 ($)
Figure 103 : South Korea GDP – Composition of 2023, By Sector of Origin
Figure 104 : South Korea Export and Import Value & Volume, 2023-2030 ($)
Figure 105 : India Alternative Pasta Market Value & Volume, 2023-2030 ($)
Figure 106 : India GDP and Population, 2023-2030 ($)
Figure 107 : India GDP – Composition of 2023, By Sector of Origin
Figure 108 : India Export and Import Value & Volume, 2023-2030 ($)
Figure 109 : Taiwan Alternative Pasta Market Value & Volume, 2023-2030 ($)
Figure 110 : Taiwan GDP and Population, 2023-2030 ($)
Figure 111 : Taiwan GDP – Composition of 2023, By Sector of Origin
Figure 112 : Taiwan Export and Import Value & Volume, 2023-2030 ($)
Figure 113 : Malaysia Alternative Pasta Market Value & Volume, 2023-2030 ($)
Figure 114 : Malaysia GDP and Population, 2023-2030 ($)
Figure 115 : Malaysia GDP – Composition of 2023, By Sector of Origin
Figure 116 : Malaysia Export and Import Value & Volume, 2023-2030 ($)
Figure 117 : Hong Kong Alternative Pasta Market Value & Volume, 2023-2030 ($)
Figure 118 : Hong Kong GDP and Population, 2023-2030 ($)
Figure 119 : Hong Kong GDP – Composition of 2023, By Sector of Origin
Figure 120 : Hong Kong Export and Import Value & Volume, 2023-2030 ($)
Figure 121 : Middle East & Africa Alternative Pasta Market Middle East & Africa 3D Printing Market Value & Volume, 2023-2030 ($)
Figure 122 : Russia Alternative Pasta Market Value & Volume, 2023-2030 ($)
Figure 123 : Russia GDP and Population, 2023-2030 ($)
Figure 124 : Russia GDP – Composition of 2023, By Sector of Origin
Figure 125 : Russia Export and Import Value & Volume, 2023-2030 ($)
Figure 126 : Israel Alternative Pasta Market Value & Volume, 2023-2030 ($)
Figure 127 : Israel GDP and Population, 2023-2030 ($)
Figure 128 : Israel GDP – Composition of 2023, By Sector of Origin
Figure 129 : Israel Export and Import Value & Volume, 2023-2030 ($)
Figure 130 : Entropy Share, By Strategies, 2023-2030* (%)Alternative Pasta Market
Figure 131 : Developments, 2023-2030*Alternative Pasta Market
Figure 132 : Company 1 Alternative Pasta Market Net Revenue, By Years, 2023-2030* ($)
Figure 133 : Company 1 Alternative Pasta Market Net Revenue Share, By Business segments, 2023 (%)
Figure 134 : Company 1 Alternative Pasta Market Net Sales Share, By Geography, 2023 (%)
Figure 135 : Company 2 Alternative Pasta Market Net Revenue, By Years, 2023-2030* ($)
Figure 136 : Company 2 Alternative Pasta Market Net Revenue Share, By Business segments, 2023 (%)
Figure 137 : Company 2 Alternative Pasta Market Net Sales Share, By Geography, 2023 (%)
Figure 138 : Company 3Alternative Pasta Market Net Revenue, By Years, 2023-2030* ($)
Figure 139 : Company 3Alternative Pasta Market Net Revenue Share, By Business segments, 2023 (%)
Figure 140 : Company 3Alternative Pasta Market Net Sales Share, By Geography, 2023 (%)
Figure 141 : Company 4 Alternative Pasta Market Net Revenue, By Years, 2023-2030* ($)
Figure 142 : Company 4 Alternative Pasta Market Net Revenue Share, By Business segments, 2023 (%)
Figure 143 : Company 4 Alternative Pasta Market Net Sales Share, By Geography, 2023 (%)
Figure 144 : Company 5 Alternative Pasta Market Net Revenue, By Years, 2023-2030* ($)
Figure 145 : Company 5 Alternative Pasta Market Net Revenue Share, By Business segments, 2023 (%)
Figure 146 : Company 5 Alternative Pasta Market Net Sales Share, By Geography, 2023 (%)
Figure 147 : Company 6 Alternative Pasta Market Net Revenue, By Years, 2023-2030* ($)
Figure 148 : Company 6 Alternative Pasta Market Net Revenue Share, By Business segments, 2023 (%)
Figure 149 : Company 6 Alternative Pasta Market Net Sales Share, By Geography, 2023 (%)
Figure 150 : Company 7 Alternative Pasta Market Net Revenue, By Years, 2023-2030* ($)
Figure 151 : Company 7 Alternative Pasta Market Net Revenue Share, By Business segments, 2023 (%)
Figure 152 : Company 7 Alternative Pasta Market Net Sales Share, By Geography, 2023 (%)
Figure 153 : Company 8 Alternative Pasta Market Net Revenue, By Years, 2023-2030* ($)
Figure 154 : Company 8 Alternative Pasta Market Net Revenue Share, By Business segments, 2023 (%)
Figure 155 : Company 8 Alternative Pasta Market Net Sales Share, By Geography, 2023 (%)
Figure 156 : Company 9 Alternative Pasta Market Net Revenue, By Years, 2023-2030* ($)
Figure 157 : Company 9 Alternative Pasta Market Net Revenue Share, By Business segments, 2023 (%)
Figure 158 : Company 9 Alternative Pasta Market Net Sales Share, By Geography, 2023 (%)
Figure 159 : Company 10 Alternative Pasta Market Net Revenue, By Years, 2023-2030* ($)
Figure 160 : Company 10 Alternative Pasta Market Net Revenue Share, By Business segments, 2023 (%)
Figure 161 : Company 10 Alternative Pasta Market Net Sales Share, By Geography, 2023 (%)
Figure 162 : Company 11 Alternative Pasta Market Net Revenue, By Years, 2023-2030* ($)
Figure 163 : Company 11 Alternative Pasta Market Net Revenue Share, By Business segments, 2023 (%)
Figure 164 : Company 11 Alternative Pasta Market Net Sales Share, By Geography, 2023 (%)
Figure 165 : Company 12 Alternative Pasta Market Net Revenue, By Years, 2023-2030* ($)
Figure 166 : Company 12 Alternative Pasta Market Net Revenue Share, By Business segments, 2023 (%)
Figure 167 : Company 12 Alternative Pasta Market Net Sales Share, By Geography, 2023 (%)
Figure 168 : Company 13Alternative Pasta Market Net Revenue, By Years, 2023-2030* ($)
Figure 169 : Company 13Alternative Pasta Market Net Revenue Share, By Business segments, 2023 (%)
Figure 170 : Company 13Alternative Pasta Market Net Sales Share, By Geography, 2023 (%)
Figure 171 : Company 14 Alternative Pasta Market Net Revenue, By Years, 2023-2030* ($)
Figure 172 : Company 14 Alternative Pasta Market Net Revenue Share, By Business segments, 2023 (%)
Figure 173 : Company 14 Alternative Pasta Market Net Sales Share, By Geography, 2023 (%)
Figure 174 : Company 15 Alternative Pasta Market Net Revenue, By Years, 2023-2030* ($)
Figure 175 : Company 15 Alternative Pasta Market Net Revenue Share, By Business segments, 2023 (%)
Figure 176 : Company 15 Alternative Pasta Market Net Sales Share, By Geography, 2023 (%)