 Email
Email Print
Print


Connected Injectable Drug Delivery Devices Market - Forecast(2025 - 2031)
Connected Injectable Drug Delivery Devices Market Overview
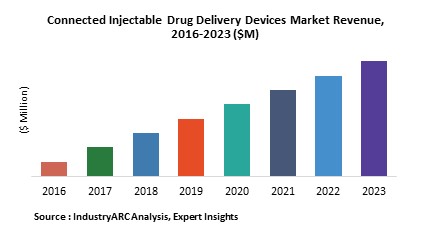
Self-administration of drugs through pre-filled syringes is one of the different ways that is helping patients save the fees given to a caregiver. The global connected injectable drug delivery devices market is estimated to surpass $22,814m by 2023, growing at an estimated CAGR of 6.8% from 2018 to 2023.The Europe region is the largest market for connected injectable drug delivery devices owing to the large customer pool.
Connected Injectable Drug Delivery Devices Market Outlook
Connected injectable drug delivery devices record the dosing pattern of patients and makes it available to healthcare professionals. These drug delivery devices help in addressing patient’s issues with regard to medications, treatments, and disease management protocols that are of major concern for professionals in the healthcare and pharmaceutical industries. Before bringing a connected health offering to life, it is important to understand the fundamentals of patient-centric design. One of the most successful elements in fulfilling the need for patient-centric design is human factors analysis, which benefits the patient by making injection systems more comfortable and user-friendly.
This report provides an in-depth analysis of the connected injectable drug delivery devices market by delivery devices type, connectivity technology, by disease, and by geography. On the basis of delivery devices type, the market is categorized into conventional injection devices, self-injection devices, and others. On the basis of connectivity technology, the market is segmented into wireless technology, Bluetooth, near infrared technology, and smart phone apps. Based on disease, the market is categorized into anaphylaxis, autoimmune disease, cardiovascular, diabetes, hormone replacement, and others.
Connected Injectable Drug Delivery Devices Market Growth Drivers
The market is forecast to be majorly driven by the increase in cases of chronic diseases like rheumatoid arthritis, cardiovascular disease, cancer and diabetes. The increasing concern of the pharmaceutical or medical devices companies towards development of connected injectable drug delivery devices is expected to drive the connected injectable drug delivery devices market.
Connected Injectable Drug Delivery Devices Market Challenges
The regulatory hurdles due to high requirement of data and evidences for developing new technologies and recent product recalls by the FDA are restraining the growth of the connected injectable drug delivery devices market. High cost of these connected injectable drug delivery devices and data security and privacy issues are also hindering the market growth.
Connected Injectable Drug Delivery Devices Market Research Scope
The base year of the study is 2017, with forecast done up to 2023. The study presents a thorough analysis of the competitive landscape, taking into account the market shares of the leading companies. It also provides information on unit shipments. These provide the key market participants with the necessary business intelligence and help them understand the future of the connected injectable drug delivery devices market. The assessment includes the forecast, an overview of the competitive structure, the market shares of the competitors, as well as the market trends, market demands, market drivers, market challenges, and product analysis. The market drivers and restraints have been assessed to measure their impact over the forecast period. This report further identifies the key opportunities for growth while also detailing the key challenges and possible threats. The key areas of focus include the types of delivery devices, and connectivity technology in the connected injectable drug delivery devices market.
Connected Injectable Drug Delivery Devices Market Report: Industry Coverage
Delivery devices type in Connected Injectable Drug Delivery Devices: Conventional Injection Devices, Self-Injection Devices, and Others
Connectivity technology in Connected Injectable Drug Delivery Devices: Wireless Technology, Bluetooth, Near Field Technology, and Smart Phone Apps
Diseases in Connected Injectable Drug Delivery Devices: Anaphylaxis, Autoimmune Disease, Cardiovascular, Diabetes, Hormone Replacement, and Others
The Connected Injectable Drug Delivery Devices Market report also analyzes the major geographic regions for the market as well as the major countries for the market in these regions. The regions and countries covered in the study include:
- North America: The U.S., Canada, Mexico
- South America: Brazil, Venezuela, Argentina, Ecuador, Peru, Colombia, Costa Rica
- Europe: The U.K., Germany, Italy, France, The Netherlands, Belgium, Spain, Denmark
- APAC: China, Japan, Australia, South Korea, India, Taiwan, Malaysia, Hong Kong
- The Middle East and Africa: Israel, South Africa, Saudi Arabia
Connected Injectable Drug Delivery Devices Market Key Players Perspective
Some of the key players mentioned in this report are Ypsomed Holdings, Unolife Corporation, Quio Technologies, SHL Group, Biocorp, Haselmeier Inc., and West Pharmaceutical Services, Inc.
Connected Injectable Drug Delivery Devices Market Trends
- Rising prevalence of multiple sclerosis and rheumatoid arthritis will also impact the connected injectable drug delivery devices market.
- Rising incidence of diabetes globally will also propel the growth of the connected injectable drug delivery devices market
- Conventional injection devices accounted for the major share of the total market in 2017.
- As per IndustryARC analysis, the conventional injection devices segment will generate substantial revenue by 2023. The advancement in technology and rising incidences of rheumatoid arthritis and multiple sclerosis are set to drive the market in the next few years.
1. Connected Injectable Drug Delivery Devices Market - Overview
1.1. Definitions and Scope
2. Connected Injectable Drug Delivery Devices Market - Executive summary
2.1. Market Revenue, Market Size and Key Trends by Company
2.2. Key Trends by type of Application
2.3. Key Trends segmented by Geography
3. Connected Injectable Drug Delivery Devices Market
3.1. Comparative analysis
3.1.1. Product Benchmarking - Top 10 companies
3.1.2. Top 5 Financials Analysis
3.1.3. Market Value split by Top 10 companies
3.1.4. Patent Analysis - Top 10 companies
3.1.5. Pricing Analysis
4. Connected Injectable Drug Delivery Devices Market – Startup companies Scenario Premium
4.1. Top 10 startup company Analysis by
4.1.1. Investment
4.1.2. Revenue
4.1.3. Market Shares
4.1.4. Market Size and Application Analysis
4.1.5. Venture Capital and Funding Scenario
5. Connected Injectable Drug Delivery Devices Market – Industry Market Entry Scenario Premium
5.1. Regulatory Framework Overview
5.2. New Business and Ease of Doing business index
5.3. Case studies of successful ventures
5.4. Customer Analysis – Top 10 companies
6. Connected Injectable Drug Delivery Devices Market Forces
6.1. Drivers
6.2. Constraints
6.3. Challenges
6.4. Porters five force model
6.4.1. Bargaining power of suppliers
6.4.2. Bargaining powers of customers
6.4.3. Threat of new entrants
6.4.4. Rivalry among existing players
6.4.5. Threat of substitutes
7. Connected Injectable Drug Delivery Devices Market -Strategic analysis
7.1. Value chain analysis
7.2. Opportunities analysis
7.3. Product life cycle
7.4. Suppliers and distributors Market Share
8. Connected Injectable Drug Delivery Devices Market – By Delivery Devices Type (Market Size -$Million / $Billion)
8.1. Market Size and Market Share Analysis
8.2. Application Revenue and Trend Research
8.3. Product Segment Analysis
8.3.1. Conventional Injection Devices
8.3.2. Self-Injection Devices
8.3.2.1. Pen Injectors
8.3.2.2. Needle Free Injectors
8.3.2.3. Auto Injectors
8.3.3. Others
9. Connected Injectable Drug Delivery Devices Market – By Connectivity Technology (Market Size -$Million / $Billion)
9.1. Introduction
9.2. Wireless Technology
9.3. Bluetooth
9.4. Near Field Technology
9.5. Smart Phone Apps
10. Connected Injectable Drug Delivery Devices Market – By Disease (Market Size -$Million / $Billion)
10.1. Introduction
10.2. Anaphylaxis
10.3. Autoimmune Disease
10.4. Cardiovascular
10.5. Diabetes
10.6. Hormone Replacement
10.7. Others
11. Connected Injectable Drug Delivery Devices - By Geography (Market Size -$Million / $Billion)
11.1. Connected Injectable Drug Delivery Devices Market - North America Segment Research
11.2. North America Market Research (Million / $Billion)
11.2.1. Segment type Size and Market Size Analysis
11.2.2. Revenue and Trends
11.2.3. Application Revenue and Trends by type of Application
11.2.4. Company Revenue and Product Analysis
11.2.5. North America Product type and Application Market Size
11.2.5.1. U.S.
11.2.5.2. Canada
11.2.5.3. Mexico
11.2.5.4. Rest of North America
11.3. Connected Injectable Drug Delivery Devices - South America Segment Research
11.4. South America Market Research (Market Size -$Million / $Billion)
11.4.1. Segment type Size and Market Size Analysis
11.4.2. Revenue and Trends
11.4.3. Application Revenue and Trends by type of Application
11.4.4. Company Revenue and Product Analysis
11.4.5. South America Product type and Application Market Size
11.4.5.1. Brazil
11.4.5.2. Venezuela
11.4.5.3. Argentina
11.4.5.4. Ecuador
11.4.5.5. Peru
11.4.5.6. Colombia
11.4.5.7. Costa Rica
11.4.5.8. Rest of South America
11.5. Connected Injectable Drug Delivery Devices - Europe Segment Research
11.6. Europe Market Research (Market Size -$Million / $Billion)
11.6.1. Segment type Size and Market Size Analysis
11.6.2. Revenue and Trends
11.6.3. Application Revenue and Trends by type of Application
11.6.4. Company Revenue and Product Analysis
11.6.5. Europe Segment Product type and Application Market Size
11.6.5.1. U.K
11.6.5.2. Germany
11.6.5.3. Italy
11.6.5.4. France
11.6.5.5. Netherlands
11.6.5.6. Belgium
11.6.5.7. Spain
11.6.5.8. Denmark
11.6.5.9. Rest of Europe
11.7. Connected Injectable Drug Delivery Devices – APAC Segment Research
11.8. APAC Market Research (Market Size -$Million / $Billion)
11.8.1. Segment type Size and Market Size Analysis
11.8.2. Revenue and Trends
11.8.3. Application Revenue and Trends by type of Application
11.8.4. Company Revenue and Product Analysis
11.8.5. APAC Segment – Product type and Application Market Size
11.8.5.1. China
11.8.5.2. Australia
11.8.5.3. Japan
11.8.5.4. South Korea
11.8.5.5. India
11.8.5.6. Taiwan
11.8.5.7. Malaysia
12. Connected Injectable Drug Delivery Devices Market - Entropy
12.1. New product launches
12.2. M&A's, collaborations, JVs and partnerships
13. Connected Injectable Drug Delivery Devices Market – Industry / Segment Competition landscape Premium
13.1. Market Share Analysis
13.1.1. Market Share by Country- Top companies
13.1.2. Market Share by Region- Top 10 companies
13.1.3. Market Share by type of Application – Top 10 companies
13.1.4. Market Share by type of Product / Product category- Top 10 companies
13.1.5. Market Share at global level- Top 10 companies
13.1.6. Best Practises for companies
14. Connected Injectable Drug Delivery Devices Market – Key Company List by Country Premium
15. Connected Injectable Drug Delivery Devices Market Company Analysis
15.1. Market Share, Company Revenue, Products, M&A, Developments
15.2. Ypsomed Holdings
15.3. Unolife Corporation
15.4. Quio Technologies
15.5. SHL Group
15.6. Biocorp
15.7. Haselmeier Inc.
15.8. West Pharmaceutical Services Inc.
15.9. Company 8
15.10. Company 9
15.11. Company 10 and more
"*Financials would be provided on a best efforts basis for private companies"
16. Connected Injectable Drug Delivery Devices Market -Appendix
16.1. Abbreviations
16.2. Sources
17. Connected Injectable Drug Delivery Devices Market -Methodology Premium
17.1. Research Methodology
17.1.1. Company Expert Interviews
17.1.2. Industry Databases
17.1.3. Associations
17.1.4. Company News
17.1.5. Company Annual Reports
17.1.6. Application Trends
17.1.7. New Products and Product database
17.1.8. Company Transcripts
17.1.9. R&D Trends
17.1.10. Key Opinion Leaders Interviews
17.1.11. Supply and Demand Trends
List of Tables:
Table 1: Key Connected Injectable Drug Delivery Devices: Companies, 2016 (%)
Table 2: Global Injectable Drug Delivery Devices Market, By Delivery Device, 2015 - 2022 ($Million)
Table 3: Global Self-Injection Devices Market, By Delivery Device, 2015 - 2022 ($Million)
Table 4: Global Self-Injection Devices Market, By Geography, 2015 - 2022 ($Million)
Table 5: Global Auto Injectors Products Market, By Geography, 2015 - 2022 ($Million)
Table 6: Global Pen Injector Market, By Geography, 2015 - 2022 ($Million)
Table 7: Global Needle Free Injectors Market, By Geography, 2015 - 2022 ($Million)
Table 8: North America Self-Injection Devices Market, By Geography, 2015 - 2022 ($Million)
Table 9: U.S. Self-Injection Devices Market, By Delivery Device, 2015 - 2022 ($Million)
Table 10: Canada Self-Injection Devices Market, By Delivery Device, 2015 - 2022 ($Million)
Table 11: Mexico Self-Injection Devices Market, By Delivery Device, 2015 - 2022 ($Million)
Table 12: U.S.: GDP – Composition of 2015, By End Use
Table 13: Canada: GDP – Composition of 2015, By End Use
Table 14: Mexico: GDP – Composition of 2015, By End Use
Table 15: Europe Self-Injection Devices Market, By Geography, 2015 - 2022 ($Million)
Table 16: U.K. Self-Injection Devices Market, By Delivery Device,2015 - 2022 ($Million)
Table 17: Germany Self-Injection Devices Market, By Delivery Device, 2015 - 2022 ($Million)
Table 18: France Self-Injection Devices Market, By Delivery Device, 2015 - 2022 ($Million)
Table 19: Italy Self-Injection Devices Market, By Delivery Device, 2015 - 2022 ($Million)
Table 20: Spain Self-Injection Devices Market, By Delivery Device, 2015 - 2022 ($Million)
Table 21: Rest of Europe Self-Injection Devices Market, By Delivery Device, 2015 - 2022 ($Million)
Table 22: U.K.: GDP – Composition of 2015, By End Use
Table 23: Germany: GDP – Composition of 2015, By End Use
Table 24: France: GDP – Composition of 2015, By End Use
Table 25: Italy: GDP – Composition of 2015, By End Use
Table 26: Spain: GDP – Composition of 2015, By End Use
Table 27: Asia-Pacific Self-Injection Devices Market, By Geography, 2015 - 2022 ($Million)
Table 28: China Self-Injection Devices Market, By Delivery Device, 2015 - 2022 ($Million)
Table 29: India Self-Injection Devices Market, By Delivery Device, 2015 - 2022 ($Million)
Table 30: Japan Self-Injection Devices Market, By Delivery Device, 2015 - 2022 ($Million)
Table 31: South Korea Self-Injection Devices Market, By Delivery Device, 2015 - 2022 ($Million)
Table 32: Australia &New Zealand Self-Injection Devices Market, By Delivery Device, 2015 - 2022 ($Million)
Table 33: Rest of APAC Self-Injection Devices Market, By Delivery Device, 2015 - 2022 ($Million)
Table 34: China: GDP – Composition of 2015, By End Use
Table 35: Japan: GDP – Composition of 2015, By End Use
Table 36: India: GDP – Composition of 2015, By End Use
Table 37: Australia: GDP – Composition of 2015, By End Use
Table 38: South Korea: GDP – Composition of 2015, By End Use
Table 39: RoW Self-Injection Devices Market, By Geography, 2015 - 2022 ($Million)
Table 40: Middle East & Africa Self-Injection Devices Market, By Delivery Device, 2015 - 2022 ($Million)
Table 41: South America Self-Injection Devices Market, By Delivery Device, 2015 - 2022 ($Million)
List of Figures:
Figure 1: Global Injectable Drug Delivery Devices Market, By Delivery Device Type, 2015 - 2022 ($Billion)
Figure 2: Global Self-Injection Devices Market, By Product, 2015 - 2022 ($Million)
Figure 3: Global Self-Injection Devices Market, By Geography, 2015 - 2022 ($Million)
Figure 4: Global Injectable Drug Delivery Devices Market, By Country, 2015 - 2022 ($Million)
Figure 5: Connected Injectable Drug Delivery Devices Patents, By Year, 2012-2016
Figure 6: West Pharmaceutical Service, Inc.
Figure 7: Unlife Corporation
Figure 8: Ypsomed
Figure 9: Earnings Per Share, By Company
Figure 10: Injectable Drug Delivery Devices Value Chain
Figure 11: Connected Self-Injection Drug Delivery Devices Market - By Delivery Devices
Figure 12: Connected Injectable Drug Delivery Devices Market - By Disease
Figure 13: Global Connected Injectable Drug Delivery Devices Market - By Geography
Figure 14: U.S.: GDP and Population, 2012-2015 ($Trillion, Million)
Figure 15: U.S.: GDP – Composition of 2015, By Sector of Origin
Figure 16: U.S.: Export and Import Value, 2012-2015 ($Trillion)
Figure 17: Canada: GDP and Population, 2012-2015 ($Trillion, Million)
Figure 18: Canada: GDP – Composition of 2015, By Sector of Origin
Figure 19: Canada: Export and Import Value, 2012-2015 ($Billion)
Figure 20: Mexico: GDP and Population, 2012-2015 ($Trillion, Million)
Figure 21: Mexico: GDP – Composition of 2015, By Sector of Origin
Figure 22: Mexico: Export and Import Value, 2012-2015 ($Billion)
Figure 23: U.K.: GDP and Population, 2012-2015 ($Trillion, Million)
Figure 24: U.K.: GDP – Composition of 2015, By Sector of Origin
Figure 25: U.K.: Export and Import Value, 2012-2015 ($Billion)
Figure 26: Germany: GDP and Population, 2012-2015 ($Trillion, Million)
Figure 27: Germany: GDP – Composition of 2015, By Sector of Origin
Figure 28: Germany: Export and Import Value, 2012-2015 ($Billion)
Figure 29: France: GDP and Population, 2012-2015 ($Trillion, Million)
Figure 30: France: GDP – Composition of 2015, By Sector of Origin
Figure 31: France: Export and Import Value, 2012-2015 ($Billion)
Figure 32: Italy: GDP and Population, 2012-2015 ($Trillion, Million)
Figure 33: Italy: GDP – Composition of 2015, By Sector of Origin
Figure 34: Italy: Export and Import Value, 2012-2015 ($Billion)
Figure 35: Spain: GDP and Population, 2012-2015 ($Trillion, Million)
Figure 36: Spain: GDP – Composition of 2015, By Sector of Origin
Figure 37: Spain: Export and Import Value, 2012-2015 ($Billion)
Figure 38: China: GDP and Population, 2012-2015 ($Trillion, Million)
Figure 39: China: GDP – Composition of 2015, By Sector of Origin
Figure 40: China: Export and Import Value, 2012-2015 ($Billion)
Figure 41: Japan: GDP and Population, 2012-2015 ($Trillion, Million)
Figure 42: Japan: GDP – Composition of 2015, By Sector of Origin
Figure 43: Japan: Export and Import Value, 2012-2015 ($Billion)
Figure 44: India: GDP and Population, 2012-2015 ($Trillion, Million)
Figure 45: India: GDP – Composition of 2015, By Sector of Origin
Figure 46: India: Export and Import Value, 2012-2015 ($Billion)
Figure 47: Australia: GDP and Population, 2012-2015 ($Trillion, Million)
Figure 48: Australia: GDP – Composition of 2015, By Sector of Origin
Figure 49: Australia: Export and Import Value, 2012-2015 ($Billion)
Figure 50: South Korea: GDP and Population, 2012-2015 ($Trillion, Million)
Figure 51: South Korea: GDP – Composition of 2015, By Sector of Origin
Figure 52: South Korea: Export and Import Value, 2012-2015 ($Billion)
Figure 53: Connected Injectable Drug Delivery Devices Market Entropy Share, By Strategies, 2012-2016 (%)
Figure 54: Connected Injectable Drug Delivery Devices Market Entropy, By Total Number of Developments, 2012-2016
Figure 55: Ypsomed, Net Revenues, By Years, 2013-2016 ($ M)
Figure 56: Ypsomed, Net Revenue Share, By Business segments, 2016 (%)
Figure 57: Ypsomed, Net Revenue Share, By Geography, 2016 (%)
Figure 58: Unilife Corp. Revenues, By Years, 2013-2016 ($ M)
Figure 59: Unilife Corp. Revenue Share, By Geography, 2016 (%)
Figure 60: West Pharmaceutical Services, Inc. Net Sales, By Years, 2013-2015 ($Billion)
Figure 61: West Pharmaceutical Services, Inc. Net Sales Share, By Business Segments, 2015($Billion)