 Email
Email Print
Print


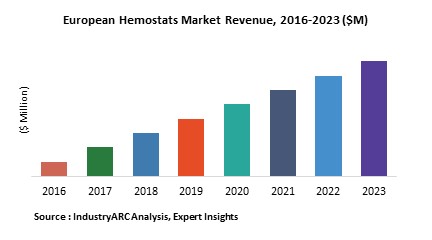
Hemostasis is process of blood clotting. Hemostats are surgical agents which regulate the bleeding during surgeries. Blood clotting plays an important role in various surgeries to achieve positive outcomes with the reduction in blood loss. It also helps to shorten the surgery time and reduces the need for blood transfusion. The importance of hemostasis has led to the development of wide variety of surgical agents. These agents vary in their mechanism of action, composition, ease of application and cost. The Europe hemostasis market is believed to grow at a CAGR of 4.4%. The hemostat market share of Germany has been estimated to be greater than 20% in 2017.
What is a Hemostat?
Hemostat is a surgical tool which is used to control bleeding. Hemostats can be used for oozing venous type bleeds, bone bleeding, needle-hole bleeding and surgical bleeding. There are numerous advantages of using hemostat such as reduction in the number of complication caused due to profuse bleeding, decreased operative time and less exposure to infections.
A wide variety of hemostats are produced which contain active biological compounds such as collagen, gelatin, cellulose and polysaccharide. The hemostats are further divided into mechanical, active, flowable and active sealant. The benefits and risks of use of these agents versus conventional treatment need to be considered on a case-by-case basis by the surgeon.
This report incorporates an in-depth assessment of hemostat market in Europe by type, treatment and end user industries geography.
What are the major applications of Hemostat?
Hemostatic agents can play a key role in establishing hemostasis in pre-hospital situations and preventing hemorrhage-associated death. Hemostats are widely used in hospitals, surgery centers and nursing stations. It is widely used in various surgeries such as cardiac surgery, neurosurgery and so on. For example, as a hemostatic agent on anastomoses in aortic valve surgery, particularly in the presence of calcific or atheromatous aortas. However, the new inventions and technological developments have led to the discovery of various topical hemostats which are available in a powder or gel form that can be applied on the affected area without any pain. It has been found that hemostatic agents are used in military and civilian sectors.
Market Research and Market Trends in European Hemostat Market:
- RevMedx recently requested FDA to approve a pocket-size invention named ‘XSat’, a modified syringe that injects specially coated sponges into wounds. The sponge material has to be sterile and biocompatible and is coated with chitosan which prevents excess blood flow.
- A number of biologists are working on to develop a new hemostatic device for endoscopic surgery that can control the bleeding without completely occluding the bleeding vessel but this study is still in its infant stage.
- Hemodilution, an old method to prevent the loss of RBC during large surgeries is widely used even today. In this technique, a specific amount of blood is removed during the surgery and replaced with intravenous fluid and then returned after surgery.
- Scientists from MIT and Hong Kong have discovered the use of nanotechnology to prevent the blood loss during surgeries. They have discovered that the use of some simple liquid containing polypeptides forms a nanoscale protective layers and seals the wound which pauses bleeding.
- PerClot is the latest development in hemostatic technology representing the next generation in hemostats. It is made of a plant based material which is completely safe and will not cause any hypersensitive reactions.
Who are the Major Players in European Hemostat market?
The major players in this market include Johnson & Johnson Services, Inc. (U.S.). C. R. Bard, Inc. (U.S.), Baxter (U.S.), B Braun Melsungen AG (Germany), Pfizer Inc. (U.S.), Vascular Solutions, Inc. (U.S.), Gelita Medical GmbH (Germany), Equimedical (Netherlands), Integra Lifesciences Holdings Corporation (U.S.), Z-Medica, LLC (U.S.), and Marine Polymer Technologies, Inc. (U.S.).
What is our report scope?
The report incorporates in-depth assessment the competitive landscape, product market sizing, product benchmarking, market trends, product developments, financial analysis, strategic analysis so on to gauge the impact forces potential opportunities the market. Apart from this the report also includes a study major developments in the market such as product launches, agreements, acquisitions, collaborations, mergers so on to comprehend the prevailing market dynamics at present its impact during the forecast period 2018-2024.
All our reports are customizable to your company needs to a certain extent, we do provide 20 free consulting hours along with purchase each report and this will allow you to request any additional data to customize the report to your needs.
Key Takeaways from this Report
- Evaluate market potential through analyzing growth rates (CAGR %), Volume (Units) Value ($M) data given at country level – for product types, end use applications by different industry verticals.
- Underst the different dynamics influencing the market – key driving factors, challenges hidden opportunities.
- Get in-depth insights on your competitor performance – market shares, strategies, financial benchmarking, product benchmarking, SWOT more.
- Analyze the sales distribution channels across key geographies to improve top-line revenues.
- Underst the industry supply chain with a deep-dive on the value augmentation at each step, in order to optimize value bring efficiencies in your processes.
- Get a quick outlook on the market entropy – M&A’s, deals, partnerships, product launches all key players for the past 4 years.
- Evaluate the supply-dem gaps, import-export statistics regulatory lscape for more than top 20 countries globally for the market.
For more Lifesciences and Healthcare related reports, please click here
1. European Hemostats Market Overview
2. Executive Summary
3. European Hemostats Market Landscape
3.1. Market Share Analysis
3.2. Comparative Analysis
3.2.1. Product Benchmarking
3.2.2. End User profiling
3.2.3. Patent Analysis
3.2.4. Top 5 Financials Analysis
4. European Hemostats Market Forces
4.1. Market Drivers
4.2. Market Constraints
4.3. Market Challenges
4.4. Attractiveness of the Industry
4.4.1. Power of Suppliers
4.4.2. Power of Customers
4.4.3. Threat of New entrants
4.4.4. Threat of Substitution
4.4.5. Degree of Competition
5. European Hemostats Market – Strategic Analysis
5.1. Value Chain Analysis
5.2. Pricing Analysis
5.3. Opportunities Analysis
5.4. Product/Market Life Cycle Analysis
5.5. Suppliers and Distributors
6. European Hemostats Market – By Type
6.1. Introduction
6.2. Active
6.2.1. Thrombin Based Hemostat
6.2.1.1. Bovine Thrombin
6.2.1.2. Pooled Human Plasma Thrombin
6.2.1.3. Recombinant Thrombin
6.3. Passive
6.3.1. Collagen Based Hemostats
6.3.1.1. Microfibrillar Collagen Hemostat
6.3.1.2. Absorbable Collagen Hemostat Sponge
6.3.2. Oxidized Regenerated Cellulose
6.3.3. Gelatins
6.3.4. Polysacchride Hemospheres
6.4. Flowable
6.4.1. Bovine Gelatin + Pooled Human Thrombin
6.4.2. Bovine Gelatin + Other Thrombin Products
6.5. Sealants
6.5.1. Fibrin Sealants
6.5.2. Synthetic Sealants
6.5.3. Others
6.6. Adhesives
6.6.1. Polyethylene Glycol Hydrogels (PEG)
6.6.2. PEG + Trilysine Amine
6.6.3. PEG + Human Serum Albumin
6.6.4. Liquid Monomers
7. European Hemostats Market - By Treatment
7.1. Introduction
7.2. Cardiac Surgery
7.3. Vascular Procedures
7.4. Soft Tissue Reconstructions
7.5. Spinal Procedures
7.6. Hepatic Resection
7.7. Others
8. European Hemostats Market - By End Users
8.1. Introduction
8.2. Hospitals
8.3. Surgery Centers
8.4. Nursing Homes
8.5. Others
9. European Hemostats Market - By Country
9.1. Europe
9.1.1. U.K.
9.1.2. Ireland
9.1.3. France
9.1.4. Germany
9.1.5. Spain
9.1.6. Italy
9.1.7. Netherlands
9.1.8. Belgium
9.1.9. Austria
9.1.10. Norway
9.1.11. Sweden
9.1.12. Finland
9.1.13. Sweden
9.1.14. Denmark
9.1.15. Switzerland
9.1.16. Portugal
9.1.17. Rest of Europe
10. Market Entropy
10.1. New Product Launches
10.2. M&A’s, Collaborations, JV’s, Partnership
11. Company Profiles (Overview, Financials, SWOT Analysis, Developments, Product Portfolio)
11.1. Johnson & Johnson Services, Inc. (U.S.)
11.2. C. R. Bard, Inc. (U.S.)
11.3. Baxter (U.S.)
11.4. B Braun Melsungen AG (Germany)
11.5. Pfizer Inc. (U.S.)
11.6. Vascular Solutions, Inc. (U.S.)
11.7. Gelita Medical GmbH (Germany)
11.8. Equimedical (Netherlands)
11.9. Integra Lifesciences Holdings Corporation (U.S.)
11.10. Z-Medica, LLC (U.S.)
11.11 Marine Polymer Technologies, Inc. (U.S.)
11.12 Company 12
11.13 Company 13
11.14 Company 14
11.15 Company 15
*More than 20 Companies are profiled in this Research Report*
"*Financials would be provided on a best efforts basis for private companies"
12. Appendix
12.1. Abbreviations
12.2. Sources
12.3. Research Methodology
12.4. Bibliography
12.5. Compilation of Expert Insights
12.6. Disclaimer
List of Tables:
Table 1: European Hemostats Market Overview 2023-2030
Table 2: European Hemostats Market Leader Analysis 2023-2030 (US$)
Table 3: European Hemostats Market Product Analysis 2023-2030 (US$)
Table 4: European Hemostats Market End User Analysis 2023-2030 (US$)
Table 5: European Hemostats Market Patent Analysis 2013-2023* (US$)
Table 6: European Hemostats Market Financial Analysis 2023-2030 (US$)
Table 7: European Hemostats Market Driver Analysis 2023-2030 (US$)
Table 8: European Hemostats Market Challenges Analysis 2023-2030 (US$)
Table 9: European Hemostats Market Constraint Analysis 2023-2030 (US$)
Table 10: European Hemostats Market Supplier Bargaining Power Analysis 2023-2030 (US$)
Table 11: European Hemostats Market Buyer Bargaining Power Analysis 2023-2030 (US$)
Table 12: European Hemostats Market Threat of Substitutes Analysis 2023-2030 (US$)
Table 13: European Hemostats Market Threat of New Entrants Analysis 2023-2030 (US$)
Table 14: European Hemostats Market Degree of Competition Analysis 2023-2030 (US$)
Table 15: European Hemostats Market Value Chain Analysis 2023-2030 (US$)
Table 16: European Hemostats Market Pricing Analysis 2023-2030 (US$)
Table 17: European Hemostats Market Opportunities Analysis 2023-2030 (US$)
Table 18: European Hemostats Market Product Life Cycle Analysis 2023-2030 (US$)
Table 19: European Hemostats Market Supplier Analysis 2023-2030 (US$)
Table 20: European Hemostats Market Distributor Analysis 2023-2030 (US$)
Table 21: European Hemostats Market Trend Analysis 2023-2030 (US$)
Table 22: European Hemostats Market Size 2023 (US$)
Table 23: European Hemostats Market Forecast Analysis 2023-2030 (US$)
Table 24: European Hemostats Market Sales Forecast Analysis 2023-2030 (Units)
Table 25: European Hemostats Market , Revenue & Volume, By Type, 2023-2030 ($)
Table 26: European Hemostats Market By Type, Revenue & Volume, By Active, 2023-2030 ($)
Table 27: European Hemostats Market By Type, Revenue & Volume, By Passive, 2023-2030 ($)
Table 28: European Hemostats Market By Type, Revenue & Volume, By Flowable, 2023-2030 ($)
Table 29: European Hemostats Market By Type, Revenue & Volume, By Sealants, 2023-2030 ($)
Table 30: European Hemostats Market By Type, Revenue & Volume, By Adhesives, 2023-2030 ($)
Table 31: European Hemostats Market , Revenue & Volume, By Treatment, 2023-2030 ($)
Table 32: European Hemostats Market By Treatment, Revenue & Volume, By Cardiac Surgery, 2023-2030 ($)
Table 33: European Hemostats Market By Treatment, Revenue & Volume, By Vascular Procedures, 2023-2030 ($)
Table 34: European Hemostats Market By Treatment, Revenue & Volume, By Soft Tissue Reconstructions, 2023-2030 ($)
Table 35: European Hemostats Market By Treatment, Revenue & Volume, By Spinal Procedures, 2023-2030 ($)
Table 36: European Hemostats Market By Treatment, Revenue & Volume, By Hepatic Resection, 2023-2030 ($)
Table 37: European Hemostats Market , Revenue & Volume, By End Users, 2023-2030 ($)
Table 38: European Hemostats Market By End Users, Revenue & Volume, By Hospitals, 2023-2030 ($)
Table 39: European Hemostats Market By End Users, Revenue & Volume, By Surgery Centers, 2023-2030 ($)
Table 40: European Hemostats Market By End Users, Revenue & Volume, By Nursing Homes, 2023-2030 ($)
Table 41: North America European Hemostats Market , Revenue & Volume, By Type, 2023-2030 ($)
Table 42: North America European Hemostats Market , Revenue & Volume, By Treatment, 2023-2030 ($)
Table 43: North America European Hemostats Market , Revenue & Volume, By End Users, 2023-2030 ($)
Table 44: South america European Hemostats Market , Revenue & Volume, By Type, 2023-2030 ($)
Table 45: South america European Hemostats Market , Revenue & Volume, By Treatment, 2023-2030 ($)
Table 46: South america European Hemostats Market , Revenue & Volume, By End Users, 2023-2030 ($)
Table 47: Europe European Hemostats Market , Revenue & Volume, By Type, 2023-2030 ($)
Table 48: Europe European Hemostats Market , Revenue & Volume, By Treatment, 2023-2030 ($)
Table 49: Europe European Hemostats Market , Revenue & Volume, By End Users, 2023-2030 ($)
Table 50: APAC European Hemostats Market , Revenue & Volume, By Type, 2023-2030 ($)
Table 51: APAC European Hemostats Market , Revenue & Volume, By Treatment, 2023-2030 ($)
Table 52: APAC European Hemostats Market , Revenue & Volume, By End Users, 2023-2030 ($)
Table 53: Middle East & Africa European Hemostats Market , Revenue & Volume, By Type, 2023-2030 ($)
Table 54: Middle East & Africa European Hemostats Market , Revenue & Volume, By Treatment, 2023-2030 ($)
Table 55: Middle East & Africa European Hemostats Market , Revenue & Volume, By End Users, 2023-2030 ($)
Table 56: Russia European Hemostats Market , Revenue & Volume, By Type, 2023-2030 ($)
Table 57: Russia European Hemostats Market , Revenue & Volume, By Treatment, 2023-2030 ($)
Table 58: Russia European Hemostats Market , Revenue & Volume, By End Users, 2023-2030 ($)
Table 59: Israel European Hemostats Market , Revenue & Volume, By Type, 2023-2030 ($)
Table 60: Israel European Hemostats Market , Revenue & Volume, By Treatment, 2023-2030 ($)
Table 61: Israel European Hemostats Market , Revenue & Volume, By End Users, 2023-2030 ($)
Table 62: Top Companies 2023 (US$) European Hemostats Market , Revenue & Volume
Table 63: Product Launch 2023-2030 European Hemostats Market , Revenue & Volume
Table 64: Mergers & Acquistions 2023-2030 European Hemostats Market , Revenue & Volume
List of Figures:
Figure 1: Overview of European Hemostats Market 2023-2030
Figure 2: Market Share Analysis for European Hemostats Market 2023 (US$)
Figure 3: Product Comparison in European Hemostats Market 2023-2030 (US$)
Figure 4: End User Profile for European Hemostats Market 2023-2030 (US$)
Figure 5: Patent Application and Grant in European Hemostats Market 2013-2023* (US$)
Figure 6: Top 5 Companies Financial Analysis in European Hemostats Market 2023-2030 (US$)
Figure 7: Market Entry Strategy in European Hemostats Market 2023-2030
Figure 8: Ecosystem Analysis in European Hemostats Market 2023
Figure 9: Average Selling Price in European Hemostats Market 2023-2030
Figure 10: Top Opportunites in European Hemostats Market 2023-2030
Figure 11: Market Life Cycle Analysis in European Hemostats Market
Figure 12: GlobalBy Type European Hemostats Market Revenue, 2023-2030 ($)
Figure 13: GlobalBy Treatment European Hemostats Market Revenue, 2023-2030 ($)
Figure 14: GlobalBy End Users European Hemostats Market Revenue, 2023-2030 ($)
Figure 15: Global European Hemostats Market - By Geography
Figure 16: Global European Hemostats Market Value & Volume, By Geography, 2023-2030 ($)
Figure 17: Global European Hemostats Market CAGR, By Geography, 2023-2030 (%)
Figure 18: North America European Hemostats Market Value & Volume, 2023-2030 ($)
Figure 19: US European Hemostats Market Value & Volume, 2023-2030 ($)
Figure 20: US GDP and Population, 2023-2030 ($)
Figure 21: US GDP – Composition of 2023, By Sector of Origin
Figure 22: US Export and Import Value & Volume, 2023-2030 ($)
Figure 23: Canada European Hemostats Market Value & Volume, 2023-2030 ($)
Figure 24: Canada GDP and Population, 2023-2030 ($)
Figure 25: Canada GDP – Composition of 2023, By Sector of Origin
Figure 26: Canada Export and Import Value & Volume, 2023-2030 ($)
Figure 27: Mexico European Hemostats Market Value & Volume, 2023-2030 ($)
Figure 28: Mexico GDP and Population, 2023-2030 ($)
Figure 29: Mexico GDP – Composition of 2023, By Sector of Origin
Figure 30: Mexico Export and Import Value & Volume, 2023-2030 ($)
Figure 31: South America European Hemostats Market Value & Volume, 2023-2030 ($)
Figure 32: Brazil European Hemostats Market Value & Volume, 2023-2030 ($)
Figure 33: Brazil GDP and Population, 2023-2030 ($)
Figure 34: Brazil GDP – Composition of 2023, By Sector of Origin
Figure 35: Brazil Export and Import Value & Volume, 2023-2030 ($)
Figure 36: Venezuela European Hemostats Market Value & Volume, 2023-2030 ($)
Figure 37: Venezuela GDP and Population, 2023-2030 ($)
Figure 38: Venezuela GDP – Composition of 2023, By Sector of Origin
Figure 39: Venezuela Export and Import Value & Volume, 2023-2030 ($)
Figure 40: Argentina European Hemostats Market Value & Volume, 2023-2030 ($)
Figure 41: Argentina GDP and Population, 2023-2030 ($)
Figure 42: Argentina GDP – Composition of 2023, By Sector of Origin
Figure 43: Argentina Export and Import Value & Volume, 2023-2030 ($)
Figure 44: Ecuador European Hemostats Market Value & Volume, 2023-2030 ($)
Figure 45: Ecuador GDP and Population, 2023-2030 ($)
Figure 46: Ecuador GDP – Composition of 2023, By Sector of Origin
Figure 47: Ecuador Export and Import Value & Volume, 2023-2030 ($)
Figure 48: Peru European Hemostats Market Value & Volume, 2023-2030 ($)
Figure 49: Peru GDP and Population, 2023-2030 ($)
Figure 50: Peru GDP – Composition of 2023, By Sector of Origin
Figure 51: Peru Export and Import Value & Volume, 2023-2030 ($)
Figure 52: Colombia European Hemostats Market Value & Volume, 2023-2030 ($)
Figure 53: Colombia GDP and Population, 2023-2030 ($)
Figure 54: Colombia GDP – Composition of 2023, By Sector of Origin
Figure 55: Colombia Export and Import Value & Volume, 2023-2030 ($)
Figure 56: Costa Rica European Hemostats Market Value & Volume, 2023-2030 ($)
Figure 57: Costa Rica GDP and Population, 2023-2030 ($)
Figure 58: Costa Rica GDP – Composition of 2023, By Sector of Origin
Figure 59: Costa Rica Export and Import Value & Volume, 2023-2030 ($)
Figure 60: Europe European Hemostats Market Value & Volume, 2023-2030 ($)
Figure 61: U.K European Hemostats Market Value & Volume, 2023-2030 ($)
Figure 62: U.K GDP and Population, 2023-2030 ($)
Figure 63: U.K GDP – Composition of 2023, By Sector of Origin
Figure 64: U.K Export and Import Value & Volume, 2023-2030 ($)
Figure 65: Germany European Hemostats Market Value & Volume, 2023-2030 ($)
Figure 66: Germany GDP and Population, 2023-2030 ($)
Figure 67: Germany GDP – Composition of 2023, By Sector of Origin
Figure 68: Germany Export and Import Value & Volume, 2023-2030 ($)
Figure 69: Italy European Hemostats Market Value & Volume, 2023-2030 ($)
Figure 70: Italy GDP and Population, 2023-2030 ($)
Figure 71: Italy GDP – Composition of 2023, By Sector of Origin
Figure 72: Italy Export and Import Value & Volume, 2023-2030 ($)
Figure 73: France European Hemostats Market Value & Volume, 2023-2030 ($)
Figure 74: France GDP and Population, 2023-2030 ($)
Figure 75: France GDP – Composition of 2023, By Sector of Origin
Figure 76: France Export and Import Value & Volume, 2023-2030 ($)
Figure 77: Netherlands European Hemostats Market Value & Volume, 2023-2030 ($)
Figure 78: Netherlands GDP and Population, 2023-2030 ($)
Figure 79: Netherlands GDP – Composition of 2023, By Sector of Origin
Figure 80: Netherlands Export and Import Value & Volume, 2023-2030 ($)
Figure 81: Belgium European Hemostats Market Value & Volume, 2023-2030 ($)
Figure 82: Belgium GDP and Population, 2023-2030 ($)
Figure 83: Belgium GDP – Composition of 2023, By Sector of Origin
Figure 84: Belgium Export and Import Value & Volume, 2023-2030 ($)
Figure 85: Spain European Hemostats Market Value & Volume, 2023-2030 ($)
Figure 86: Spain GDP and Population, 2023-2030 ($)
Figure 87: Spain GDP – Composition of 2023, By Sector of Origin
Figure 88: Spain Export and Import Value & Volume, 2023-2030 ($)
Figure 89: Denmark European Hemostats Market Value & Volume, 2023-2030 ($)
Figure 90: Denmark GDP and Population, 2023-2030 ($)
Figure 91: Denmark GDP – Composition of 2023, By Sector of Origin
Figure 92: Denmark Export and Import Value & Volume, 2023-2030 ($)
Figure 93: APAC European Hemostats Market Value & Volume, 2023-2030 ($)
Figure 94: China European Hemostats Market Value & Volume, 2023-2030
Figure 95: China GDP and Population, 2023-2030 ($)
Figure 96: China GDP – Composition of 2023, By Sector of Origin
Figure 97: China Export and Import Value & Volume, 2023-2030 ($) European Hemostats Market China Export and Import Value & Volume, 2023-2030 ($)
Figure 98: Australia European Hemostats Market Value & Volume, 2023-2030 ($)
Figure 99: Australia GDP and Population, 2023-2030 ($)
Figure 100: Australia GDP – Composition of 2023, By Sector of Origin
Figure 101: Australia Export and Import Value & Volume, 2023-2030 ($)
Figure 102: South Korea European Hemostats Market Value & Volume, 2023-2030 ($)
Figure 103: South Korea GDP and Population, 2023-2030 ($)
Figure 104: South Korea GDP – Composition of 2023, By Sector of Origin
Figure 105: South Korea Export and Import Value & Volume, 2023-2030 ($)
Figure 106: India European Hemostats Market Value & Volume, 2023-2030 ($)
Figure 107: India GDP and Population, 2023-2030 ($)
Figure 108: India GDP – Composition of 2023, By Sector of Origin
Figure 109: India Export and Import Value & Volume, 2023-2030 ($)
Figure 110: Taiwan European Hemostats Market Value & Volume, 2023-2030 ($)
Figure 111: Taiwan GDP and Population, 2023-2030 ($)
Figure 112: Taiwan GDP – Composition of 2023, By Sector of Origin
Figure 113: Taiwan Export and Import Value & Volume, 2023-2030 ($)
Figure 114: Malaysia European Hemostats Market Value & Volume, 2023-2030 ($)
Figure 115: Malaysia GDP and Population, 2023-2030 ($)
Figure 116: Malaysia GDP – Composition of 2023, By Sector of Origin
Figure 117: Malaysia Export and Import Value & Volume, 2023-2030 ($)
Figure 118: Hong Kong European Hemostats Market Value & Volume, 2023-2030 ($)
Figure 119: Hong Kong GDP and Population, 2023-2030 ($)
Figure 120: Hong Kong GDP – Composition of 2023, By Sector of Origin
Figure 121: Hong Kong Export and Import Value & Volume, 2023-2030 ($)
Figure 122: Middle East & Africa European Hemostats Market Middle East & Africa 3D Printing Market Value & Volume, 2023-2030 ($)
Figure 123: Russia European Hemostats Market Value & Volume, 2023-2030 ($)
Figure 124: Russia GDP and Population, 2023-2030 ($)
Figure 125: Russia GDP – Composition of 2023, By Sector of Origin
Figure 126: Russia Export and Import Value & Volume, 2023-2030 ($)
Figure 127: Israel European Hemostats Market Value & Volume, 2023-2030 ($)
Figure 128: Israel GDP and Population, 2023-2030 ($)
Figure 129: Israel GDP – Composition of 2023, By Sector of Origin
Figure 130: Israel Export and Import Value & Volume, 2023-2030 ($)
Figure 131: Entropy Share, By Strategies, 2023-2030* (%) European Hemostats Market
Figure 132: Developments, 2023-2030* European Hemostats Market
Figure 133: Company 1 European Hemostats Market Net Revenue, By Years, 2023-2030* ($)
Figure 134: Company 1 European Hemostats Market Net Revenue Share, By Business segments, 2023 (%)
Figure 135: Company 1 European Hemostats Market Net Sales Share, By Geography, 2023 (%)
Figure 136: Company 2 European Hemostats Market Net Revenue, By Years, 2023-2030* ($)
Figure 137: Company 2 European Hemostats Market Net Revenue Share, By Business segments, 2023 (%)
Figure 138: Company 2 European Hemostats Market Net Sales Share, By Geography, 2023 (%)
Figure 139: Company 3 European Hemostats Market Net Revenue, By Years, 2023-2030* ($)
Figure 140: Company 3 European Hemostats Market Net Revenue Share, By Business segments, 2023 (%)
Figure 141: Company 3 European Hemostats Market Net Sales Share, By Geography, 2023 (%)
Figure 142: Company 4 European Hemostats Market Net Revenue, By Years, 2023-2030* ($)
Figure 143: Company 4 European Hemostats Market Net Revenue Share, By Business segments, 2023 (%)
Figure 144: Company 4 European Hemostats Market Net Sales Share, By Geography, 2023 (%)
Figure 145: Company 5 European Hemostats Market Net Revenue, By Years, 2023-2030* ($)
Figure 146: Company 5 European Hemostats Market Net Revenue Share, By Business segments, 2023 (%)
Figure 147: Company 5 European Hemostats Market Net Sales Share, By Geography, 2023 (%)
Figure 148: Company 6 European Hemostats Market Net Revenue, By Years, 2023-2030* ($)
Figure 149: Company 6 European Hemostats Market Net Revenue Share, By Business segments, 2023 (%)
Figure 150: Company 6 European Hemostats Market Net Sales Share, By Geography, 2023 (%)
Figure 151: Company 7 European Hemostats Market Net Revenue, By Years, 2023-2030* ($)
Figure 152: Company 7 European Hemostats Market Net Revenue Share, By Business segments, 2023 (%)
Figure 153: Company 7 European Hemostats Market Net Sales Share, By Geography, 2023 (%)
Figure 154: Company 8 European Hemostats Market Net Revenue, By Years, 2023-2030* ($)
Figure 155: Company 8 European Hemostats Market Net Revenue Share, By Business segments, 2023 (%)
Figure 156: Company 8 European Hemostats Market Net Sales Share, By Geography, 2023 (%)
Figure 157: Company 9 European Hemostats Market Net Revenue, By Years, 2023-2030* ($)
Figure 158: Company 9 European Hemostats Market Net Revenue Share, By Business segments, 2023 (%)
Figure 159: Company 9 European Hemostats Market Net Sales Share, By Geography, 2023 (%)
Figure 160: Company 10 European Hemostats Market Net Revenue, By Years, 2023-2030* ($)
Figure 161: Company 10 European Hemostats Market Net Revenue Share, By Business segments, 2023 (%)
Figure 162: Company 10 European Hemostats Market Net Sales Share, By Geography, 2023 (%)
Figure 163: Company 11 European Hemostats Market Net Revenue, By Years, 2023-2030* ($)
Figure 164: Company 11 European Hemostats Market Net Revenue Share, By Business segments, 2023 (%)
Figure 165: Company 11 European Hemostats Market Net Sales Share, By Geography, 2023 (%)
Figure 166: Company 12 European Hemostats Market Net Revenue, By Years, 2023-2030* ($)
Figure 167: Company 12 European Hemostats Market Net Revenue Share, By Business segments, 2023 (%)
Figure 168: Company 12 European Hemostats Market Net Sales Share, By Geography, 2023 (%)
Figure 169: Company 13 European Hemostats Market Net Revenue, By Years, 2023-2030* ($)
Figure 170: Company 13 European Hemostats Market Net Revenue Share, By Business segments, 2023 (%)
Figure 171: Company 13 European Hemostats Market Net Sales Share, By Geography, 2023 (%)
Figure 172: Company 14 European Hemostats Market Net Revenue, By Years, 2023-2030* ($)
Figure 173: Company 14 European Hemostats Market Net Revenue Share, By Business segments, 2023 (%)
Figure 174: Company 14 European Hemostats Market Net Sales Share, By Geography, 2023 (%)
Figure 175: Company 15 European Hemostats Market Net Revenue, By Years, 2023-2030* ($)
Figure 176: Company 15 European Hemostats Market Net Revenue Share, By Business segments, 2023 (%)
Figure 177: Company 15 European Hemostats Market Net Sales Share, By Geography, 2023 (%)