 Email
Email Print
Print


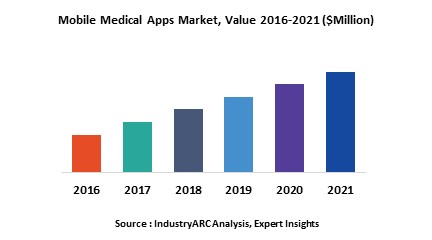
Mobile Medical Apps Market size is estimated to reach $8,61,000.40 Million by 2030, growing at a CAGR of 28.40% during the forecast period 2024-2030.
Mobile medical Apps are soft wares programmed to provide services related to health through devices such as smartphones, tablets and others. Globally, rising penetration of smartphones, tablets and other mobile platforms, growing demand for mobile medical Apps among physicians, rise in the awareness among people regarding mobile medical Apps and growing penetration of 3G and 4G networks are the prime growth drivers of mobile medical apps market. In addition, increase in adoption of mobile medical apps in emerging economies such as China, India and others, will create new opportunities for mobile medical apps market. However, lack of security of patient’s information, lack of skilled professionals, higher cost of the research and development, are the key restraints for mobile medical apps market.
Geographically, North America dominated the mobile medical apps market, followed by Europe because of prevalence of higher rate of chronic diseases and technological advancement. Asia Pacific is projected to have fastest growth, owing to rapidly increasing aging population, rise in consumer awareness, favourable government policies, increasing penetration of smart gadgets, 3G and 4G networks and growing need for more affordable treatment options, in developing nations such as China and India in this region. Among all the services, remote monitoring services has the highest market share in mobile medical apps market.
This report identifies the global mobile medical apps market size for the year 2014-2016 and forecast of the same for year 2021. It also highlights the market drivers, restraints, growth indicators, challenges and other key aspects with respect to global mobile medical apps market.
This report segments mobile medical apps market on the basis of connected device, apps, service, application and regional market as follows:
- Mobile Medical Apps Market, By Connected Device: Blood Glucose Meters, ECG Monitors, Blood Pressure Monitors, Pulse Oximeters, Peak Flow Meters, Neurological Monitoring Devices, Sleep Apnea Monitors. Multiparameter Trackers and Others
- Mobile Medical Apps Market, By Apps: Weight Loss, Women's Health, Personal Health Record and Medication
- Mobile Medical Apps Market, By Service: Diagnostic and Consultation, Treatment, Fitness and Wellness, Prevention and Healthcare System Strengthening
- The report has focused study on mobile medical apps market by basis of application such as: Nursing Tools, Drug References, Study Tools, Medical Reference and Clinical Support Systems
- This report has been further segmented into major regions, which includes detailed analysis of each region such as: North America, Europe, Asia-Pacific (APAC) and Rest of the World (RoW) covering all the major country level markets in each of the region
Sample Companies Profiled in this Report are:
- Medtronic PLC
- Philips Healthcare
- Omron Corporation
- Johnson & Johnson
- Oracle
List of Tables:
Table1: Mobile Medical Apps Market Overview 2023-2030
Table2: Mobile Medical Apps Market Leader Analysis 2023-2030 (US$)
Table3: Mobile Medical Apps Market Product Analysis 2023-2030 (US$)
Table4: Mobile Medical Apps Market End User Analysis 2023-2030 (US$)
Table5: Mobile Medical Apps Market Patent Analysis 2013-2023* (US$)
Table6: Mobile Medical Apps Market Financial Analysis 2023-2030 (US$)
Table7: Mobile Medical Apps Market Driver Analysis 2023-2030 (US$)
Table8: Mobile Medical Apps Market Challenges Analysis 2023-2030 (US$)
Table9: Mobile Medical Apps Market Constraint Analysis 2023-2030 (US$)
Table10: Mobile Medical Apps Market Supplier Bargaining Power Analysis 2023-2030 (US$)
Table11: Mobile Medical Apps Market Buyer Bargaining Power Analysis 2023-2030 (US$)
Table12: Mobile Medical Apps Market Threat of Substitutes Analysis 2023-2030 (US$)
Table13: Mobile Medical Apps Market Threat of New Entrants Analysis 2023-2030 (US$)
Table14: Mobile Medical Apps Market Degree of Competition Analysis 2023-2030 (US$)
Table15: Mobile Medical Apps Market Value Chain Analysis 2023-2030 (US$)
Table16: Mobile Medical Apps Market Pricing Analysis 2023-2030 (US$)
Table17: Mobile Medical Apps Market Opportunities Analysis 2023-2030 (US$)
Table18: Mobile Medical Apps Market Product Life Cycle Analysis 2023-2030 (US$)
Table19: Mobile Medical Apps Market Supplier Analysis 2023-2030 (US$)
Table20: Mobile Medical Apps Market Distributor Analysis 2023-2030 (US$)
Table21: Mobile Medical Apps Market Trend Analysis 2023-2030 (US$)
Table22: Mobile Medical Apps Market Size 2023 (US$)
Table23: Mobile Medical Apps Market Forecast Analysis 2023-2030 (US$)
Table24: Mobile Medical Apps Market Sales Forecast Analysis 2023-2030 (Units)
Table25: Mobile Medical Apps Market, Revenue & Volume, By Connected Device, 2023-2030 ($)
Table26: Mobile Medical Apps Market By Connected Device, Revenue & Volume, By Blood Glucose Meters, 2023-2030 ($)
Table27: Mobile Medical Apps Market By Connected Device, Revenue & Volume, By ECG Monitors, 2023-2030 ($)
Table28: Mobile Medical Apps Market By Connected Device, Revenue & Volume, By Blood Pressure Monitors, 2023-2030 ($)
Table29: Mobile Medical Apps Market By Connected Device, Revenue & Volume, By Pulse Oximeters, 2023-2030 ($)
Table30: Mobile Medical Apps Market By Connected Device, Revenue & Volume, By Peak Flow Meters, 2023-2030 ($)
Table31: Mobile Medical Apps Market, Revenue & Volume, By Apps, 2023-2030 ($)
Table32: Mobile Medical Apps Market By Apps, Revenue & Volume, By Weight Loss, 2023-2030 ($)
Table33: Mobile Medical Apps Market By Apps, Revenue & Volume, By Women's Health, 2023-2030 ($)
Table34: Mobile Medical Apps Market By Apps, Revenue & Volume, By Personal Health Record, 2023-2030 ($)
Table35: Mobile Medical Apps Market By Apps, Revenue & Volume, By Medication, 2023-2030 ($)
Table36: Mobile Medical Apps Market, Revenue & Volume, By Service, 2023-2030 ($)
Table37: Mobile Medical Apps Market By Service, Revenue & Volume, By Diagnostic and Consultation, 2023-2030 ($)
Table38: Mobile Medical Apps Market By Service, Revenue & Volume, By Treatment, 2023-2030 ($)
Table39: Mobile Medical Apps Market By Service, Revenue & Volume, By Fitness and Wellness, 2023-2030 ($)
Table40: Mobile Medical Apps Market By Service, Revenue & Volume, By Prevention, 2023-2030 ($)
Table41: Mobile Medical Apps Market By Service, Revenue & Volume, By Healthcare System Strengthening, 2023-2030 ($)
Table42: Mobile Medical Apps Market, Revenue & Volume, By Application, 2023-2030 ($)
Table43: Mobile Medical Apps Market By Application, Revenue & Volume, By Nursing Tools, 2023-2030 ($)
Table44: Mobile Medical Apps Market By Application, Revenue & Volume, By Drug References, 2023-2030 ($)
Table45: Mobile Medical Apps Market By Application, Revenue & Volume, By Study Tools, 2023-2030 ($)
Table46: Mobile Medical Apps Market By Application, Revenue & Volume, By Medical Reference, 2023-2030 ($)
Table47: Mobile Medical Apps Market By Application, Revenue & Volume, By Clinical Support Systems, 2023-2030 ($)
Table48: North America Mobile Medical Apps Market, Revenue & Volume, By Connected Device, 2023-2030 ($)
Table49: North America Mobile Medical Apps Market, Revenue & Volume, By Apps, 2023-2030 ($)
Table50: North America Mobile Medical Apps Market, Revenue & Volume, By Service, 2023-2030 ($)
Table51: North America Mobile Medical Apps Market, Revenue & Volume, By Application, 2023-2030 ($)
Table52: South america Mobile Medical Apps Market, Revenue & Volume, By Connected Device, 2023-2030 ($)
Table53: South america Mobile Medical Apps Market, Revenue & Volume, By Apps, 2023-2030 ($)
Table54: South america Mobile Medical Apps Market, Revenue & Volume, By Service, 2023-2030 ($)
Table55: South america Mobile Medical Apps Market, Revenue & Volume, By Application, 2023-2030 ($)
Table56: Europe Mobile Medical Apps Market, Revenue & Volume, By Connected Device, 2023-2030 ($)
Table57: Europe Mobile Medical Apps Market, Revenue & Volume, By Apps, 2023-2030 ($)
Table58: Europe Mobile Medical Apps Market, Revenue & Volume, By Service, 2023-2030 ($)
Table59: Europe Mobile Medical Apps Market, Revenue & Volume, By Application, 2023-2030 ($)
Table60: APAC Mobile Medical Apps Market, Revenue & Volume, By Connected Device, 2023-2030 ($)
Table61: APAC Mobile Medical Apps Market, Revenue & Volume, By Apps, 2023-2030 ($)
Table62: APAC Mobile Medical Apps Market, Revenue & Volume, By Service, 2023-2030 ($)
Table63: APAC Mobile Medical Apps Market, Revenue & Volume, By Application, 2023-2030 ($)
Table64: Middle East & Africa Mobile Medical Apps Market, Revenue & Volume, By Connected Device, 2023-2030 ($)
Table65: Middle East & Africa Mobile Medical Apps Market, Revenue & Volume, By Apps, 2023-2030 ($)
Table66: Middle East & Africa Mobile Medical Apps Market, Revenue & Volume, By Service, 2023-2030 ($)
Table67: Middle East & Africa Mobile Medical Apps Market, Revenue & Volume, By Application, 2023-2030 ($)
Table68: Russia Mobile Medical Apps Market, Revenue & Volume, By Connected Device, 2023-2030 ($)
Table69: Russia Mobile Medical Apps Market, Revenue & Volume, By Apps, 2023-2030 ($)
Table70: Russia Mobile Medical Apps Market, Revenue & Volume, By Service, 2023-2030 ($)
Table71: Russia Mobile Medical Apps Market, Revenue & Volume, By Application, 2023-2030 ($)
Table72: Israel Mobile Medical Apps Market, Revenue & Volume, By Connected Device, 2023-2030 ($)
Table73: Israel Mobile Medical Apps Market, Revenue & Volume, By Apps, 2023-2030 ($)
Table74: Israel Mobile Medical Apps Market, Revenue & Volume, By Service, 2023-2030 ($)
Table75: Israel Mobile Medical Apps Market, Revenue & Volume, By Application, 2023-2030 ($)
Table76: Top Companies 2023 (US$)Mobile Medical Apps Market, Revenue & Volume
Table77: Product Launch 2023-2030Mobile Medical Apps Market, Revenue & Volume
Table78: Mergers & Acquistions 2023-2030Mobile Medical Apps Market, Revenue & Volume
List of Figures:
Figure 1: Overview of Mobile Medical Apps Market 2023-2030
Figure 2: Market Share Analysis for Mobile Medical Apps Market 2023 (US$)
Figure 3: Product Comparison in Mobile Medical Apps Market 2023-2030 (US$)
Figure 4: End User Profile for Mobile Medical Apps Market 2023-2030 (US$)
Figure 5: Patent Application and Grant in Mobile Medical Apps Market 2013-2023* (US$)
Figure 6: Top 5 Companies Financial Analysis in Mobile Medical Apps Market 2023-2030 (US$)
Figure 7: Market Entry Strategy in Mobile Medical Apps Market 2023-2030
Figure 8: Ecosystem Analysis in Mobile Medical Apps Market 2023
Figure 9: Average Selling Price in Mobile Medical Apps Market 2023-2030
Figure 10: Top Opportunites in Mobile Medical Apps Market 2023-2030
Figure 11: Market Life Cycle Analysis in Mobile Medical Apps Market
Figure 12: GlobalBy Connected DeviceMobile Medical Apps Market Revenue, 2023-2030 ($)
Figure 13: GlobalBy AppsMobile Medical Apps Market Revenue, 2023-2030 ($)
Figure 14: GlobalBy ServiceMobile Medical Apps Market Revenue, 2023-2030 ($)
Figure 15: GlobalBy ApplicationMobile Medical Apps Market Revenue, 2023-2030 ($)
Figure 16: Global Mobile Medical Apps Market - By Geography
Figure 17: Global Mobile Medical Apps Market Value & Volume, By Geography, 2023-2030 ($)
Figure 18: Global Mobile Medical Apps Market CAGR, By Geography, 2023-2030 (%)
Figure 19: North America Mobile Medical Apps Market Value & Volume, 2023-2030 ($)
Figure 20: US Mobile Medical Apps Market Value & Volume, 2023-2030 ($)
Figure 21: US GDP and Population, 2023-2030 ($)
Figure 22: US GDP – Composition of 2023, By Sector of Origin
Figure 23: US Export and Import Value & Volume, 2023-2030 ($)
Figure 24: Canada Mobile Medical Apps Market Value & Volume, 2023-2030 ($)
Figure 25: Canada GDP and Population, 2023-2030 ($)
Figure 26: Canada GDP – Composition of 2023, By Sector of Origin
Figure 27: Canada Export and Import Value & Volume, 2023-2030 ($)
Figure 28: Mexico Mobile Medical Apps Market Value & Volume, 2023-2030 ($)
Figure 29: Mexico GDP and Population, 2023-2030 ($)
Figure 30: Mexico GDP – Composition of 2023, By Sector of Origin
Figure 31: Mexico Export and Import Value & Volume, 2023-2030 ($)
Figure 32: South America Mobile Medical Apps Market Value & Volume, 2023-2030 ($)
Figure 33: Brazil Mobile Medical Apps Market Value & Volume, 2023-2030 ($)
Figure 34: Brazil GDP and Population, 2023-2030 ($)
Figure 35: Brazil GDP – Composition of 2023, By Sector of Origin
Figure 36: Brazil Export and Import Value & Volume, 2023-2030 ($)
Figure 37: Venezuela Mobile Medical Apps Market Value & Volume, 2023-2030 ($)
Figure 38: Venezuela GDP and Population, 2023-2030 ($)
Figure 39: Venezuela GDP – Composition of 2023, By Sector of Origin
Figure 40: Venezuela Export and Import Value & Volume, 2023-2030 ($)
Figure 41: Argentina Mobile Medical Apps Market Value & Volume, 2023-2030 ($)
Figure 42: Argentina GDP and Population, 2023-2030 ($)
Figure 43: Argentina GDP – Composition of 2023, By Sector of Origin
Figure 44: Argentina Export and Import Value & Volume, 2023-2030 ($)
Figure 45: Ecuador Mobile Medical Apps Market Value & Volume, 2023-2030 ($)
Figure 46: Ecuador GDP and Population, 2023-2030 ($)
Figure 47: Ecuador GDP – Composition of 2023, By Sector of Origin
Figure 48: Ecuador Export and Import Value & Volume, 2023-2030 ($)
Figure 49: Peru Mobile Medical Apps Market Value & Volume, 2023-2030 ($)
Figure 50: Peru GDP and Population, 2023-2030 ($)
Figure 51: Peru GDP – Composition of 2023, By Sector of Origin
Figure 52: Peru Export and Import Value & Volume, 2023-2030 ($)
Figure 53: Colombia Mobile Medical Apps Market Value & Volume, 2023-2030 ($)
Figure 54: Colombia GDP and Population, 2023-2030 ($)
Figure 55: Colombia GDP – Composition of 2023, By Sector of Origin
Figure 56: Colombia Export and Import Value & Volume, 2023-2030 ($)
Figure 57: Costa Rica Mobile Medical Apps Market Value & Volume, 2023-2030 ($)
Figure 58: Costa Rica GDP and Population, 2023-2030 ($)
Figure 59: Costa Rica GDP – Composition of 2023, By Sector of Origin
Figure 60: Costa Rica Export and Import Value & Volume, 2023-2030 ($)
Figure 61: Europe Mobile Medical Apps Market Value & Volume, 2023-2030 ($)
Figure 62: U.K Mobile Medical Apps Market Value & Volume, 2023-2030 ($)
Figure 63: U.K GDP and Population, 2023-2030 ($)
Figure 64: U.K GDP – Composition of 2023, By Sector of Origin
Figure 65: U.K Export and Import Value & Volume, 2023-2030 ($)
Figure 66: Germany Mobile Medical Apps Market Value & Volume, 2023-2030 ($)
Figure 67: Germany GDP and Population, 2023-2030 ($)
Figure 68: Germany GDP – Composition of 2023, By Sector of Origin
Figure 69: Germany Export and Import Value & Volume, 2023-2030 ($)
Figure 70: Italy Mobile Medical Apps Market Value & Volume, 2023-2030 ($)
Figure 71: Italy GDP and Population, 2023-2030 ($)
Figure 72: Italy GDP – Composition of 2023, By Sector of Origin
Figure 73: Italy Export and Import Value & Volume, 2023-2030 ($)
Figure 74: France Mobile Medical Apps Market Value & Volume, 2023-2030 ($)
Figure 75: France GDP and Population, 2023-2030 ($)
Figure 76: France GDP – Composition of 2023, By Sector of Origin
Figure 77: France Export and Import Value & Volume, 2023-2030 ($)
Figure 78: Netherlands Mobile Medical Apps Market Value & Volume, 2023-2030 ($)
Figure 79: Netherlands GDP and Population, 2023-2030 ($)
Figure 80: Netherlands GDP – Composition of 2023, By Sector of Origin
Figure 81: Netherlands Export and Import Value & Volume, 2023-2030 ($)
Figure 82: Belgium Mobile Medical Apps Market Value & Volume, 2023-2030 ($)
Figure 83: Belgium GDP and Population, 2023-2030 ($)
Figure 84: Belgium GDP – Composition of 2023, By Sector of Origin
Figure 85: Belgium Export and Import Value & Volume, 2023-2030 ($)
Figure 86: Spain Mobile Medical Apps Market Value & Volume, 2023-2030 ($)
Figure 87: Spain GDP and Population, 2023-2030 ($)
Figure 88: Spain GDP – Composition of 2023, By Sector of Origin
Figure 89: Spain Export and Import Value & Volume, 2023-2030 ($)
Figure 90: Denmark Mobile Medical Apps Market Value & Volume, 2023-2030 ($)
Figure 91: Denmark GDP and Population, 2023-2030 ($)
Figure 92: Denmark GDP – Composition of 2023, By Sector of Origin
Figure 93: Denmark Export and Import Value & Volume, 2023-2030 ($)
Figure 94: APAC Mobile Medical Apps Market Value & Volume, 2023-2030 ($)
Figure 95: China Mobile Medical Apps Market Value & Volume, 2023-2030
Figure 96: China GDP and Population, 2023-2030 ($)
Figure 97: China GDP – Composition of 2023, By Sector of Origin
Figure 98: China Export and Import Value & Volume, 2023-2030 ($)Mobile Medical Apps Market China Export and Import Value & Volume, 2023-2030 ($)
Figure 99: Australia Mobile Medical Apps Market Value & Volume, 2023-2030 ($)
Figure 100: Australia GDP and Population, 2023-2030 ($)
Figure 101: Australia GDP – Composition of 2023, By Sector of Origin
Figure 102: Australia Export and Import Value & Volume, 2023-2030 ($)
Figure 103: South Korea Mobile Medical Apps Market Value & Volume, 2023-2030 ($)
Figure 104: South Korea GDP and Population, 2023-2030 ($)
Figure 105: South Korea GDP – Composition of 2023, By Sector of Origin
Figure 106: South Korea Export and Import Value & Volume, 2023-2030 ($)
Figure 107: India Mobile Medical Apps Market Value & Volume, 2023-2030 ($)
Figure 108: India GDP and Population, 2023-2030 ($)
Figure 109: India GDP – Composition of 2023, By Sector of Origin
Figure 110: India Export and Import Value & Volume, 2023-2030 ($)
Figure 111: Taiwan Mobile Medical Apps Market Value & Volume, 2023-2030 ($)
Figure 112: Taiwan GDP and Population, 2023-2030 ($)
Figure 113: Taiwan GDP – Composition of 2023, By Sector of Origin
Figure 114: Taiwan Export and Import Value & Volume, 2023-2030 ($)
Figure 115: Malaysia Mobile Medical Apps Market Value & Volume, 2023-2030 ($)
Figure 116: Malaysia GDP and Population, 2023-2030 ($)
Figure 117: Malaysia GDP – Composition of 2023, By Sector of Origin
Figure 118: Malaysia Export and Import Value & Volume, 2023-2030 ($)
Figure 119: Hong Kong Mobile Medical Apps Market Value & Volume, 2023-2030 ($)
Figure 120: Hong Kong GDP and Population, 2023-2030 ($)
Figure 121: Hong Kong GDP – Composition of 2023, By Sector of Origin
Figure 122: Hong Kong Export and Import Value & Volume, 2023-2030 ($)
Figure 123: Middle East & Africa Mobile Medical Apps Market Middle East & Africa 3D Printing Market Value & Volume, 2023-2030 ($)
Figure 124: Russia Mobile Medical Apps Market Value & Volume, 2023-2030 ($)
Figure 125: Russia GDP and Population, 2023-2030 ($)
Figure 126: Russia GDP – Composition of 2023, By Sector of Origin
Figure 127: Russia Export and Import Value & Volume, 2023-2030 ($)
Figure 128: Israel Mobile Medical Apps Market Value & Volume, 2023-2030 ($)
Figure 129: Israel GDP and Population, 2023-2030 ($)
Figure 130: Israel GDP – Composition of 2023, By Sector of Origin
Figure 131: Israel Export and Import Value & Volume, 2023-2030 ($)
Figure 132: Entropy Share, By Strategies, 2023-2030* (%)Mobile Medical Apps Market
Figure 133: Developments, 2023-2030*Mobile Medical Apps Market
Figure 134: Company 1 Mobile Medical Apps Market Net Revenue, By Years, 2023-2030* ($)
Figure 135: Company 1 Mobile Medical Apps Market Net Revenue Share, By Business segments, 2023 (%)
Figure 136: Company 1 Mobile Medical Apps Market Net Sales Share, By Geography, 2023 (%)
Figure 137: Company 2 Mobile Medical Apps Market Net Revenue, By Years, 2023-2030* ($)
Figure 138: Company 2 Mobile Medical Apps Market Net Revenue Share, By Business segments, 2023 (%)
Figure 139: Company 2 Mobile Medical Apps Market Net Sales Share, By Geography, 2023 (%)
Figure 140: Company 3 Mobile Medical Apps Market Net Revenue, By Years, 2023-2030* ($)
Figure 141: Company 3 Mobile Medical Apps Market Net Revenue Share, By Business segments, 2023 (%)
Figure 142: Company 3 Mobile Medical Apps Market Net Sales Share, By Geography, 2023 (%)
Figure 143: Company 4 Mobile Medical Apps Market Net Revenue, By Years, 2023-2030* ($)
Figure 144: Company 4 Mobile Medical Apps Market Net Revenue Share, By Business segments, 2023 (%)
Figure 145: Company 4 Mobile Medical Apps Market Net Sales Share, By Geography, 2023 (%)
Figure 146: Company 5 Mobile Medical Apps Market Net Revenue, By Years, 2023-2030* ($)
Figure 147: Company 5 Mobile Medical Apps Market Net Revenue Share, By Business segments, 2023 (%)
Figure 148: Company 5 Mobile Medical Apps Market Net Sales Share, By Geography, 2023 (%)
Figure 149: Company 6 Mobile Medical Apps Market Net Revenue, By Years, 2023-2030* ($)
Figure 150: Company 6 Mobile Medical Apps Market Net Revenue Share, By Business segments, 2023 (%)
Figure 151: Company 6 Mobile Medical Apps Market Net Sales Share, By Geography, 2023 (%)
Figure 152: Company 7 Mobile Medical Apps Market Net Revenue, By Years, 2023-2030* ($)
Figure 153: Company 7 Mobile Medical Apps Market Net Revenue Share, By Business segments, 2023 (%)
Figure 154: Company 7 Mobile Medical Apps Market Net Sales Share, By Geography, 2023 (%)
Figure 155: Company 8 Mobile Medical Apps Market Net Revenue, By Years, 2023-2030* ($)
Figure 156: Company 8 Mobile Medical Apps Market Net Revenue Share, By Business segments, 2023 (%)
Figure 157: Company 8 Mobile Medical Apps Market Net Sales Share, By Geography, 2023 (%)
Figure 158: Company 9 Mobile Medical Apps Market Net Revenue, By Years, 2023-2030* ($)
Figure 159: Company 9 Mobile Medical Apps Market Net Revenue Share, By Business segments, 2023 (%)
Figure 160: Company 9 Mobile Medical Apps Market Net Sales Share, By Geography, 2023 (%)
Figure 161: Company 10 Mobile Medical Apps Market Net Revenue, By Years, 2023-2030* ($)
Figure 162: Company 10 Mobile Medical Apps Market Net Revenue Share, By Business segments, 2023 (%)
Figure 163: Company 10 Mobile Medical Apps Market Net Sales Share, By Geography, 2023 (%)
Figure 164: Company 11 Mobile Medical Apps Market Net Revenue, By Years, 2023-2030* ($)
Figure 165: Company 11 Mobile Medical Apps Market Net Revenue Share, By Business segments, 2023 (%)
Figure 166: Company 11 Mobile Medical Apps Market Net Sales Share, By Geography, 2023 (%)
Figure 167: Company 12 Mobile Medical Apps Market Net Revenue, By Years, 2023-2030* ($)
Figure 168: Company 12 Mobile Medical Apps Market Net Revenue Share, By Business segments, 2023 (%)
Figure 169: Company 12 Mobile Medical Apps Market Net Sales Share, By Geography, 2023 (%)
Figure 170: Company 13 Mobile Medical Apps Market Net Revenue, By Years, 2023-2030* ($)
Figure 171: Company 13 Mobile Medical Apps Market Net Revenue Share, By Business segments, 2023 (%)
Figure 172: Company 13 Mobile Medical Apps Market Net Sales Share, By Geography, 2023 (%)
Figure 173: Company 14 Mobile Medical Apps Market Net Revenue, By Years, 2023-2030* ($)
Figure 174: Company 14 Mobile Medical Apps Market Net Revenue Share, By Business segments, 2023 (%)
Figure 175: Company 14 Mobile Medical Apps Market Net Sales Share, By Geography, 2023 (%)
Figure 176: Company 15 Mobile Medical Apps Market Net Revenue, By Years, 2023-2030* ($)
Figure 177: Company 15 Mobile Medical Apps Market Net Revenue Share, By Business segments, 2023 (%)
Figure 178: Company 15 Mobile Medical Apps Market Net Sales Share, By Geography, 2023 (%)