 Email
Email Print
Print


South Asia Polyisobutylene Market - By Product Type , By Application , By End-use Industry , By Geography - Global Opportunity Analysis & Industry Forecast, 2024 - 2030
South Asia Polyisobutylene Market Overview
The South Asia Polyisobutylene Market Size is forecast to reach $ 178.87 Million by 2030, at a CAGR of 5.40% during forecast period 2024-2030.Polyisobutylene (PIB) is a synthetic polymer made by polymerizing isobutylene with aluminum chloride or boron-trifluoride catalyst at low temperatures in liquid ethylene, methylene chloride, or hexane. Polyisobutylene (PIB) has beneficial properties, such as low gas or moisture permeability, high thickening efficiency and other similar property, which enhance adhesion and lubrication feasibility. Thus, it is often utilized in various applications, including adhesives and sealants, lubrication and more. The growth of the South Asia transport industry is fueling the demand for polyisobutylene-based lubricants, which, in turn, is driving the market growth. However, in 2020, the Covid-19 pandemic restricted industrial activities in South Asia, which resulted in a decline in production activities. For instance, according to the Organisation Internationale des Constructeurs d'Automobiles (OICA), in 2020, automotive production in India and Pakistan declined by 3% and 85% respectively over 2019. However, in 2021, the growth in the production activities related to automotive, electrical & electronics and others fueled the South Asia polyisobutylene industry growth in South Asia. Also, the surging building and construction activities in the South Asia region are projected to boost the demand for polyisobutylene-based adhesives and sealants. This will lead to the South Asia polyisobutylene market size growth in upcoming years.
Report Coverage
The report: "South Asia Polyisobutylene Market Report – Forecast (2024-2030)” by IndustryARC, covers an in-depth analysis of the following segments in the South Asia Polyisobutylene Market.
Key Takeaways
- India dominated the South Asia Polyisobutylene Market, owing to the growing automotive industry in the country. For instance, according to the Organisation Internationale des Constructeurs d'Automobiles (OICA), in 2020, the automotive production in India was 3,381,819 units and in 2021, it was 4,399,112 units, an increase of 30%.
- The increasing investments in the South Asian electrical and electronics industry are fueling the demand for materials such as polyisobutylene to ensure effective insulation. This factor is driving the South Asia polyisobutylene market growth.
- Moreover, the surging adoption of Wrap films in South Asia's food & beverage and personal care industry to safeguard the products from leakage is propelling the market growth.
- However, the availability of substitute products such as styrene-butadiene rubber, nitrile rubber and many more are anticipated to restrict the South Asia Polyisobutylene industry growth during the upcoming years.
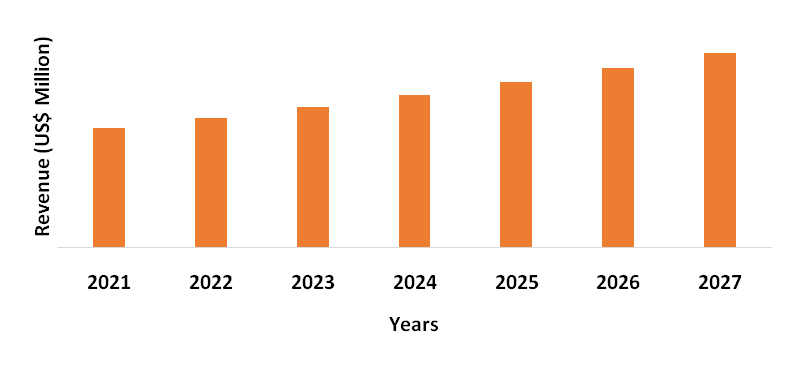
Figure: India Polyisobutylene Market Revenue, 2021-2027 (US$ Million)
For more details on this report - Request for Sample
South Asia Polyisobutylene Market Segment Analysis – By Application
The Lubricants and Greases segment held the largest South Asia Polyisobutylene Market share in 2021 and is forecasted to grow at a CAGR of 5.9% during the forecast period 2024-2030. Polyisobutylene a synthetic polymer produced from aluminum chloride or boron-trifluoride catalyst has the distinct advantages of high-temperature performance, clean burn-off and food safety. Thus, owing to these properties, it is often used as a base oil in the manufacturing of synthetic lubricants. Furthermore, polyisobutylenes provide operational comfort to lubricant formulators, allowing them to devise and optimize lubricant formulations with greater ease. Hence, due to the various uses of polyisobutylene, its application in lubrication and grease is increasing in South Asia, which, in turn, is propelling market growth.
South Asia Polyisobutylene Market Segment Analysis – By End-use Industry
The Transport segment held the largest South Asia Polyisobutylene Market share in 2021 and is forecasted to grow at a CAGR of 6.3% during the forecast period 2024-2030. Polyisobutylene-based lubricants are utilized in automotive, aerospace, marine and locomotive vehicles to safeguard the vehicles from wear and tear. Also, the polyisobutylene-based plasticizer is deployed in the manufacturing of automotive and aerospace tires. South Asia is increasing its capacity to become a globally competitive leader in the automotive manufacturing sector. Thus, it is attracting international players to invest in the automotive industry, providing incentive benefits and other similar factors are key determinants driving the automotive industry growth. For instance, according to the Organisation Internationale des Constructeurs d'Automobiles (OICA), in 2020, the automotive production in Pakistan was 117,375 units and in 2021, it was 238,702 units, an increase of 103%. Thus, the growth of the transport industry in the South Asia region is fueling the demand for lubricants and plasticizers. This, in turn, is accelerating market growth.
South Asia Polyisobutylene Market Segment Analysis – By Country
India is the dominating region as it held the largest South Asia Polyisobutylene Market share in 2021 up to 65%. India has emerged as the world's fastest-growing major economy and is predicted to be one of the top three economic powers in the next 10-15 years, owing to its robust democracy and strong relationships. The transport industry, building & construction and other sectors are key contributors to the country's growth. The factors such as India's increasing disposable income, the rapid pace of industrialization and the expansion of the logistics sector are driving the demand for light commercial vehicles, marine ships and other similar transport vehicles. This, in turn, is fueling the transport industry's growth in India. For instance, according to the Organisation Internationale des Constructeurs d'Automobiles (OICA), in 2020, the light commercial vehicle production in India was 385,691 units and in 2021, it was 486,911 units, an increase of 26%. Moreover, Airbus and Tata Aircraft formed a partnership in September 2021 to manufacture aircraft in India. The new facility's construction will begin at the end of 2022 and will be completed by the end of 2023. Also, the aerospace sector of India is aided by the government's "Make in India" policy, which encourages global firms to invest in and optimize the production process. Therefore, the growth of the transport industry in India is aiding the South Asia polyisobutylene market size growth.
South Asia Polyisobutylene Market Drivers
Surging Commercial Construction Activities in South Asia
Polyisobutylene a synthetic polymer manufactured from aluminum chloride or boron-trifluoride catalyst is a superior additive for industrial adhesives due to its high tackiness and water resistance. Thus, polyisobutylene-based adhesives are often used in commercial construction projects associated with malls, airports, hospitals and more to reduce the moisture content. The economic growth of the South Asian countries and surging government investments in key commercial projects are driving commercial construction activities in the region. For instance, in December 2019, construction work started on Hazrat Shahjalal International Airport Terminal 3, in Bangladesh. The project is been constructed on 542,000 square meters of land. The project completion year is the end of 2023. Moreover, as of June 2022, the Winston Mall & Residential space project is under construction in Pakistan. This project will be complete by the end of 2024. Thus, the surging commercial construction projects in South Asia are fueling the demand for adhesives and sealants. This, in turn, is driving the South Asia polyisobutylene market growth.
Growth Demand for Wrap Films
Polyisobutylene is used as an adhesion promoter in the production of stretch wrap films because the high molecular weight polyisobutylene content in the base polyethylene and matrix achieves superior stickiness in the dry granules, which are dry free flow granules. The factors such as South Asia's growth of the processed food industry, increasing agriculture production and other factors are driving the demand for wrap films. For instance, according to the Pakistan Economic Survey 2020-21, Pakistan's agriculture sector's performance in 2020-21 is generally encouraging, growing by 2.77 percent against a target of 2.8 percent. Moreover, according to Invest India, the food processing industry of India has grown at an average annual rate of around 11.18 percent over the last five years ending 2019-20. Hence, the growth of the agriculture and food processing industry in South Asia is boosting the demand for wrap films, which, in turn, is driving market growth.
South Asia Polyisobutylene Market Challenge
Availability of Substitute Products
There are various substitutes for polyisobutylene, including styrene-butadiene rubber, nitrile rubber and many more. These substitutes have various similar and superior properties and advantages over polyisobutylene, which may limit the market growth in South Asia. For instance, the abrasion resistance and crack endurance of styrene-butadiene rubber are superior in comparison to polyisobutylene. It also holds up well over time and has a good compression set and water resistance. The nitrile rubber on the other hand offers superior abrasion resistance, good rebound, high tear resistance, efficient non-polar solvent resistance and good water resistance. These properties are equally useful over polyisobutylene. Therefore, the efficient and similar performance of styrene-butadiene rubber, nitrile rubber and many more over polyisobutylene are likely to impact the South Asia polyisobutylene industry growth.
South Asia Polyisobutylene Industry Outlook
Technology launches, acquisitions and increased R&D activities are key strategies adopted by players in the South Asia Polyisobutylene Market. The top 10 companies in the South Asia Polyisobutylene market are:
- Kothari Petrochemicals Ltd.
- Reliance Industries
- J M Baxi & Co.
- BASF SE
- Chevron Corporation
- Lubrizol Corporation
- Exxonmobil
- Lanxess
- LG Chem
- ZEON Corporation
Key Market Players:
The Top 5 companies in the South Asia Polyisobutylene Market are:
- Kothari Petrochemicals Ltd.
- BASF SE
- Chevron Oronite Company LLC.
- Lubrizol Corporation
- Merck KGaA
For more Chemicals and Materials related reports, please click here
List of Tables:
Table 1: South Asia Polyisobutylene Market Overview 2023-2030
Table 2: South Asia Polyisobutylene Market Leader Analysis 2023-2030 (US$)
Table 3: South Asia Polyisobutylene Market Product Analysis 2023-2030 (US$)
Table 4: South Asia Polyisobutylene Market End User Analysis 2023-2030 (US$)
Table 5: South Asia Polyisobutylene Market Patent Analysis 2013-2023* (US$)
Table 6: South Asia Polyisobutylene Market Financial Analysis 2023-2030 (US$)
Table 7: South Asia Polyisobutylene Market Driver Analysis 2023-2030 (US$)
Table 8: South Asia Polyisobutylene Market Challenges Analysis 2023-2030 (US$)
Table 9: South Asia Polyisobutylene Market Constraint Analysis 2023-2030 (US$)
Table 10: South Asia Polyisobutylene Market Supplier Bargaining Power Analysis 2023-2030 (US$)
Table 11: South Asia Polyisobutylene Market Buyer Bargaining Power Analysis 2023-2030 (US$)
Table 12: South Asia Polyisobutylene Market Threat of Substitutes Analysis 2023-2030 (US$)
Table 13: South Asia Polyisobutylene Market Threat of New Entrants Analysis 2023-2030 (US$)
Table 14: South Asia Polyisobutylene Market Degree of Competition Analysis 2023-2030 (US$)
Table 15: South Asia Polyisobutylene Market Value Chain Analysis 2023-2030 (US$)
Table 16: South Asia Polyisobutylene Market Pricing Analysis 2023-2030 (US$)
Table 17: South Asia Polyisobutylene Market Opportunities Analysis 2023-2030 (US$)
Table 18: South Asia Polyisobutylene Market Product Life Cycle Analysis 2023-2030 (US$)
Table 19: South Asia Polyisobutylene Market Supplier Analysis 2023-2030 (US$)
Table 20: South Asia Polyisobutylene Market Distributor Analysis 2023-2030 (US$)
Table 21: South Asia Polyisobutylene Market Trend Analysis 2023-2030 (US$)
Table 22: South Asia Polyisobutylene Market Size 2023 (US$)
Table 23: South Asia Polyisobutylene Market Forecast Analysis 2023-2030 (US$)
Table 24: South Asia Polyisobutylene Market Sales Forecast Analysis 2023-2030 (Units)
Table 25: South Asia Polyisobutylene Market, Revenue & Volume, By Product Type, 2023-2030 ($)
Table 26: South Asia Polyisobutylene Market By Product Type, Revenue & Volume, By High Molecular Weight, 2023-2030 ($)
Table 27: South Asia Polyisobutylene Market By Product Type, Revenue & Volume, By Medium Molecular Weight, 2023-2030 ($)
Table 28: South Asia Polyisobutylene Market By Product Type, Revenue & Volume, By Low Molecular Weight, 2023-2030 ($)
Table 29: South Asia Polyisobutylene Market, Revenue & Volume, By Application, 2023-2030 ($)
Table 30: South Asia Polyisobutylene Market By Application, Revenue & Volume, By Automotive, 2023-2030 ($)
Table 31: South Asia Polyisobutylene Market By Application, Revenue & Volume, By Additive, 2023-2030 ($)
Table 32: North America South Asia Polyisobutylene Market, Revenue & Volume, By Product Type, 2023-2030 ($)
Table 33: North America South Asia Polyisobutylene Market, Revenue & Volume, By Application, 2023-2030 ($)
Table 34: South america South Asia Polyisobutylene Market, Revenue & Volume, By Product Type, 2023-2030 ($)
Table 35: South america South Asia Polyisobutylene Market, Revenue & Volume, By Application, 2023-2030 ($)
Table 36: Europe South Asia Polyisobutylene Market, Revenue & Volume, By Product Type, 2023-2030 ($)
Table 37: Europe South Asia Polyisobutylene Market, Revenue & Volume, By Application, 2023-2030 ($)
Table 38: APAC South Asia Polyisobutylene Market, Revenue & Volume, By Product Type, 2023-2030 ($)
Table 39: APAC South Asia Polyisobutylene Market, Revenue & Volume, By Application, 2023-2030 ($)
Table 40: Middle East & Africa South Asia Polyisobutylene Market, Revenue & Volume, By Product Type, 2023-2030 ($)
Table 41: Middle East & Africa South Asia Polyisobutylene Market, Revenue & Volume, By Application, 2023-2030 ($)
Table 42: Russia South Asia Polyisobutylene Market, Revenue & Volume, By Product Type, 2023-2030 ($)
Table 43: Russia South Asia Polyisobutylene Market, Revenue & Volume, By Application, 2023-2030 ($)
Table 44: Israel South Asia Polyisobutylene Market, Revenue & Volume, By Product Type, 2023-2030 ($)
Table 45: Israel South Asia Polyisobutylene Market, Revenue & Volume, By Application, 2023-2030 ($)
Table 46: Top Companies 2023 (US$) South Asia Polyisobutylene Market, Revenue & Volume
Table 47: Product Launch 2023-2030 South Asia Polyisobutylene Market, Revenue & Volume
Table 48: Mergers & Acquistions 2023-2030 South Asia Polyisobutylene Market, Revenue & Volume
List of Figures:
Figure 1: Overview of South Asia Polyisobutylene Market 2023-2030
Figure 2: Market Share Analysis for South Asia Polyisobutylene Market 2023 (US$)
Figure 3: Product Comparison in South Asia Polyisobutylene Market 2023-2030 (US$)
Figure 4: End User Profile for South Asia Polyisobutylene Market 2023-2030 (US$)
Figure 5: Patent Application and Grant in South Asia Polyisobutylene Market 2013-2023* (US$)
Figure 6: Top 5 Companies Financial Analysis in South Asia Polyisobutylene Market 2023-2030 (US$)
Figure 7: Market Entry Strategy in South Asia Polyisobutylene Market 2023-2030
Figure 8: Ecosystem Analysis in South Asia Polyisobutylene Market 2023
Figure 9: Average Selling Price in South Asia Polyisobutylene Market 2023-2030
Figure 10: Top Opportunites in South Asia Polyisobutylene Market 2023-2030
Figure 11: Market Life Cycle Analysis in South Asia Polyisobutylene Market
Figure 12: GlobalBy Product Type South Asia Polyisobutylene Market Revenue, 2023-2030 ($)
Figure 13: GlobalBy Application South Asia Polyisobutylene Market Revenue, 2023-2030 ($)
Figure 14: Global South Asia Polyisobutylene Market - By Geography
Figure 15: Global South Asia Polyisobutylene Market Value & Volume, By Geography, 2023-2030 ($)
Figure 16: Global South Asia Polyisobutylene Market CAGR, By Geography, 2023-2030 (%)
Figure 17: North America South Asia Polyisobutylene Market Value & Volume, 2023-2030 ($)
Figure 18: US South Asia Polyisobutylene Market Value & Volume, 2023-2030 ($)
Figure 19: US GDP and Population, 2023-2030 ($)
Figure 20: US GDP – Composition of 2023, By Sector of Origin
Figure 21: US Export and Import Value & Volume, 2023-2030 ($)
Figure 22: Canada South Asia Polyisobutylene Market Value & Volume, 2023-2030 ($)
Figure 23: Canada GDP and Population, 2023-2030 ($)
Figure 24: Canada GDP – Composition of 2023, By Sector of Origin
Figure 25: Canada Export and Import Value & Volume, 2023-2030 ($)
Figure 26: Mexico South Asia Polyisobutylene Market Value & Volume, 2023-2030 ($)
Figure 27: Mexico GDP and Population, 2023-2030 ($)
Figure 28: Mexico GDP – Composition of 2023, By Sector of Origin
Figure 29: Mexico Export and Import Value & Volume, 2023-2030 ($)
Figure 30: South America South Asia Polyisobutylene Market Value & Volume, 2023-2030 ($)
Figure 31: Brazil South Asia Polyisobutylene Market Value & Volume, 2023-2030 ($)
Figure 32: Brazil GDP and Population, 2023-2030 ($)
Figure 33: Brazil GDP – Composition of 2023, By Sector of Origin
Figure 34: Brazil Export and Import Value & Volume, 2023-2030 ($)
Figure 35: Venezuela South Asia Polyisobutylene Market Value & Volume, 2023-2030 ($)
Figure 36: Venezuela GDP and Population, 2023-2030 ($)
Figure 37: Venezuela GDP – Composition of 2023, By Sector of Origin
Figure 38: Venezuela Export and Import Value & Volume, 2023-2030 ($)
Figure 39: Argentina South Asia Polyisobutylene Market Value & Volume, 2023-2030 ($)
Figure 40: Argentina GDP and Population, 2023-2030 ($)
Figure 41: Argentina GDP – Composition of 2023, By Sector of Origin
Figure 42: Argentina Export and Import Value & Volume, 2023-2030 ($)
Figure 43: Ecuador South Asia Polyisobutylene Market Value & Volume, 2023-2030 ($)
Figure 44: Ecuador GDP and Population, 2023-2030 ($)
Figure 45: Ecuador GDP – Composition of 2023, By Sector of Origin
Figure 46: Ecuador Export and Import Value & Volume, 2023-2030 ($)
Figure 47: Peru South Asia Polyisobutylene Market Value & Volume, 2023-2030 ($)
Figure 48: Peru GDP and Population, 2023-2030 ($)
Figure 49: Peru GDP – Composition of 2023, By Sector of Origin
Figure 50: Peru Export and Import Value & Volume, 2023-2030 ($)
Figure 51: Colombia South Asia Polyisobutylene Market Value & Volume, 2023-2030 ($)
Figure 52: Colombia GDP and Population, 2023-2030 ($)
Figure 53: Colombia GDP – Composition of 2023, By Sector of Origin
Figure 54: Colombia Export and Import Value & Volume, 2023-2030 ($)
Figure 55: Costa Rica South Asia Polyisobutylene Market Value & Volume, 2023-2030 ($)
Figure 56: Costa Rica GDP and Population, 2023-2030 ($)
Figure 57: Costa Rica GDP – Composition of 2023, By Sector of Origin
Figure 58: Costa Rica Export and Import Value & Volume, 2023-2030 ($)
Figure 59: Europe South Asia Polyisobutylene Market Value & Volume, 2023-2030 ($)
Figure 60: U.K South Asia Polyisobutylene Market Value & Volume, 2023-2030 ($)
Figure 61: U.K GDP and Population, 2023-2030 ($)
Figure 62: U.K GDP – Composition of 2023, By Sector of Origin
Figure 63: U.K Export and Import Value & Volume, 2023-2030 ($)
Figure 64: Germany South Asia Polyisobutylene Market Value & Volume, 2023-2030 ($)
Figure 65: Germany GDP and Population, 2023-2030 ($)
Figure 66: Germany GDP – Composition of 2023, By Sector of Origin
Figure 67: Germany Export and Import Value & Volume, 2023-2030 ($)
Figure 68: Italy South Asia Polyisobutylene Market Value & Volume, 2023-2030 ($)
Figure 69: Italy GDP and Population, 2023-2030 ($)
Figure 70: Italy GDP – Composition of 2023, By Sector of Origin
Figure 71: Italy Export and Import Value & Volume, 2023-2030 ($)
Figure 72: France South Asia Polyisobutylene Market Value & Volume, 2023-2030 ($)
Figure 73: France GDP and Population, 2023-2030 ($)
Figure 74: France GDP – Composition of 2023, By Sector of Origin
Figure 75: France Export and Import Value & Volume, 2023-2030 ($)
Figure 76: Netherlands South Asia Polyisobutylene Market Value & Volume, 2023-2030 ($)
Figure 77: Netherlands GDP and Population, 2023-2030 ($)
Figure 78: Netherlands GDP – Composition of 2023, By Sector of Origin
Figure 79: Netherlands Export and Import Value & Volume, 2023-2030 ($)
Figure 80: Belgium South Asia Polyisobutylene Market Value & Volume, 2023-2030 ($)
Figure 81: Belgium GDP and Population, 2023-2030 ($)
Figure 82: Belgium GDP – Composition of 2023, By Sector of Origin
Figure 83: Belgium Export and Import Value & Volume, 2023-2030 ($)
Figure 84: Spain South Asia Polyisobutylene Market Value & Volume, 2023-2030 ($)
Figure 85: Spain GDP and Population, 2023-2030 ($)
Figure 86: Spain GDP – Composition of 2023, By Sector of Origin
Figure 87: Spain Export and Import Value & Volume, 2023-2030 ($)
Figure 88: Denmark South Asia Polyisobutylene Market Value & Volume, 2023-2030 ($)
Figure 89: Denmark GDP and Population, 2023-2030 ($)
Figure 90: Denmark GDP – Composition of 2023, By Sector of Origin
Figure 91: Denmark Export and Import Value & Volume, 2023-2030 ($)
Figure 92: APAC South Asia Polyisobutylene Market Value & Volume, 2023-2030 ($)
Figure 93: China South Asia Polyisobutylene Market Value & Volume, 2023-2030
Figure 94: China GDP and Population, 2023-2030 ($)
Figure 95: China GDP – Composition of 2023, By Sector of Origin
Figure 96: China Export and Import Value & Volume, 2023-2030 ($) South Asia Polyisobutylene Market China Export and Import Value & Volume, 2023-2030 ($)
Figure 97: Australia South Asia Polyisobutylene Market Value & Volume, 2023-2030 ($)
Figure 98: Australia GDP and Population, 2023-2030 ($)
Figure 99: Australia GDP – Composition of 2023, By Sector of Origin
Figure 100: Australia Export and Import Value & Volume, 2023-2030 ($)
Figure 101: South Korea South Asia Polyisobutylene Market Value & Volume, 2023-2030 ($)
Figure 102: South Korea GDP and Population, 2023-2030 ($)
Figure 103: South Korea GDP – Composition of 2023, By Sector of Origin
Figure 104: South Korea Export and Import Value & Volume, 2023-2030 ($)
Figure 105: India South Asia Polyisobutylene Market Value & Volume, 2023-2030 ($)
Figure 106: India GDP and Population, 2023-2030 ($)
Figure 107: India GDP – Composition of 2023, By Sector of Origin
Figure 108: India Export and Import Value & Volume, 2023-2030 ($)
Figure 109: Taiwan South Asia Polyisobutylene Market Value & Volume, 2023-2030 ($)
Figure 110: Taiwan GDP and Population, 2023-2030 ($)
Figure 111: Taiwan GDP – Composition of 2023, By Sector of Origin
Figure 112: Taiwan Export and Import Value & Volume, 2023-2030 ($)
Figure 113: Malaysia South Asia Polyisobutylene Market Value & Volume, 2023-2030 ($)
Figure 114: Malaysia GDP and Population, 2023-2030 ($)
Figure 115: Malaysia GDP – Composition of 2023, By Sector of Origin
Figure 116: Malaysia Export and Import Value & Volume, 2023-2030 ($)
Figure 117: Hong Kong South Asia Polyisobutylene Market Value & Volume, 2023-2030 ($)
Figure 118: Hong Kong GDP and Population, 2023-2030 ($)
Figure 119: Hong Kong GDP – Composition of 2023, By Sector of Origin
Figure 120: Hong Kong Export and Import Value & Volume, 2023-2030 ($)
Figure 121: Middle East & Africa South Asia Polyisobutylene Market Middle East & Africa 3D Printing Market Value & Volume, 2023-2030 ($)
Figure 122: Russia South Asia Polyisobutylene Market Value & Volume, 2023-2030 ($)
Figure 123: Russia GDP and Population, 2023-2030 ($)
Figure 124: Russia GDP – Composition of 2023, By Sector of Origin
Figure 125: Russia Export and Import Value & Volume, 2023-2030 ($)
Figure 126: Israel South Asia Polyisobutylene Market Value & Volume, 2023-2030 ($)
Figure 127: Israel GDP and Population, 2023-2030 ($)
Figure 128: Israel GDP – Composition of 2023, By Sector of Origin
Figure 129: Israel Export and Import Value & Volume, 2023-2030 ($)
Figure 130: Entropy Share, By Strategies, 2023-2030* (%) South Asia Polyisobutylene Market
Figure 131: Developments, 2023-2030* South Asia Polyisobutylene Market
Figure 132: Company 1 South Asia Polyisobutylene Market Net Revenue, By Years, 2023-2030* ($)
Figure 133: Company 1 South Asia Polyisobutylene Market Net Revenue Share, By Business segments, 2023 (%)
Figure 134: Company 1 South Asia Polyisobutylene Market Net Sales Share, By Geography, 2023 (%)
Figure 135: Company 2 South Asia Polyisobutylene Market Net Revenue, By Years, 2023-2030* ($)
Figure 136: Company 2 South Asia Polyisobutylene Market Net Revenue Share, By Business segments, 2023 (%)
Figure 137: Company 2 South Asia Polyisobutylene Market Net Sales Share, By Geography, 2023 (%)
Figure 138: Company 3 South Asia Polyisobutylene Market Net Revenue, By Years, 2023-2030* ($)
Figure 139: Company 3 South Asia Polyisobutylene Market Net Revenue Share, By Business segments, 2023 (%)
Figure 140: Company 3 South Asia Polyisobutylene Market Net Sales Share, By Geography, 2023 (%)
Figure 141: Company 4 South Asia Polyisobutylene Market Net Revenue, By Years, 2023-2030* ($)
Figure 142: Company 4 South Asia Polyisobutylene Market Net Revenue Share, By Business segments, 2023 (%)
Figure 143: Company 4 South Asia Polyisobutylene Market Net Sales Share, By Geography, 2023 (%)
Figure 144: Company 5 South Asia Polyisobutylene Market Net Revenue, By Years, 2023-2030* ($)
Figure 145: Company 5 South Asia Polyisobutylene Market Net Revenue Share, By Business segments, 2023 (%)
Figure 146: Company 5 South Asia Polyisobutylene Market Net Sales Share, By Geography, 2023 (%)
Figure 147: Company 6 South Asia Polyisobutylene Market Net Revenue, By Years, 2023-2030* ($)
Figure 148: Company 6 South Asia Polyisobutylene Market Net Revenue Share, By Business segments, 2023 (%)
Figure 149: Company 6 South Asia Polyisobutylene Market Net Sales Share, By Geography, 2023 (%)
Figure 150: Company 7 South Asia Polyisobutylene Market Net Revenue, By Years, 2023-2030* ($)
Figure 151: Company 7 South Asia Polyisobutylene Market Net Revenue Share, By Business segments, 2023 (%)
Figure 152: Company 7 South Asia Polyisobutylene Market Net Sales Share, By Geography, 2023 (%)
Figure 153: Company 8 South Asia Polyisobutylene Market Net Revenue, By Years, 2023-2030* ($)
Figure 154: Company 8 South Asia Polyisobutylene Market Net Revenue Share, By Business segments, 2023 (%)
Figure 155: Company 8 South Asia Polyisobutylene Market Net Sales Share, By Geography, 2023 (%)
Figure 156: Company 9 South Asia Polyisobutylene Market Net Revenue, By Years, 2023-2030* ($)
Figure 157: Company 9 South Asia Polyisobutylene Market Net Revenue Share, By Business segments, 2023 (%)
Figure 158: Company 9 South Asia Polyisobutylene Market Net Sales Share, By Geography, 2023 (%)
Figure 159: Company 10 South Asia Polyisobutylene Market Net Revenue, By Years, 2023-2030* ($)
Figure 160: Company 10 South Asia Polyisobutylene Market Net Revenue Share, By Business segments, 2023 (%)
Figure 161: Company 10 South Asia Polyisobutylene Market Net Sales Share, By Geography, 2023 (%)
Figure 162: Company 11 South Asia Polyisobutylene Market Net Revenue, By Years, 2023-2030* ($)
Figure 163: Company 11 South Asia Polyisobutylene Market Net Revenue Share, By Business segments, 2023 (%)
Figure 164: Company 11 South Asia Polyisobutylene Market Net Sales Share, By Geography, 2023 (%)
Figure 165: Company 12 South Asia Polyisobutylene Market Net Revenue, By Years, 2023-2030* ($)
Figure 166: Company 12 South Asia Polyisobutylene Market Net Revenue Share, By Business segments, 2023 (%)
Figure 167: Company 12 South Asia Polyisobutylene Market Net Sales Share, By Geography, 2023 (%)
Figure 168: Company 13 South Asia Polyisobutylene Market Net Revenue, By Years, 2023-2030* ($)
Figure 169: Company 13 South Asia Polyisobutylene Market Net Revenue Share, By Business segments, 2023 (%)
Figure 170: Company 13 South Asia Polyisobutylene Market Net Sales Share, By Geography, 2023 (%)
Figure 171: Company 14 South Asia Polyisobutylene Market Net Revenue, By Years, 2023-2030* ($)
Figure 172: Company 14 South Asia Polyisobutylene Market Net Revenue Share, By Business segments, 2023 (%)
Figure 173: Company 14 South Asia Polyisobutylene Market Net Sales Share, By Geography, 2023 (%)
Figure 174: Company 15 South Asia Polyisobutylene Market Net Revenue, By Years, 2023-2030* ($)
Figure 175: Company 15 South Asia Polyisobutylene Market Net Revenue Share, By Business segments, 2023 (%)
Figure 176: Company 15 South Asia Polyisobutylene Market Net Sales Share, By Geography, 2023 (%)