 Email
Email Print
Print


Biochemical Sensors Market Overview:
Biochemical Sensors Market size is estimated to reach $46 billion by 2030, growing at a CAGR of 6.8% during the forecast period 2024-2030. Biochemical sensors are analytical devices that combine biological recognition elements with physicochemical transducers. They are used to detect and quantify the presence of specific biomolecules in a sample. The biological recognition element, often an enzyme, antibody, or receptor, specifically binds to the target molecule (analyte). This binding event is then converted into a measurable signal by the transducer. The signal can be electrical, optical, or mass-based. Increasing demand for early disease diagnosis, personalized medicine and the increasing investment in healthcare, are set to drive the growth of the global Biochemical Sensors Market during the forecast period 2024-2030.
The biochemical sensors market is booming due to several trends. In healthcare, these sensors are enabling earlier disease detection, better patient monitoring, and personalized medicine. Technological advancements are making the sensors themselves smaller, more accurate, and cheaper. People are more interested in preventive healthcare and are looking for self-monitoring devices with these sensors. Miniaturized sensors can be seamlessly integrated with microfluidic chips, creating microfluidic biosensing platforms. These miniaturized laboratories can perform complex analyses on tiny volumes of fluids, offering a powerful tool for research and diagnostics. Additionally, there's a growing focus on using these sensors for food safety, environmental monitoring, and managing chronic diseases. This represents the biochemical sensors market outlook during the forecast period.
Market Snapshot:

Biochemical Sensors Market- Report Coverage:
The “Biochemical Sensors Market Report - Forecast (2024-2030)” by IndustryARC, covers an in-depth analysis of the following segments in the Biochemical Sensors Market.
| Attribute | Segment |
|---|---|
|
By Type |
|
|
By Technology |
|
|
By Sensing Parameter |
|
|
By Application |
|
|
By End Use Industry |
|
|
By Geography |
|
Impact of Covid and Russia Ukraine War:
- The COVID-19 pandemic impacted the biochemical sensor market. There was a surge in demand for diagnostic sensors, particularly for rapid COVID-19 testing. This demand fueled production and allowed for faster and more accessible testing. However, supply chain disruptions caused by lockdowns affected the production of essential components needed for these sensors. This led to temporary shortages and price fluctuations.
- The ongoing Russia-Ukraine war presents a challenge. Both countries are significant players in the raw material supply chain for biochemical sensors. The war disrupts the flow of these materials, leading to shortages and production slowdowns. Additionally, economic sanctions imposed on Russia can restrict sales and hinder market growth in that region.
Key Takeaways:
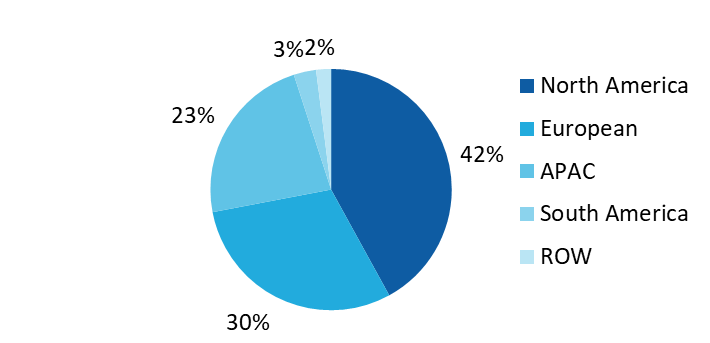
Dominance of North America
North America held the largest share of 42% in the Market in 2023 due to the concentration of major players, technological infrastructure, high digital adoption rates, increased spending on R&D in the medical sector and high defense budget. The U.S. Department of Defense proposed a Fiscal Year 2024 Budget request of $842 billion. This represents an increase of $26 billion over the FY2023 level and $100 billion more than FY2022 owing to the ongoing geopolitical conflicts. NATO issued a report tracking all member countries' projected defence spending for 2024; it forecasts Canada would spend 1.37% of its GDP on defence. Additionally, many leading biochemical sensor manufacturers are headquartered in North America. This gives the region a head start in terms of technological advancements and market dominance.
Medical and Health Sector is the largest
The healthcare sector reigns supreme in the biochemical sensor market due to the rising prevalence of chronic illnesses like diabetes, heart disease, and cancer necessitates constant monitoring. Biochemical sensors excel in this area, allowing for real-time tracking of vital signs, blood sugar levels, and other crucial health data, point-of-care testing, providing results quickly and conveniently without the need for extensive lab work. Biochemical sensors can play a pivotal role in early disease detection through faster and more accurate diagnostic tests. This enables timely intervention and potentially improves treatment outcomes. Example according to the National Library of Medicine, point-of-care (POC) biosensors such as chip-based and paper-based biosensors are typically rapid, portable, cost-effective, and user-friendly, which were used for COVID-19 in remote settings. The escalating demand for rapid diagnosis of diseases presents a strong need for biosensor.
Electrochemical Sensor holds the Largest Market Share
Electrochemical sensors are favored due to factors like maturity, cost-effectiveness and suitability for various applications like blood glucose monitoring and environmental analysis. Electrochemical sensors have been around for a longer time compared to other types of biochemical sensors. This maturity translates to better established manufacturing processes, wider availability, and a well-understood performance profile. For example, blood glucose meters, a common tool for people with diabetes, often rely on electrochemical sensors to measure glucose levels in the blood. According to NHS, Hypothyroidism, the most common thyroid disorder, typically requires lifelong hormone replacement therapy. This ongoing need for medication fuels market growth.
High Cost to Hamper Market Growth
Developing and manufacturing biochemical sensors can involve significant research and development costs, as well as costs associated with specialized materials, fabrication processes and quality control measures. These costs can contribute to higher initial prices for biochemical sensors. The high cost of biochemical sensors acts as a potential barrier to wider adoption, especially for complex or highly specialized sensors. High costs might push the market towards exploring alternative, cheaper diagnostic methods, even if they might be less sensitive or accurate and pose a threat to the market.
Biochemical Sensors Market: Market Share (%) by Region, 2023
For more details on this report - Request for Sample
Key Market Players:
The top 10 companies in the Biochemical Sensors Market are:
- GE Healthcare
- Medtronic PLC
- Bio-Rad Laboratories, Inc.
- Honeywell International Inc.
- STMicroelectronics N.V.
- First Sensor AG
- Smith’s Medicals
- NXP Semiconductor
- Danaher Corporation
- Nova Biomedical
Scope of Report:
| Report Metric | Details |
|---|---|
|
Market size available for years |
2023–2030 |
|
Base year considered |
2023 |
|
Forecast period |
2024–2030 |
|
Forecast units |
Value (USD) |
|
Segments covered |
Type, Technology, Sensing Parameters, Application End Use Industry, and Region |
|
Geographies covered |
North America (US, Canada and Mexico), Europe (Germany, France, UK, Italy, Netherlands, Spain, Belgium and Rest of Europe), Asia-Pacific (China, Japan, South Korea, India, Australia &Indonesia, Thailand, Malaysia and Rest of Asia-Pacific), South America (Brazil, Argentina, Chile, Colombia and Rest of South America), Rest of the World (Middle East and Africa). |
|
Companies covered |
Key 10 players covered include 1. GE Healthcare 2. Medtronic PLC 3. Bio-Rad Laboratories, Inc. 4. Honeywell International Inc 5. STMicroelectronics N.V. 6. First Sensor AG 7. Smith’s Medicals 8. NXP Semiconductor 9. Danaher Corporation 10. Nova Biomedical |
For more Automation and Instrumentation Market reports, please click here
1.1 Definitions and Scope
2. Biochemical Sensors Market - Executive Summary
2.1 Key trends by Type
2.2 Key trends by Technology
2.3 Key trends by Sensing Parameters
2.4 Key trends by Application
2.5 Key trends by End Use Industry
2.6 Key trends by Geography
3. Biochemical Sensors Market – Landscape
3.1 Comparative analysis
3.1.1 Market Share Analysis- Major Companies
3.1.2 Product Benchmarking- Major Companies
3.1.3 Major 5 Financials Analysis
3.1.4 Patent Analysis- Top Companies
3.1.5 Pricing Analysis (ASPs will be provided)
4. Biochemical Sensors Market - Startup companies Scenario Premium
4.1 Top startup company Analysis by
4.1.1 Investment
4.1.2 Revenue
4.1.3 Market Shares
4.1.4 Market Size and Application Analysis
4.1.5 Venture Capital and Funding Scenario
5. Biochemical Sensors Market – Industry Market Entry Scenario Premium
5.1 Regulatory Framework Overview
5.2 New Business and Ease of Doing business index
5.3 Successful venture profiles
5.4 Customer Analysis – Major companies
6. Biochemical Sensors Market - Market Forces
6.1 Market Drivers
6.2 Market Constraints
6.3 Porters Five Force Model
6.3.1 Bargaining Power of Suppliers
6.3.2 Bargaining Powers of Buyers
6.3.3 Threat of New Entrants
6.3.4 Competitive Rivalry
6.3.5 Threat of Substitutes
7. Biochemical Sensors Market – Strategic Analysis
7.1 Value/Supply Chain Analysis
7.2 Opportunity Analysis
7.3 Product/Market Life Cycle
7.4 Distributor Analysis – Major Companies
8. Biochemical Sensors Market – By Type (Market Size -$Million/Billion)
8.1 Enzyme-based Sensors
8.2 Tissue-based Sensors
8.3 Immunosensors
8.4 DNA biosensors
8.5 Others
9. Biochemical Sensors Market – By Technology (Market Size -$Million/Billion)
9.1 Piezoelectric
9.2 Optical
9.3 Electrochemical
9.3.1 Amperometric Biosensors
9.3.2 Potentiometric Biosensors
9.3.3 Impedimetric Biosensors
9.3.4 Voltametric Biosensors
9.4 Thermal
9.5 Others
10. Biochemical Sensors Market – By Sensing Parameters (Market Size -$Million/Billion)
10.1 Heat
10.2 Light
10.3 Mass
10.4 Refractive Index
10.5 Chemical Change
10.6 Electrical Change
10.7 Others
11. Biochemical Sensors Market – By Application (Market Size -$Million/Billion)
11.1 Chemical Analysis
11.2 Clinical Diagnosis
11.3 Environmental Monitoring
11.4 Food Quality Control
11.5 Security Screening
11.6 Drug Discovery
11.7 Water Quality Management
11.8 Others
12.1 Military & Defense
12.2 Food & Beverage
12.3 Medical & Healthcare
12.4 Water & Wastewater
12.5 Chemical
12.6 Pharmaceutical
12.7 Environment
12.8 Others
13. Biochemical Sensors Market - By Geography (Market Size -$Million/Billion)
13.1 North America
13.1.1 USA
13.1.2 Canada
13.1.3 Mexico
13.2 Europe
13.2.1 UK
13.2.2 Germany
13.2.3 France
13.2.4 Italy
13.2.5 Netherlands
13.2.6 Spain
13.2.7 Belgium
13.2.8 Rest of Europe
13.3 Asia-Pacific
13.3.1 China
13.3.2 Japan
13.3.3 India
13.3.4 South Korea
13.3.5 Indonesia
13.3.6 Australia
13.3.7 Malaysia
13.3.8 Thailand
13.3.9 Rest of APAC
13.4 South America
13.4.1 Brazil
13.4.2 Argentina
13.4.3 Colombia
13.4.4 Chile
13.4.5 Rest of South America
13.5 Rest of the World
13.5.1 Middle East
13.5.2 Africa
14. Biochemical Sensors Market – Entropy
14.1 New Product Launches
14.2 M&As, Collaborations, JVs and Partnerships
15+. Biochemical Sensors Market – Market Share Analysis
15.1 Market Share at Global Level - Major companies
15.2 Market Share by Key Region - Major companies
15.3 Market Share by Key Country - Major companies
15.4 Market Share by Key Application - Major companies
15.5 Market Share by Key Product Type/Product category - Major companies
16. Biochemical Sensors Market – Key Company List by Country Premium
17. Biochemical Sensors Market Company Analysis
17.1 GE Healthcare
17.2 Medtronic PLC
17.3 Bio-Rad Laboratories, Inc.
17.4 Honeywell International Inc.
17.5 STMicroelectronics N.V.
17.6 First Sensor AG
17.7 Smith’s Medicals
17.8 NXP Semiconductor
17.9 Danaher Corporation
17.10 Nova Biomedical
"*Financials would be provided on a best-effort basis for private companies*”
Connect with our experts to get customized reports that best suit your requirements. Our
reports include global-level data, niche markets and competitive landscape.
List of Table s
Table 1: Biochemical Sensor Market Overview 2023-2030
Table 2: Biochemical Sensor Market Leader Analysis 2023-2030 (US$)
Table 3: Biochemical Sensor Market Product Analysis 2023-2030 (US$)
Table 4: Biochemical Sensor Market End User Analysis 2023-2030 (US$)
Table 5: Biochemical Sensor Market Patent Analysis 2013-2023* (US$)
Table 6: Biochemical Sensor Market Financial Analysis 2023-2030 (US$)
Table 7: Biochemical Sensor Market Driver Analysis 2023-2030 (US$)
Table 8: Biochemical Sensor Market Challenges Analysis 2023-2030 (US$)
Table 9: Biochemical Sensor Market Constraint Analysis 2023-2030 (US$)
Table 10: Biochemical Sensor Market Supplier Bargaining Power Analysis 2023-2030 (US$)
Table 11: Biochemical Sensor Market Buyer Bargaining Power Analysis 2023-2030 (US$)
Table 12: Biochemical Sensor Market Threat of Substitutes Analysis 2023-2030 (US$)
Table 13: Biochemical Sensor Market Threat of New Entrants Analysis 2023-2030 (US$)
Table 14: Biochemical Sensor Market Degree of Competition Analysis 2023-2030 (US$)
Table 15: Biochemical Sensor Market Value Chain Analysis 2023-2030 (US$)
Table 16: Biochemical Sensor Market Pricing Analysis 2023-2030 (US$)
Table 17: Biochemical Sensor Market Opportunities Analysis 2023-2030 (US$)
Table 18: Biochemical Sensor Market Product Life Cycle Analysis 2023-2030 (US$)
Table 19: Biochemical Sensor Market Supplier Analysis 2023-2030 (US$)
Table 20: Biochemical Sensor Market Distributor Analysis 2023-2030 (US$)
Table 21: Biochemical Sensor Market Trend Analysis 2023-2030 (US$)
Table 22: Biochemical Sensor Market Size 2023 (US$)
Table 23: Biochemical Sensor Market Forecast Analysis 2023-2030 (US$)
Table 24: Biochemical Sensor Market Sales Forecast Analysis 2023-2030 (Units)
Table 25: Biochemical Sensor Market, Revenue & Volume,By Product Type, 2023-2030 ($)
Table 26: Biochemical Sensor Market By Product Type, Revenue & Volume,By Whole-Cell Biosensor, 2023-2030 ($)
Table 27: Biochemical Sensor Market By Product Type, Revenue & Volume,By Enzyme Biosensor, 2023-2030 ($)
Table 28: Biochemical Sensor Market By Product Type, Revenue & Volume,By DNA Based Biosensor, 2023-2030 ($)
Table 29: Biochemical Sensor Market By Product Type, Revenue & Volume,By Surface Plasmon Resonance Biosensor, 2023-2030 ($)
Table 30: Biochemical Sensor Market By Product Type, Revenue & Volume,By Immuno Biosensor, 2023-2030 ($)
Table 31: Biochemical Sensor Market, Revenue & Volume,By Detection Method, 2023-2030 ($)
Table 32: Biochemical Sensor Market By Detection Method, Revenue & Volume,By Electrochemical, 2023-2030 ($)
Table 33: Biochemical Sensor Market By Detection Method, Revenue & Volume,By Amperometric, 2023-2030 ($)
Table 34: Biochemical Sensor Market By Detection Method, Revenue & Volume,By Potentiometric, 2023-2030 ($)
Table 35: Biochemical Sensor Market By Detection Method, Revenue & Volume,By Conduct metric, 2023-2030 ($)
Table 36: Biochemical Sensor Market By Detection Method, Revenue & Volume,By Thermometric, 2023-2030 ($)
Table 37: Biochemical Sensor Market, Revenue & Volume,By Sensing Parameters, 2023-2030 ($)
Table 38: Biochemical Sensor Market By Sensing Parameters, Revenue & Volume,By Heat, 2023-2030 ($)
Table 39: Biochemical Sensor Market By Sensing Parameters, Revenue & Volume,By Light, 2023-2030 ($)
Table 40: Biochemical Sensor Market By Sensing Parameters, Revenue & Volume,By Mass, 2023-2030 ($)
Table 41: Biochemical Sensor Market By Sensing Parameters, Revenue & Volume,By Refractive Index, 2023-2030 ($)
Table 42: Biochemical Sensor Market By Sensing Parameters, Revenue & Volume,By Chemical Change, 2023-2030 ($)
Table 43: Biochemical Sensor Market, Revenue & Volume,By Application, 2023-2030 ($)
Table 44: Biochemical Sensor Market By Application, Revenue & Volume,By Diagnostics, 2023-2030 ($)
Table 45: Biochemical Sensor Market By Application, Revenue & Volume,By Contamination Check, 2023-2030 ($)
Table 46: Biochemical Sensor Market By Application, Revenue & Volume,By Testing, Inspection and Certification, 2023-2030 ($)
Table 47: Biochemical Sensor Market By Application, Revenue & Volume,By In-House Quality Check, 2023-2030 ($)
Table 48: Biochemical Sensor Market By Application, Revenue & Volume,By Security and Screening, 2023-2030 ($)
Table 49: Biochemical Sensor Market, Revenue & Volume,By End User, 2023-2030 ($)
Table 50: Biochemical Sensor Market By End User, Revenue & Volume,By Healthcare, 2023-2030 ($)
Table 51: Biochemical Sensor Market By End User, Revenue & Volume,By Pharmaceutical, 2023-2030 ($)
Table 52: Biochemical Sensor Market By End User, Revenue & Volume,By Chemicals, 2023-2030 ($)
Table 53: Biochemical Sensor Market By End User, Revenue & Volume,By Food and Beverage, 2023-2030 ($)
Table 54: Biochemical Sensor Market By End User, Revenue & Volume,By Water, Wastewater and Sewage Treatment, 2023-2030 ($)
Table 55: North America Biochemical Sensor Market, Revenue & Volume,By Product Type, 2023-2030 ($)
Table 56: North America Biochemical Sensor Market, Revenue & Volume,By Detection Method, 2023-2030 ($)
Table 57: North America Biochemical Sensor Market, Revenue & Volume,By Sensing Parameters, 2023-2030 ($)
Table 58: North America Biochemical Sensor Market, Revenue & Volume,By Application, 2023-2030 ($)
Table 59: North America Biochemical Sensor Market, Revenue & Volume,By End User, 2023-2030 ($)
Table 60: South america Biochemical Sensor Market, Revenue & Volume,By Product Type, 2023-2030 ($)
Table 61: South america Biochemical Sensor Market, Revenue & Volume,By Detection Method, 2023-2030 ($)
Table 62: South america Biochemical Sensor Market, Revenue & Volume,By Sensing Parameters, 2023-2030 ($)
Table 63: South america Biochemical Sensor Market, Revenue & Volume,By Application, 2023-2030 ($)
Table 64: South america Biochemical Sensor Market, Revenue & Volume,By End User, 2023-2030 ($)
Table 65: Europe Biochemical Sensor Market, Revenue & Volume,By Product Type, 2023-2030 ($)
Table 66: Europe Biochemical Sensor Market, Revenue & Volume,By Detection Method, 2023-2030 ($)
Table 67: Europe Biochemical Sensor Market, Revenue & Volume,By Sensing Parameters, 2023-2030 ($)
Table 68: Europe Biochemical Sensor Market, Revenue & Volume,By Application, 2023-2030 ($)
Table 69: Europe Biochemical Sensor Market, Revenue & Volume,By End User, 2023-2030 ($)
Table 70: APAC Biochemical Sensor Market, Revenue & Volume,By Product Type, 2023-2030 ($)
Table 71: APAC Biochemical Sensor Market, Revenue & Volume,By Detection Method, 2023-2030 ($)
Table 72: APAC Biochemical Sensor Market, Revenue & Volume,By Sensing Parameters, 2023-2030 ($)
Table 73: APAC Biochemical Sensor Market, Revenue & Volume,By Application, 2023-2030 ($)
Table 74: APAC Biochemical Sensor Market, Revenue & Volume,By End User, 2023-2030 ($)
Table 75: Middle East & Africa Biochemical Sensor Market, Revenue & Volume,By Product Type, 2023-2030 ($)
Table 76: Middle East & Africa Biochemical Sensor Market, Revenue & Volume,By Detection Method, 2023-2030 ($)
Table 77: Middle East & Africa Biochemical Sensor Market, Revenue & Volume,By Sensing Parameters, 2023-2030 ($)
Table 78: Middle East & Africa Biochemical Sensor Market, Revenue & Volume,By Application, 2023-2030 ($)
Table 79: Middle East & Africa Biochemical Sensor Market, Revenue & Volume,By End User, 2023-2030 ($)
Table 80: Russia Biochemical Sensor Market, Revenue & Volume,By Product Type, 2023-2030 ($)
Table 81: Russia Biochemical Sensor Market, Revenue & Volume,By Detection Method, 2023-2030 ($)
Table 82: Russia Biochemical Sensor Market, Revenue & Volume,By Sensing Parameters, 2023-2030 ($)
Table 83: Russia Biochemical Sensor Market, Revenue & Volume,By Application, 2023-2030 ($)
Table 84: Russia Biochemical Sensor Market, Revenue & Volume,By End User, 2023-2030 ($)
Table 85: Israel Biochemical Sensor Market, Revenue & Volume,By Product Type, 2023-2030 ($)
Table 86: Israel Biochemical Sensor Market, Revenue & Volume,By Detection Method, 2023-2030 ($)
Table 87: Israel Biochemical Sensor Market, Revenue & Volume,By Sensing Parameters, 2023-2030 ($)
Table 88: Israel Biochemical Sensor Market, Revenue & Volume,By Application, 2023-2030 ($)
Table 89: Israel Biochemical Sensor Market, Revenue & Volume,By End User, 2023-2030 ($)
Table 90: Top Companies 2023 (US$) Biochemical Sensor Market, Revenue & Volume
Table 91: Product Launch 2023-2030 Biochemical Sensor Market, Revenue & Volume
Table 92: Mergers & Acquistions 2023-2030 Biochemical Sensor Market, Revenue & Volume
List of Figures
Figure 1: Overview of Biochemical Sensor Market 2023-2030
Figure 2: Market Share Analysis for Biochemical Sensor Market 2023 (US$)
Figure 3: Product Comparison in Biochemical Sensor Market 2023-2030 (US$)
Figure 4: End User Profile for Biochemical Sensor Market 2023-2030 (US$)
Figure 5: Patent Application and Grant in Biochemical Sensor Market 2013-2023* (US$)
Figure 6: Top 5 Companies Financial Analysis in Biochemical Sensor Market 2023-2030 (US$)
Figure 7: Market Entry Strategy in Biochemical Sensor Market 2023-2030
Figure 8: Ecosystem Analysis in Biochemical Sensor Market 2023
Figure 9: Average Selling Price in Biochemical Sensor Market 2023-2030
Figure 10: Top Opportunites in Biochemical Sensor Market 2023-2030
Figure 11: Market Life Cycle Analysis in Biochemical Sensor Market
Figure 12: GlobalBy Product Type Biochemical Sensor Market Revenue, 2023-2030 ($)
Figure 13: GlobalBy Detection Method Biochemical Sensor Market Revenue, 2023-2030 ($)
Figure 14: GlobalBy Sensing Parameters Biochemical Sensor Market Revenue, 2023-2030 ($)
Figure 15: GlobalBy Application Biochemical Sensor Market Revenue, 2023-2030 ($)
Figure 16: GlobalBy End User Biochemical Sensor Market Revenue, 2023-2030 ($)
Figure 17: Global Biochemical Sensor Market - By Geography
Figure 18: Global Biochemical Sensor Market Value & Volume, By Geography, 2023-2030 ($)
Figure 19: Global Biochemical Sensor Market CAGR, By Geography, 2023-2030 (%)
Figure 20: North America Biochemical Sensor Market Value & Volume, 2023-2030 ($)
Figure 21: US Biochemical Sensor Market Value & Volume, 2023-2030 ($)
Figure 22: US GDP and Population, 2023-2030 ($)
Figure 23: US GDP – Composition of 2023, By Sector of Origin
Figure 24: US Export and Import Value & Volume, 2023-2030 ($)
Figure 25: Canada Biochemical Sensor Market Value & Volume, 2023-2030 ($)
Figure 26: Canada GDP and Population, 2023-2030 ($)
Figure 27: Canada GDP – Composition of 2023, By Sector of Origin
Figure 28: Canada Export and Import Value & Volume, 2023-2030 ($)
Figure 29: Mexico Biochemical Sensor Market Value & Volume, 2023-2030 ($)
Figure 30: Mexico GDP and Population, 2023-2030 ($)
Figure 31: Mexico GDP – Composition of 2023, By Sector of Origin
Figure 32: Mexico Export and Import Value & Volume, 2023-2030 ($)
Figure 33: South America Biochemical Sensor Market Value & Volume, 2023-2030 ($)
Figure 34: Brazil Biochemical Sensor Market Value & Volume, 2023-2030 ($)
Figure 35: Brazil GDP and Population, 2023-2030 ($)
Figure 36: Brazil GDP – Composition of 2023, By Sector of Origin
Figure 37: Brazil Export and Import Value & Volume, 2023-2030 ($)
Figure 38: Venezuela Biochemical Sensor Market Value & Volume, 2023-2030 ($)
Figure 39: Venezuela GDP and Population, 2023-2030 ($)
Figure 40: Venezuela GDP – Composition of 2023, By Sector of Origin
Figure 41: Venezuela Export and Import Value & Volume, 2023-2030 ($)
Figure 42: Argentina Biochemical Sensor Market Value & Volume, 2023-2030 ($)
Figure 43: Argentina GDP and Population, 2023-2030 ($)
Figure 44: Argentina GDP – Composition of 2023, By Sector of Origin
Figure 45: Argentina Export and Import Value & Volume, 2023-2030 ($)
Figure 46: Ecuador Biochemical Sensor Market Value & Volume, 2023-2030 ($)
Figure 47: Ecuador GDP and Population, 2023-2030 ($)
Figure 48: Ecuador GDP – Composition of 2023, By Sector of Origin
Figure 49: Ecuador Export and Import Value & Volume, 2023-2030 ($)
Figure 50: Peru Biochemical Sensor Market Value & Volume, 2023-2030 ($)
Figure 51: Peru GDP and Population, 2023-2030 ($)
Figure 52: Peru GDP – Composition of 2023, By Sector of Origin
Figure 53: Peru Export and Import Value & Volume, 2023-2030 ($)
Figure 54: Colombia Biochemical Sensor Market Value & Volume, 2023-2030 ($)
Figure 55: Colombia GDP and Population, 2023-2030 ($)
Figure 56: Colombia GDP – Composition of 2023, By Sector of Origin
Figure 57: Colombia Export and Import Value & Volume, 2023-2030 ($)
Figure 58: Costa Rica Biochemical Sensor Market Value & Volume, 2023-2030 ($)
Figure 59: Costa Rica GDP and Population, 2023-2030 ($)
Figure 60: Costa Rica GDP – Composition of 2023, By Sector of Origin
Figure 61: Costa Rica Export and Import Value & Volume, 2023-2030 ($)
Figure 62: Europe Biochemical Sensor Market Value & Volume, 2023-2030 ($)
Figure 63: U.K Biochemical Sensor Market Value & Volume, 2023-2030 ($)
Figure 64: U.K GDP and Population, 2023-2030 ($)
Figure 65: U.K GDP – Composition of 2023, By Sector of Origin
Figure 66: U.K Export and Import Value & Volume, 2023-2030 ($)
Figure 67: Germany Biochemical Sensor Market Value & Volume, 2023-2030 ($)
Figure 68: Germany GDP and Population, 2023-2030 ($)
Figure 69: Germany GDP – Composition of 2023, By Sector of Origin
Figure 70: Germany Export and Import Value & Volume, 2023-2030 ($)
Figure 71: Italy Biochemical Sensor Market Value & Volume, 2023-2030 ($)
Figure 72: Italy GDP and Population, 2023-2030 ($)
Figure 73: Italy GDP – Composition of 2023, By Sector of Origin
Figure 74: Italy Export and Import Value & Volume, 2023-2030 ($)
Figure 75: France Biochemical Sensor Market Value & Volume, 2023-2030 ($)
Figure 76: France GDP and Population, 2023-2030 ($)
Figure 77: France GDP – Composition of 2023, By Sector of Origin
Figure 78: France Export and Import Value & Volume, 2023-2030 ($)
Figure 79: Netherlands Biochemical Sensor Market Value & Volume, 2023-2030 ($)
Figure 80: Netherlands GDP and Population, 2023-2030 ($)
Figure 81: Netherlands GDP – Composition of 2023, By Sector of Origin
Figure 82: Netherlands Export and Import Value & Volume, 2023-2030 ($)
Figure 83: Belgium Biochemical Sensor Market Value & Volume, 2023-2030 ($)
Figure 84: Belgium GDP and Population, 2023-2030 ($)
Figure 85: Belgium GDP – Composition of 2023, By Sector of Origin
Figure 86: Belgium Export and Import Value & Volume, 2023-2030 ($)
Figure 87: Spain Biochemical Sensor Market Value & Volume, 2023-2030 ($)
Figure 88: Spain GDP and Population, 2023-2030 ($)
Figure 89: Spain GDP – Composition of 2023, By Sector of Origin
Figure 90: Spain Export and Import Value & Volume, 2023-2030 ($)
Figure 91: Denmark Biochemical Sensor Market Value & Volume, 2023-2030 ($)
Figure 92: Denmark GDP and Population, 2023-2030 ($)
Figure 93: Denmark GDP – Composition of 2023, By Sector of Origin
Figure 94: Denmark Export and Import Value & Volume, 2023-2030 ($)
Figure 95: APAC Biochemical Sensor Market Value & Volume, 2023-2030 ($)
Figure 96: China Biochemical Sensor Market Value & Volume, 2023-2030
Figure 97: China GDP and Population, 2023-2030 ($)
Figure 98: China GDP – Composition of 2023, By Sector of Origin
Figure 99: China Export and Import Value & Volume, 2023-2030 ($) Biochemical Sensor Market China Export and Import Value & Volume, 2023-2030 ($)
Figure 100: Australia Biochemical Sensor Market Value & Volume, 2023-2030 ($)
Figure 101: Australia GDP and Population, 2023-2030 ($)
Figure 102: Australia GDP – Composition of 2023, By Sector of Origin
Figure 103: Australia Export and Import Value & Volume, 2023-2030 ($)
Figure 104: South Korea Biochemical Sensor Market Value & Volume, 2023-2030 ($)
Figure 105: South Korea GDP and Population, 2023-2030 ($)
Figure 106: South Korea GDP – Composition of 2023, By Sector of Origin
Figure 107: South Korea Export and Import Value & Volume, 2023-2030 ($)
Figure 108: India Biochemical Sensor Market Value & Volume, 2023-2030 ($)
Figure 109: India GDP and Population, 2023-2030 ($)
Figure 110: India GDP – Composition of 2023, By Sector of Origin
Figure 111: India Export and Import Value & Volume, 2023-2030 ($)
Figure 112: Taiwan Biochemical Sensor Market Value & Volume, 2023-2030 ($)
Figure 113: Taiwan GDP and Population, 2023-2030 ($)
Figure 114: Taiwan GDP – Composition of 2023, By Sector of Origin
Figure 115: Taiwan Export and Import Value & Volume, 2023-2030 ($)
Figure 116: Malaysia Biochemical Sensor Market Value & Volume, 2023-2030 ($)
Figure 117: Malaysia GDP and Population, 2023-2030 ($)
Figure 118: Malaysia GDP – Composition of 2023, By Sector of Origin
Figure 119: Malaysia Export and Import Value & Volume, 2023-2030 ($)
Figure 120: Hong Kong Biochemical Sensor Market Value & Volume, 2023-2030 ($)
Figure 121: Hong Kong GDP and Population, 2023-2030 ($)
Figure 122: Hong Kong GDP – Composition of 2023, By Sector of Origin
Figure 123: Hong Kong Export and Import Value & Volume, 2023-2030 ($)
Figure 124: Middle East & Africa Biochemical Sensor Market Middle East & Africa 3D Printing Market Value & Volume, 2023-2030 ($)
Figure 125: Russia Biochemical Sensor Market Value & Volume, 2023-2030 ($)
Figure 126: Russia GDP and Population, 2023-2030 ($)
Figure 127: Russia GDP – Composition of 2023, By Sector of Origin
Figure 128: Russia Export and Import Value & Volume, 2023-2030 ($)
Figure 129: Israel Biochemical Sensor Market Value & Volume, 2023-2030 ($)
Figure 130: Israel GDP and Population, 2023-2030 ($)
Figure 131: Israel GDP – Composition of 2023, By Sector of Origin
Figure 132: Israel Export and Import Value & Volume, 2023-2030 ($)
Figure 133: Entropy Share, By Strategies, 2023-2030* (%) Biochemical Sensor Market
Figure 134: Developments, 2023-2030* Biochemical Sensor Market
Figure 135: Company 1 Biochemical Sensor Market Net Revenue, By Years, 2023-2030* ($)
Figure 136: Company 1 Biochemical Sensor Market Net Revenue Share, By Business segments, 2023 (%)
Figure 137: Company 1 Biochemical Sensor Market Net Sales Share, By Geography, 2023 (%)
Figure 138: Company 2 Biochemical Sensor Market Net Revenue, By Years, 2023-2030* ($)
Figure 139: Company 2 Biochemical Sensor Market Net Revenue Share, By Business segments, 2023 (%)
Figure 140: Company 2 Biochemical Sensor Market Net Sales Share, By Geography, 2023 (%)
Figure 141: Company 3 Biochemical Sensor Market Net Revenue, By Years, 2023-2030* ($)
Figure 142: Company 3 Biochemical Sensor Market Net Revenue Share, By Business segments, 2023 (%)
Figure 143: Company 3 Biochemical Sensor Market Net Sales Share, By Geography, 2023 (%)
Figure 144: Company 4 Biochemical Sensor Market Net Revenue, By Years, 2023-2030* ($)
Figure 145: Company 4 Biochemical Sensor Market Net Revenue Share, By Business segments, 2023 (%)
Figure 146: Company 4 Biochemical Sensor Market Net Sales Share, By Geography, 2023 (%)
Figure 147: Company 5 Biochemical Sensor Market Net Revenue, By Years, 2023-2030* ($)
Figure 148: Company 5 Biochemical Sensor Market Net Revenue Share, By Business segments, 2023 (%)
Figure 149: Company 5 Biochemical Sensor Market Net Sales Share, By Geography, 2023 (%)
Figure 150: Company 6 Biochemical Sensor Market Net Revenue, By Years, 2023-2030* ($)
Figure 151: Company 6 Biochemical Sensor Market Net Revenue Share, By Business segments, 2023 (%)
Figure 152: Company 6 Biochemical Sensor Market Net Sales Share, By Geography, 2023 (%)
Figure 153: Company 7 Biochemical Sensor Market Net Revenue, By Years, 2023-2030* ($)
Figure 154: Company 7 Biochemical Sensor Market Net Revenue Share, By Business segments, 2023 (%)
Figure 155: Company 7 Biochemical Sensor Market Net Sales Share, By Geography, 2023 (%)
Figure 156: Company 8 Biochemical Sensor Market Net Revenue, By Years, 2023-2030* ($)
Figure 157: Company 8 Biochemical Sensor Market Net Revenue Share, By Business segments, 2023 (%)
Figure 158: Company 8 Biochemical Sensor Market Net Sales Share, By Geography, 2023 (%)
Figure 159: Company 9 Biochemical Sensor Market Net Revenue, By Years, 2023-2030* ($)
Figure 160: Company 9 Biochemical Sensor Market Net Revenue Share, By Business segments, 2023 (%)
Figure 161: Company 9 Biochemical Sensor Market Net Sales Share, By Geography, 2023 (%)
Figure 162: Company 10 Biochemical Sensor Market Net Revenue, By Years, 2023-2030* ($)
Figure 163: Company 10 Biochemical Sensor Market Net Revenue Share, By Business segments, 2023 (%)
Figure 164: Company 10 Biochemical Sensor Market Net Sales Share, By Geography, 2023 (%)
Figure 165: Company 11 Biochemical Sensor Market Net Revenue, By Years, 2023-2030* ($)
Figure 166: Company 11 Biochemical Sensor Market Net Revenue Share, By Business segments, 2023 (%)
Figure 167: Company 11 Biochemical Sensor Market Net Sales Share, By Geography, 2023 (%)
Figure 168: Company 12 Biochemical Sensor Market Net Revenue, By Years, 2023-2030* ($)
Figure 169: Company 12 Biochemical Sensor Market Net Revenue Share, By Business segments, 2023 (%)
Figure 170: Company 12 Biochemical Sensor Market Net Sales Share, By Geography, 2023 (%)
Figure 171: Company 13 Biochemical Sensor Market Net Revenue, By Years, 2023-2030* ($)
Figure 172: Company 13 Biochemical Sensor Market Net Revenue Share, By Business segments, 2023 (%)
Figure 173: Company 13 Biochemical Sensor Market Net Sales Share, By Geography, 2023 (%)
Figure 174: Company 14 Biochemical Sensor Market Net Revenue, By Years, 2023-2030* ($)
Figure 175: Company 14 Biochemical Sensor Market Net Revenue Share, By Business segments, 2023 (%)
Figure 176: Company 14 Biochemical Sensor Market Net Sales Share, By Geography, 2023 (%)
Figure 177: Company 15 Biochemical Sensor Market Net Revenue, By Years, 2023-2030* ($)
Figure 178: Company 15 Biochemical Sensor Market Net Revenue Share, By Business segments, 2023 (%)
Figure 179: Company 15 Biochemical Sensor Market Net Sales Share, By Geography, 2023 (%)
The Biochemical Sensors Market is projected to grow at 6.8% CAGR during the forecast period 2024-2030.
Global Biochemical Sensors Market size is estimated to be $46 billion in 2023 and is projected to reach $46 billion by 2030.
The leading players in the Biochemical Sensors Market are GE Healthcare, Medtronic PLC, Bio-Rad Laboratories, Inc., Honeywell International Inc., STMicroelectronics N.V. and others.
Adoption AI, Cloud based computing in healthcare industry and investments in nano technologies for biosensors are some of the major Biochemical Sensors Market trends in the industry which will create growth opportunities for the market during the forecast period.
Increasing regulations in food safety and quality control and demand for miniaturization of biochemical sensors, making them compact, portable and suitable for integration into wearable devices are the driving factors of the market. Point-of-Care and home testing, Research and Development across various fields, including pharmaceuticals, biotechnology and life sciences are the opportunities.