 Email
Email Print
Print


P2P Lending Market Overview
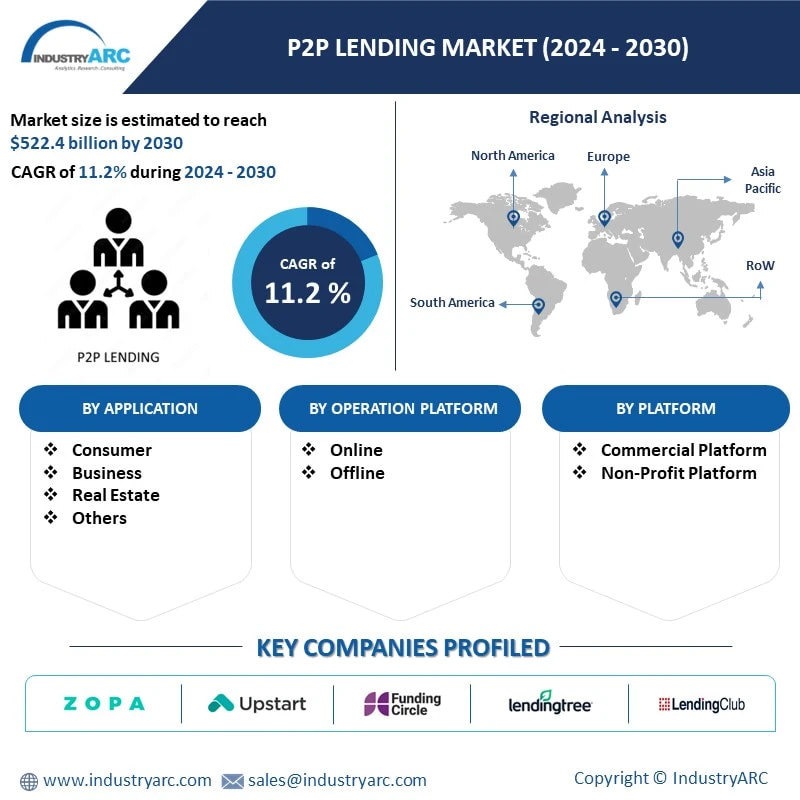
P2P lending Market is forecast to reach $522.42 billion by 2030, after growing at a CAGR of 11.2% during the forecast period 2024-2030. The P2P Lending Market growth is attributed to increasing transparency in P2P lending with technologies such as block chain and smart contracts being incorporated into lending platforms. A significant trend in the P2P lending market is the increased regulatory scrutiny and compliance requirements imposed by government authorities to ensure investor protection, transparency, and stability in the lending ecosystem. As P2P lending platforms have gained popularity as alternative investment avenues, regulatory bodies worldwide are enacting or updating regulations to mitigate risks associated with the industry, such as fraud, default rates, and systemic instability. Regulatory measures may include licensing requirements for P2P platforms, borrower eligibility criteria, disclosure and transparency standards, and risk management guidelines. Additionally, regulatory oversight aims to promote fair lending practices, prevent money laundering and terrorist financing, and safeguard investors' interests through mechanisms such as investor accreditation, fund segregation, and dispute resolution frameworks. Compliance with regulatory requirements is essential for P2P lending platforms to build trust, attract investors, and foster long-term sustainability in the market. As regulatory frameworks continue to evolve and tighten, P2P lending platforms must adapt their operations and risk management practices to ensure compliance and maintain credibility in the eyes of investors and regulators. Another notable development in the P2P lending market is the emergence of securitization and institutional participation, driving increased liquidity, diversification, and scale in the lending ecosystem. Securitization involves bundling P2P loans into tradable securities, such as bonds or notes, which are then sold to institutional investors or secondary market participants. This securitization process enables P2P platforms to offload loan portfolios, reduce credit risk exposure, and access additional funding sources to fuel loan origination and growth. Moreover, institutional investors, such as hedge funds, asset managers, and pension funds, are increasingly allocating capital to P2P lending assets as part of their fixed-income portfolios, attracted by the potential for higher yields and diversification benefits compared to traditional fixed-income securities. Institutional participation brings stability, credibility, and liquidity to the P2P lending market, providing a source of funding for borrowers and enhancing investor confidence. Additionally, collaboration between P2P platforms and institutional investors may lead to the development of innovative lending products, risk-sharing arrangements, and credit enhancement mechanisms, further driving market evolution and maturity in the P2P lending industry.
Market Snapshot:
P2P Lending Market Report Coverage
The report: “P2P Lending Market – Forecast (2024-2030)”, by IndustryARC covers an in-depth analysis of the following segments of the P2P Lending Market.
By Operation Pattern: Online, Offline
By Application: Consumer, Business, Real Estate, Others
By Geography: North America, South America, Europe, APAC, RoW
Key Takeaways
• The P2P Lending market is analyzed as fragmented; and the top 10 players in the market are Upstart, Funding Circle, Lending Tree, Prosper Lending, Lending Club, Perform and others.
• Online P2P lending holds majority of market share in the global P2P lending market, owing to advantages such as faster loan approvals and disbursals. Additionally, the operational costs involved in physical establishments is one of the reasons for P2P companies to operate in offline pattern.
• While China is the major market for P2P lending, the markets in the U.S. and the U.K are poised to grow at CAGRs of 8% and 10%, respectively during 2024-2030. Lower interest rates, simplified online platforms and faster loan approval processes are reasons leading to growth of the P2P lending market in these countries.
For More Details on This Report - Request for Sample
P2P Lending Market Segment Analysis - By Operation Pattern
Online P2P lending is anticipated to hold majority of share in the P2P lending market throughout the forecast period 2024-2030. The digital operations for P2P lending platforms ensure that the overhead costs required for maintaining and staffing a physical establishment are circumvented. This benefit can be passed onto the borrower in the form of lower interest rates and processing charges. Additionally, the online lending platforms ensure relatively faster loan processing than the traditional loan platforms due to minimal paperwork involved. The growth in the fin-tech credit activity around the world gives an implication of the growth lending on e-platforms.
P2P Lending Market Segment Analysis - By Application
The real estate application is expected to witness the fastest growth at a CAGR of 14.7% during the forecast period 2024-2030. The real estate industry is looking at P2P lending as the best alternative to traditional financial institutions. Real estate projects often require large amounts of investment which makes it difficult for real estate developers to acquire loans from financial institutions. This is a major reason driving developers to opt for P2P lending platforms. Additionally, restricting credit regulations in banks and other financial institutions is anticipated to benefit the growth of the market, as the demand from the SMEs and consumer credit front increases.
P2P Lending Market Segment Analysis - By Geography
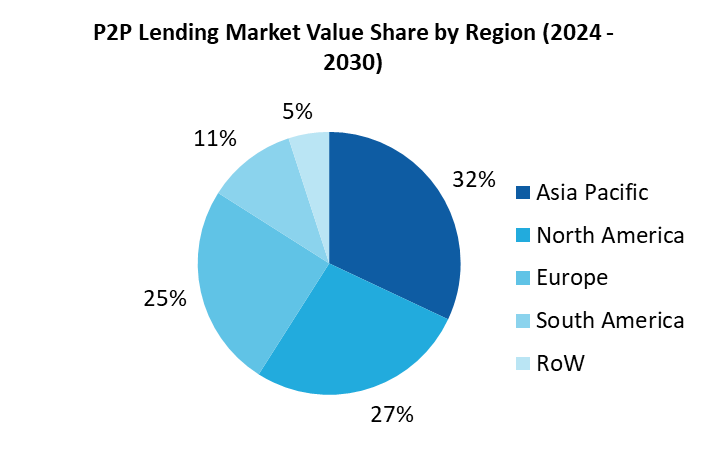
In the dynamic realm of peer-to-peer lending, geographical distribution serves as a critical determinant of market dynamics. Notably, the Asia-Pacific (APAC) region has emerged as a dominant force, capturing the largest market share in 2023 and projected to maintain its leadership position throughout the forecast period from 2024 to 2030. This ascendancy is particularly exemplified by China, boasting a massive population base and a burgeoning middle class increasingly turning to alternative financing options like P2P lending. Furthermore, India's rapidly growing fintech ecosystem and Southeast Asia's enthusiastic adoption of digital financial services contribute significantly to APAC's robust performance in this sector. As APAC continues to drive the global P2P lending landscape, Europe emerges as a promising market ripe with potential. With a mature financial infrastructure and increasing consumer demand for alternative investment opportunities, Europe presents a fertile ground for P2P lending platforms to flourish. Moreover, regulatory frameworks supportive of fintech innovation and a growing acceptance of online lending platforms further bolster the prospects for P2P lending growth in the region.
P2P Lending Market Drivers
Demand from SMEs and consumer credits
P2P lending is seeing increased demand from small and medium businesses and consumer credits due to strict credit policies followed by banks. This is driving customers to turn to P2P lending platforms that have relatively faster credit approvals. According to statistics from the Peer-to-Peer Finance Association (P2PFA), the net lending flow to small and medium enterprises on P2P platforms has seen significant growth compared to net lending by major high street banks.
Block chain based P2P Lending
Block chain technology eliminates intermediaries from P2P lending process. Hence, adoption of block chain in P2P lending will make the entire process transparent and reliable for both lenders and borrowers. The increased transparency is expected to help the declining market in China, which is severely dented by fraudulent activities, and weakened investor and borrower sentiments. Hong Kong-based Alchemy Coin is a block chain-based P2P lending market place that facilitates instant and direct lending between borrowers and lenders by leveraging block chain and smart contracts.
P2P Lending Market Challenges
Competition from the big tech firms
P2P lending, along with the other forms of lending models is facing severe threat of disruption with the arrival of big technology firms in the lending sector. Players such as Amazon with large retail customer base have entered into the lending market place by partnering with various existent lenders. Similar to Amazon, Google and Facebook have also ventured into financial lending. Huge financial muscle coupled with technical expertise and firsthand experience of handling large customer bases give these multinational tech firms a great advantage in financial services market.
Market Landscape
Partnerships and acquisitions along with product developments and up gradation are the key strategies adopted by players in the P2P Lending Market. The major players in the P2P Lending Market include Upstart Network Inc., Funding Circle, Lending Tree LLC, Lending Club, Perform, Circleback Lending, Zopa Ltd., Social Finance Inc., and Kiva Micro funds among others.
Partnerships/Mergers/Acquisitions
In April 2023, Uni Cards has acquired peer-to-peer lending platform OHMY Technologies (known as OMLP2P), according to a person aware of the development. OML owns a NBFC-P2P licence from the Reserve Bank of India.
In May 2022, Neobank Fi Launches P2P Lending, diversifies by entering mutual funds space. Fi Money, a neobank, diversified its offering by rolling out an investment platform in a bid to attract more retail investors. The firm's savings arm plans to offer mutual fund investments and will soon launch peer-to-peer (P2P) lending.
R&D Investments/Funding
In Sept 2022, Fintech startup Cred will invest $10 million to acquire a minority stake in peer-to-peer (P2P) non-banking financial company LiquiLoans. Cred will pick up about 5-6% in the company, valuing it at around $200 million.
P2P Lending Market Research Scope:
The base year of the study is 2023, with forecast done up to 2030. The study presents a thorough analysis of the competitive landscape, taking into account the market shares of the leading companies. These provide the key market participants with the necessary business intelligence and help them understand the future of the P2P Lending Market. The assessment includes the forecast, an overview of the competitive structure, the market shares of the competitors, as well as the market trends, market demands, market drivers, market challenges, and product analysis. The market drivers and restraints have been assessed to fathom their impact over the forecast period. This report further identifies the key opportunities for growth while also detailing the key challenges and possible threats. The key areas of focus include the types of P2P Lending Market, and their specific applications consumer, business, real estate and others.
For more Information and Communication Technology related reports, please click here
1. P2P Lending - Market Overview
1.1 Definitions and Scope
2. P2P Lending - Executive Summary
2.1 Market Revenue, Market Size and Key Trends by Company
2.2 Key trends by type
2.3 Key trends segmented by geography
3. P2P Lending Market – Market Landscape
3.1 Comparative analysis
3.1.1 Product Benchmarking - Top 10 companies
3.1.2 Top 5 Financials Analysis
3.1.3 Market Value split by Top 10 companies
3.1.4 Patent Analysis - Top 10 companies
3.1.5 Pricing Analysis
4. P2P Lending – Startup Companies Scenario
4.1 Top 10 startup company Analysis by
4.2 Investment
4.3 Revenue
4.4 Market Shares
4.5 Market Size and Application Analysis
4.6 Venture Capital and Funding Scenario
5. P2P Lending – Industry Market Entry Scenario Premium
5.1 Regulatory Framework Overview
5.2 New Business and Ease of Doing business index
5.3 Case studies of successful ventures
5.4 Customer Analysis – Top 10 companies Investment
6. P2P Lending - Market Forces
6.1 Market Drivers
6.2 Market Constraints
6.3 Market Opportunities
6.4 Porters five force model
6.4.1 Bargaining power of suppliers
6.4.2 Bargaining powers of customers
6.4.3 Threat of new entrants
6.4.4 Rivalry among existing players
6.4.5 Threat of substitutes
7. P2P Lending – Strategic Analysis
7.1 Value chain analysis
7.2 Opportunities analysis
7.3 Product life cycle
7.4 Suppliers and distributors Market Share
8. P2P Lending Market – By Platform (Market Size -$Billion)
8.1 Commercial Platform
8.2 Non-Profit Platform
9. P2P Lending Market – By Operation Pattern (Market Size -$Billion)
9.1 Online
9.2 Offline
10. P2P Lending Market – By Application (Market Size -$Billion)
10.1 Consumer
10.2 Business
10.3 Real Estate
10.4 Others
11. P2P Lending Market - By Geography (Market Size -$Billions)
11.1 North America
11.1.1 U.S
11.1.2 Canada
11.1.3 Mexico
11.2 South America
11.2.1 Brazil
11.2.2 Chile
11.2.3 Argentina
11.2.4 Rest of South America
11.3 Europe
11.3.1 UK
11.3.2 Germany
11.3.3 Nordics
11.3.4 France
11.3.5 Italy
11.3.6 Spain
11.3.7 Rest of Europe
11.4 Asia-Pacific
11.4.1 China
11.4.2 Australia
11.4.3 Japan
11.4.4 South Korea
11.4.5 Indonesia
11.4.6 India
11.4.7 Rest of APAC
11.5 RoW
11.5.1 Middle East
11.5.2 Africa
12. P2P Lending Market - Entropy
13. P2P Lending Market Company Analysis
13.1 Market Share, Company Revenue, Products, M&A, Developments
13.2 Upstart Network Inc
13.3 Funding Circle
13.4 Lending Tree LLC
13.5 Lending Club
13.6 Zopa Ltd.
13.7 Social Finance Inc.
13.8 Kiva Micro funds
13.9 Peerform
13.10 SoFi
13.11 Prosper and more
"*Financials would be provided on a best effort basis for private companies"
Connect with our experts to get customized reports that best suit your requirements. Our reports include global-level data, niche markets and competitive landscape.
List of Tables
Table 1 P2P Lending Market Overview 2023-2030
Table 2 P2P Lending Market Leader Analysis 2023-2030 (US$)
Table 3 P2P Lending MarketProduct Analysis 2023-2030 (US$)
Table 4 P2P Lending MarketEnd User Analysis 2023-2030 (US$)
Table 5 P2P Lending MarketPatent Analysis 2013-2023* (US$)
Table 6 P2P Lending MarketFinancial Analysis 2023-2030 (US$)
Table 7 P2P Lending Market Driver Analysis 2023-2030 (US$)
Table 8 P2P Lending MarketChallenges Analysis 2023-2030 (US$)
Table 9 P2P Lending MarketConstraint Analysis 2023-2030 (US$)
Table 10 P2P Lending Market Supplier Bargaining Power Analysis 2023-2030 (US$)
Table 11 P2P Lending Market Buyer Bargaining Power Analysis 2023-2030 (US$)
Table 12 P2P Lending Market Threat of Substitutes Analysis 2023-2030 (US$)
Table 13 P2P Lending Market Threat of New Entrants Analysis 2023-2030 (US$)
Table 14 P2P Lending Market Degree of Competition Analysis 2023-2030 (US$)
Table 15 P2P Lending MarketValue Chain Analysis 2023-2030 (US$)
Table 16 P2P Lending MarketPricing Analysis 2023-2030 (US$)
Table 17 P2P Lending MarketOpportunities Analysis 2023-2030 (US$)
Table 18 P2P Lending MarketProduct Life Cycle Analysis 2023-2030 (US$)
Table 19 P2P Lending MarketSupplier Analysis 2023-2030 (US$)
Table 20 P2P Lending MarketDistributor Analysis 2023-2030 (US$)
Table 21 P2P Lending Market Trend Analysis 2023-2030 (US$)
Table 22 P2P Lending Market Size 2023 (US$)
Table 23 P2P Lending Market Forecast Analysis 2023-2030 (US$)
Table 24 P2P Lending Market Sales Forecast Analysis 2023-2030 (Units)
Table 25 P2P Lending Market, Revenue & Volume,By Platform, 2023-2030 ($)
Table 26 P2P Lending MarketBy Platform, Revenue & Volume,By Commercial Platform, 2023-2030 ($)
Table 27 P2P Lending MarketBy Platform, Revenue & Volume,By Non-Profit Platform, 2023-2030 ($)
Table 28 P2P Lending Market, Revenue & Volume,By Operation Pattern, 2023-2030 ($)
Table 29 P2P Lending MarketBy Operation Pattern, Revenue & Volume,By Online, 2023-2030 ($)
Table 30 P2P Lending MarketBy Operation Pattern, Revenue & Volume,By Offline, 2023-2030 ($)
Table 31 P2P Lending Market, Revenue & Volume,By Application, 2023-2030 ($)
Table 32 P2P Lending MarketBy Application, Revenue & Volume,By Consumer, 2023-2030 ($)
Table 33 P2P Lending MarketBy Application, Revenue & Volume,By Business, 2023-2030 ($)
Table 34 P2P Lending MarketBy Application, Revenue & Volume,By Real Estate, 2023-2030 ($)
Table 35 North America P2P Lending Market, Revenue & Volume,By Platform, 2023-2030 ($)
Table 36 North America P2P Lending Market, Revenue & Volume,By Operation Pattern, 2023-2030 ($)
Table 37 North America P2P Lending Market, Revenue & Volume,By Application, 2023-2030 ($)
Table 38 South america P2P Lending Market, Revenue & Volume,By Platform, 2023-2030 ($)
Table 39 South america P2P Lending Market, Revenue & Volume,By Operation Pattern, 2023-2030 ($)
Table 40 South america P2P Lending Market, Revenue & Volume,By Application, 2023-2030 ($)
Table 41 Europe P2P Lending Market, Revenue & Volume,By Platform, 2023-2030 ($)
Table 42 Europe P2P Lending Market, Revenue & Volume,By Operation Pattern, 2023-2030 ($)
Table 43 Europe P2P Lending Market, Revenue & Volume,By Application, 2023-2030 ($)
Table 44 APAC P2P Lending Market, Revenue & Volume,By Platform, 2023-2030 ($)
Table 45 APAC P2P Lending Market, Revenue & Volume,By Operation Pattern, 2023-2030 ($)
Table 46 APAC P2P Lending Market, Revenue & Volume,By Application, 2023-2030 ($)
Table 47 Middle East & Africa P2P Lending Market, Revenue & Volume,By Platform, 2023-2030 ($)
Table 48 Middle East & Africa P2P Lending Market, Revenue & Volume,By Operation Pattern, 2023-2030 ($)
Table 49 Middle East & Africa P2P Lending Market, Revenue & Volume,By Application, 2023-2030 ($)
Table 50 Russia P2P Lending Market, Revenue & Volume,By Platform, 2023-2030 ($)
Table 51 Russia P2P Lending Market, Revenue & Volume,By Operation Pattern, 2023-2030 ($)
Table 52 Russia P2P Lending Market, Revenue & Volume,By Application, 2023-2030 ($)
Table 53 Israel P2P Lending Market, Revenue & Volume,By Platform, 2023-2030 ($)
Table 54 Israel P2P Lending Market, Revenue & Volume,By Operation Pattern, 2023-2030 ($)
Table 55 Israel P2P Lending Market, Revenue & Volume,By Application, 2023-2030 ($)
Table 56 Top Companies 2023 (US$)P2P Lending Market, Revenue & Volume
Table 57 Product Launch 2023-2030P2P Lending Market, Revenue & Volume
Table 58 Mergers & Acquistions 2023-2030P2P Lending Market, Revenue & Volume
List of Figures
Figure 1 Overview of P2P Lending Market 2023-2030
Figure 2 Market Share Analysis for P2P Lending Market 2023 (US$)
Figure 3 Product Comparison in P2P Lending Market 2023-2030 (US$)
Figure 4 End User Profile for P2P Lending Market 2023-2030 (US$)
Figure 5 Patent Application and Grant in P2P Lending Market 2013-2023* (US$)
Figure 6 Top 5 Companies Financial Analysis in P2P Lending Market 2023-2030 (US$)
Figure 7 Market Entry Strategy in P2P Lending Market 2023-2030
Figure 8 Ecosystem Analysis in P2P Lending Market2023
Figure 9 Average Selling Price in P2P Lending Market 2023-2030
Figure 10 Top Opportunites in P2P Lending Market 2023-2030
Figure 11 Market Life Cycle Analysis in P2P Lending Market
Figure 12 GlobalBy PlatformP2P Lending Market Revenue, 2023-2030 ($)
Figure 13 GlobalBy Operation PatternP2P Lending Market Revenue, 2023-2030 ($)
Figure 14 GlobalBy ApplicationP2P Lending Market Revenue, 2023-2030 ($)
Figure 15 Global P2P Lending Market - By Geography
Figure 16 Global P2P Lending Market Value & Volume, By Geography, 2023-2030 ($)
Figure 17 Global P2P Lending Market CAGR, By Geography, 2023-2030 (%)
Figure 18 North America P2P Lending Market Value & Volume, 2023-2030 ($)
Figure 19 US P2P Lending Market Value & Volume, 2023-2030 ($)
Figure 20 US GDP and Population, 2023-2030 ($)
Figure 21 US GDP – Composition of 2023, By Sector of Origin
Figure 22 US Export and Import Value & Volume, 2023-2030 ($)
Figure 23 Canada P2P Lending Market Value & Volume, 2023-2030 ($)
Figure 24 Canada GDP and Population, 2023-2030 ($)
Figure 25 Canada GDP – Composition of 2023, By Sector of Origin
Figure 26 Canada Export and Import Value & Volume, 2023-2030 ($)
Figure 27 Mexico P2P Lending Market Value & Volume, 2023-2030 ($)
Figure 28 Mexico GDP and Population, 2023-2030 ($)
Figure 29 Mexico GDP – Composition of 2023, By Sector of Origin
Figure 30 Mexico Export and Import Value & Volume, 2023-2030 ($)
Figure 31 South America P2P Lending MarketSouth America 3D Printing Market Value & Volume, 2023-2030 ($)
Figure 32 Brazil P2P Lending Market Value & Volume, 2023-2030 ($)
Figure 33 Brazil GDP and Population, 2023-2030 ($)
Figure 34 Brazil GDP – Composition of 2023, By Sector of Origin
Figure 35 Brazil Export and Import Value & Volume, 2023-2030 ($)
Figure 36 Venezuela P2P Lending Market Value & Volume, 2023-2030 ($)
Figure 37 Venezuela GDP and Population, 2023-2030 ($)
Figure 38 Venezuela GDP – Composition of 2023, By Sector of Origin
Figure 39 Venezuela Export and Import Value & Volume, 2023-2030 ($)
Figure 40 Argentina P2P Lending Market Value & Volume, 2023-2030 ($)
Figure 41 Argentina GDP and Population, 2023-2030 ($)
Figure 42 Argentina GDP – Composition of 2023, By Sector of Origin
Figure 43 Argentina Export and Import Value & Volume, 2023-2030 ($)
Figure 44 Ecuador P2P Lending Market Value & Volume, 2023-2030 ($)
Figure 45 Ecuador GDP and Population, 2023-2030 ($)
Figure 46 Ecuador GDP – Composition of 2023, By Sector of Origin
Figure 47 Ecuador Export and Import Value & Volume, 2023-2030 ($)
Figure 48 Peru P2P Lending Market Value & Volume, 2023-2030 ($)
Figure 49 Peru GDP and Population, 2023-2030 ($)
Figure 50 Peru GDP – Composition of 2023, By Sector of Origin
Figure 51 Peru Export and Import Value & Volume, 2023-2030 ($)
Figure 52 Colombia P2P Lending Market Value & Volume, 2023-2030 ($)
Figure 53 Colombia GDP and Population, 2023-2030 ($)
Figure 54 Colombia GDP – Composition of 2023, By Sector of Origin
Figure 55 Colombia Export and Import Value & Volume, 2023-2030 ($)
Figure 56 Costa Rica P2P Lending MarketCosta Rica 3D Printing Market Value & Volume, 2023-2030 ($)
Figure 57 Costa Rica GDP and Population, 2023-2030 ($)
Figure 58 Costa Rica GDP – Composition of 2023, By Sector of Origin
Figure 59 Costa Rica Export and Import Value & Volume, 2023-2030 ($)
Figure 60 Europe P2P Lending Market Value & Volume, 2023-2030 ($)
Figure 61 U.K P2P Lending Market Value & Volume, 2023-2030 ($)
Figure 62 U.K GDP and Population, 2023-2030 ($)
Figure 63 U.K GDP – Composition of 2023, By Sector of Origin
Figure 64 U.K Export and Import Value & Volume, 2023-2030 ($)
Figure 65 Germany P2P Lending Market Value & Volume, 2023-2030 ($)
Figure 66 Germany GDP and Population, 2023-2030 ($)
Figure 67 Germany GDP – Composition of 2023, By Sector of Origin
Figure 68 Germany Export and Import Value & Volume, 2023-2030 ($)
Figure 69 Italy P2P Lending Market Value & Volume, 2023-2030 ($)
Figure 70 Italy GDP and Population, 2023-2030 ($)
Figure 71 Italy GDP – Composition of 2023, By Sector of Origin
Figure 72 Italy Export and Import Value & Volume, 2023-2030 ($)
Figure 73 France P2P Lending Market Value & Volume, 2023-2030 ($)
Figure 74 France GDP and Population, 2023-2030 ($)
Figure 75 France GDP – Composition of 2023, By Sector of Origin
Figure 76 France Export and Import Value & Volume, 2023-2030 ($)
Figure 77 Netherlands P2P Lending Market Value & Volume, 2023-2030 ($)
Figure 78 Netherlands GDP and Population, 2023-2030 ($)
Figure 79 Netherlands GDP – Composition of 2023, By Sector of Origin
Figure 80 Netherlands Export and Import Value & Volume, 2023-2030 ($)
Figure 81 Belgium P2P Lending Market Value & Volume, 2023-2030 ($)
Figure 82 Belgium GDP and Population, 2023-2030 ($)
Figure 83 Belgium GDP – Composition of 2023, By Sector of Origin
Figure 84 Belgium Export and Import Value & Volume, 2023-2030 ($)
Figure 85 Spain P2P Lending Market Value & Volume, 2023-2030 ($)
Figure 86 Spain GDP and Population, 2023-2030 ($)
Figure 87 Spain GDP – Composition of 2023, By Sector of Origin
Figure 88 Spain Export and Import Value & Volume, 2023-2030 ($)
Figure 89 Denmark P2P Lending Market Value & Volume, 2023-2030 ($)
Figure 90 Denmark GDP and Population, 2023-2030 ($)
Figure 91 Denmark GDP – Composition of 2023, By Sector of Origin
Figure 92 Denmark Export and Import Value & Volume, 2023-2030 ($)
Figure 93 APAC P2P Lending Market Value & Volume, 2023-2030 ($)
Figure 94 China P2P Lending MarketValue & Volume, 2023-2030
Figure 95 China GDP and Population, 2023-2030 ($)
Figure 96 China GDP – Composition of 2023, By Sector of Origin
Figure 97 China Export and Import Value & Volume, 2023-2030 ($)P2P Lending MarketChina Export and Import Value & Volume, 2023-2030 ($)
Figure 98 Australia P2P Lending Market Value & Volume, 2023-2030 ($)
Figure 99 Australia GDP and Population, 2023-2030 ($)
Figure 100 Australia GDP – Composition of 2023, By Sector of Origin
Figure 101 Australia Export and Import Value & Volume, 2023-2030 ($)
Figure 102 South Korea P2P Lending Market Value & Volume, 2023-2030 ($)
Figure 103 South Korea GDP and Population, 2023-2030 ($)
Figure 104 South Korea GDP – Composition of 2023, By Sector of Origin
Figure 105 South Korea Export and Import Value & Volume, 2023-2030 ($)
Figure 106 India P2P Lending Market Value & Volume, 2023-2030 ($)
Figure 107 India GDP and Population, 2023-2030 ($)
Figure 108 India GDP – Composition of 2023, By Sector of Origin
Figure 109 India Export and Import Value & Volume, 2023-2030 ($)
Figure 110 Taiwan P2P Lending MarketTaiwan 3D Printing Market Value & Volume, 2023-2030 ($)
Figure 111 Taiwan GDP and Population, 2023-2030 ($)
Figure 112 Taiwan GDP – Composition of 2023, By Sector of Origin
Figure 113 Taiwan Export and Import Value & Volume, 2023-2030 ($)
Figure 114 Malaysia P2P Lending MarketMalaysia 3D Printing Market Value & Volume, 2023-2030 ($)
Figure 115 Malaysia GDP and Population, 2023-2030 ($)
Figure 116 Malaysia GDP – Composition of 2023, By Sector of Origin
Figure 117 Malaysia Export and Import Value & Volume, 2023-2030 ($)
Figure 118 Hong Kong P2P Lending MarketHong Kong 3D Printing Market Value & Volume, 2023-2030 ($)
Figure 119 Hong Kong GDP and Population, 2023-2030 ($)
Figure 120 Hong Kong GDP – Composition of 2023, By Sector of Origin
Figure 121 Hong Kong Export and Import Value & Volume, 2023-2030 ($)
Figure 122 Middle East & Africa P2P Lending MarketMiddle East & Africa 3D Printing Market Value & Volume, 2023-2030 ($)
Figure 123 Russia P2P Lending MarketRussia 3D Printing Market Value & Volume, 2023-2030 ($)
Figure 124 Russia GDP and Population, 2023-2030 ($)
Figure 125 Russia GDP – Composition of 2023, By Sector of Origin
Figure 126 Russia Export and Import Value & Volume, 2023-2030 ($)
Figure 127 Israel P2P Lending Market Value & Volume, 2023-2030 ($)
Figure 128 Israel GDP and Population, 2023-2030 ($)
Figure 129 Israel GDP – Composition of 2023, By Sector of Origin
Figure 130 Israel Export and Import Value & Volume, 2023-2030 ($)
Figure 131 Entropy Share, By Strategies, 2023-2030* (%)P2P Lending Market
Figure 132 Developments, 2023-2030*P2P Lending Market
Figure 133 Company 1 P2P Lending Market Net Revenue, By Years, 2023-2030* ($)
Figure 134 Company 1 P2P Lending Market Net Revenue Share, By Business segments, 2023 (%)
Figure 135 Company 1 P2P Lending Market Net Sales Share, By Geography, 2023 (%)
Figure 136 Company 2 P2P Lending Market Net Revenue, By Years, 2023-2030* ($)
Figure 137 Company 2 P2P Lending Market Net Revenue Share, By Business segments, 2023 (%)
Figure 138 Company 2 P2P Lending Market Net Sales Share, By Geography, 2023 (%)
Figure 139 Company 3P2P Lending Market Net Revenue, By Years, 2023-2030* ($)
Figure 140 Company 3P2P Lending Market Net Revenue Share, By Business segments, 2023 (%)
Figure 141 Company 3P2P Lending Market Net Sales Share, By Geography, 2023 (%)
Figure 142 Company 4 P2P Lending Market Net Revenue, By Years, 2023-2030* ($)
Figure 143 Company 4 P2P Lending Market Net Revenue Share, By Business segments, 2023 (%)
Figure 144 Company 4 P2P Lending Market Net Sales Share, By Geography, 2023 (%)
Figure 145 Company 5 P2P Lending Market Net Revenue, By Years, 2023-2030* ($)
Figure 146 Company 5 P2P Lending Market Net Revenue Share, By Business segments, 2023 (%)
Figure 147 Company 5 P2P Lending Market Net Sales Share, By Geography, 2023 (%)
Figure 148 Company 6 P2P Lending Market Net Revenue, By Years, 2023-2030* ($)
Figure 149 Company 6 P2P Lending Market Net Revenue Share, By Business segments, 2023 (%)
Figure 150 Company 6 P2P Lending Market Net Sales Share, By Geography, 2023 (%)
Figure 151 Company 7 P2P Lending Market Net Revenue, By Years, 2023-2030* ($)
Figure 152 Company 7 P2P Lending Market Net Revenue Share, By Business segments, 2023 (%)
Figure 153 Company 7 P2P Lending Market Net Sales Share, By Geography, 2023 (%)
Figure 154 Company 8 P2P Lending Market Net Revenue, By Years, 2023-2030* ($)
Figure 155 Company 8 P2P Lending Market Net Revenue Share, By Business segments, 2023 (%)
Figure 156 Company 8 P2P Lending Market Net Sales Share, By Geography, 2023 (%)
Figure 157 Company 9 P2P Lending Market Net Revenue, By Years, 2023-2030* ($)
Figure 158 Company 9 P2P Lending Market Net Revenue Share, By Business segments, 2023 (%)
Figure 159 Company 9 P2P Lending Market Net Sales Share, By Geography, 2023 (%)
Figure 160 Company 10 P2P Lending Market Net Revenue, By Years, 2023-2030* ($)
Figure 161 Company 10 P2P Lending Market Net Revenue Share, By Business segments, 2023 (%)
Figure 162 Company 10 P2P Lending Market Net Sales Share, By Geography, 2023 (%)
Figure 163 Company 11 P2P Lending Market Net Revenue, By Years, 2023-2030* ($)
Figure 164 Company 11 P2P Lending Market Net Revenue Share, By Business segments, 2023 (%)
Figure 165 Company 11 P2P Lending Market Net Sales Share, By Geography, 2023 (%)
Figure 166 Company 12 P2P Lending Market Net Revenue, By Years, 2023-2030* ($)
Figure 167 Company 12 P2P Lending Market Net Revenue Share, By Business segments, 2023 (%)
Figure 168 Company 12 P2P Lending Market Net Sales Share, By Geography, 2023 (%)
Figure 169 Company 13P2P Lending Market Net Revenue, By Years, 2023-2030* ($)
Figure 170 Company 13P2P Lending Market Net Revenue Share, By Business segments, 2023 (%)
Figure 171 Company 13P2P Lending Market Net Sales Share, By Geography, 2023 (%)
Figure 172 Company 14 P2P Lending Market Net Revenue, By Years, 2023-2030* ($)
Figure 173 Company 14 P2P Lending Market Net Revenue Share, By Business segments, 2023 (%)
Figure 174 Company 14 P2P Lending Market Net Sales Share, By Geography, 2023 (%)
Figure 175 Company 15 P2P Lending Market Net Revenue, By Years, 2023-2030* ($)
Figure 176 Company 15 P2P Lending Market Net Revenue Share, By Business segments, 2023 (%)
Figure 177 Company 15 P2P Lending Market Net Sales Share, By Geography, 2023 (%)