U.S. HVAC Equipment Market - Forecast(2025 - 2031)

Report Code: ESR 0571 Report Format: PDF + Excel

U.S. HVAC Equipment Market Overview:

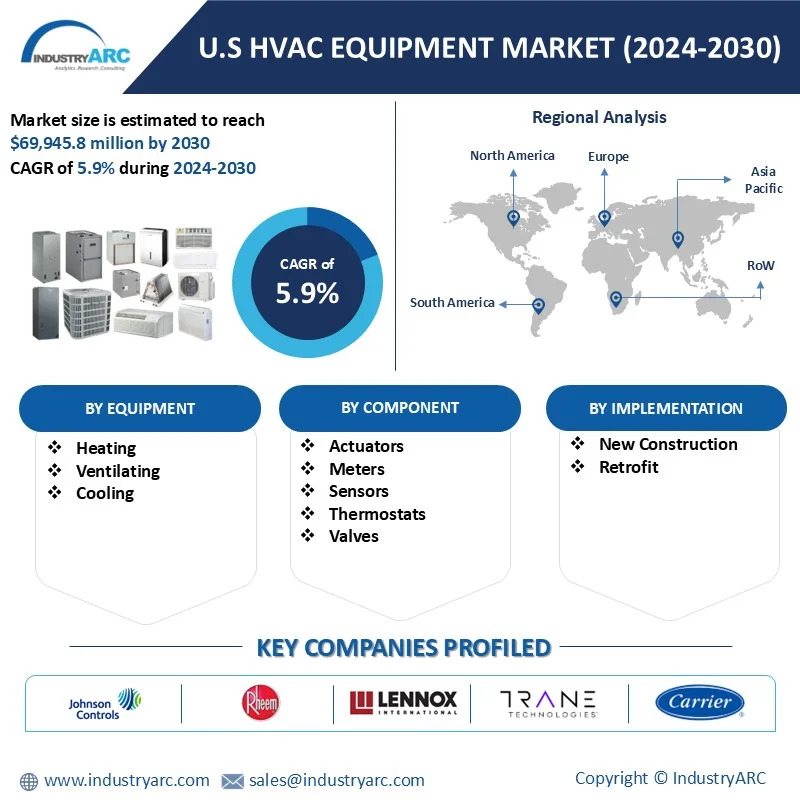
U.S. HVAC Equipment Market size is estimated to reach $69,945.8 Million by 2030, growing at a CAGR of 5.9% during the forecast period 2024-2030. The U.S. HVAC (Heating, Ventilation, and Air Conditioning) equipment market has experienced steady growth, driven by technological advancements, energy efficiency regulations, and increasing demand for smart systems. The market is projected to grow further, fueled by rising construction activities, especially in the residential and commercial sectors, and a growing emphasis on sustainable building solutions. Key trends include the adoption of smart and connected HVAC systems, allowing for remote monitoring and enhanced energy management. The integration of IoT (Internet of Things) and AI (Artificial Intelligence) is transforming HVAC systems into intelligent solutions, optimizing performance and reducing energy consumption.

Additionally, the shift toward environmentally friendly refrigerants, driven by government regulations like the phasedown of hydrofluorocarbons (HFCs), is reshaping product development. The rise in demand for energy-efficient systems, such as heat pumps and variable refrigerant flow (VRF) systems, reflects increasing consumer awareness about energy savings and reduced carbon footprints. Market players are focusing on product innovation, offering compact and flexible systems suitable for diverse applications. Furthermore, the HVAC aftermarket is growing, driven by the need for regular maintenance, repair services, and retrofitting of older systems to meet modern energy standards. This dynamic market is poised for continued innovation and expansion.

Market Snapshot: 

U.S. HVAC Equipment Market

U.S. HVAC Equipment Market - Report Coverage:

The “U.S. HVAC Equipment Market Report - Forecast (2024-2030)” by IndustryARC, covers an in-depth analysis of the following segments in the U.S. HVAC Equipment Market.


Attribute

Segment

By Equipment

·           Heating

·           Ventilating

·           Cooling

By Component

·           Actuators

·           Meters

·           Sensors

·           Thermostats

·           Valves

·           Others

By Implementation

·           New Construction

·           Retrofit

By Distribution Channel

·           Direct

·           Indirect

By Phase

·           Single-phase

·           Double-phase

·           Three-phase

·           More than Three-phase

·           Variable Phase

By End-Use

·           Residential

·           Commercial

·           Industrial


COVID-19 / Ukraine Crisis - Impact Analysis:

•    The COVID-19 pandemic disrupted the U.S. HVAC Equipment Market, causing supply chain interruptions, delayed construction projects, and reduced consumer spending. However, increased demand for air quality solutions and energy-efficient systems in residential and healthcare sectors spurred recovery, driving innovation and adoption of advanced HVAC technologies for improved indoor air quality.
•    The Ukraine crisis impacted the U.S. HVAC Equipment Market by exacerbating supply chain challenges and driving up raw material costs, particularly for metals and energy. Rising geopolitical tensions increased manufacturing expenses, but growing demand for energy-efficient systems and government incentives helped offset the challenges, stabilizing market growth in the long term.

Key Takeaways:

•    Cooling Segment is Leading the Market

In the segmentation of the U.S. HVAC Equipment Market by Equipment type, the Cooling segment stands out prominently, holding the majority market share of 53.2% in 2023. This significant share highlights the increasing demand for cooling solutions, driven by rising temperatures and consumer preferences for enhanced comfort. The segment includes air conditioners, chillers, and cooling towers, catering to both residential and commercial sectors. Growth is further propelled by technological advancements, such as energy-efficient models and smart cooling systems that align with sustainability goals and regulatory standards. The residential sector remains a key contributor, with homeowners investing in upgrades and replacements to improve energy efficiency and reduce utility costs. Meanwhile, commercial establishments, particularly in retail, healthcare, and data centers, rely heavily on advanced cooling systems to ensure operational efficiency and occupant comfort. As climate change intensifies and urbanization accelerates, the Cooling segment is expected to maintain its leadership position, driving innovation and shaping the future of the U.S. HVAC market.

•    Sensors Segment to Register Highest Growth

In the U.S. HVAC Equipment Market, the Sensors segment is experiencing the fastest growth of 7.8% in the forecast period of 2024-2030. This growth is fueled by the rising adoption of smart HVAC systems that leverage sensor technologies to optimize energy efficiency, enhance performance, and improve indoor air quality. Sensors play a critical role in monitoring temperature, humidity, air pressure, and occupancy levels, enabling precise system adjustments to meet dynamic environmental conditions. The demand for energy-efficient buildings, coupled with government regulations promoting sustainability and reduced carbon emissions, is driving the adoption of advanced HVAC sensors across residential, commercial, and industrial applications. Furthermore, the increasing integration of Internet of Things (IoT) and building automation systems enhances the utility of sensors, enabling real-time data analysis and predictive maintenance. As a result, the Sensors segment is poised to significantly influence the evolution of the U.S. HVAC market.

•    Rising Demand for Smart and Connected HVAC Systems a Major Driver

The rising adoption of smart and connected HVAC systems is revolutionizing the U.S. HVAC equipment market, driving substantial growth. Leveraging advancements in IoT and AI, these systems offer enhanced energy efficiency, improved comfort, and reduced operational costs, appealing to residential, commercial, and industrial users. Smart HVAC solutions allow users to monitor and control heating, ventilation, and air conditioning remotely via smartphones, tablets, or voice-activated devices, aligning with the growing demand for smart home technologies. Mitsubishi Electric Trane HVAC’s “kumo connect” initiative exemplifies this trend, enhancing their kumo cloud® mobile app to facilitate seamless contractor-homeowner interaction. Similarly, Daikin Industries’ June 2023 launch of its Daikin Sustainability & Innovation Center in Washington, D.C., demonstrates a commitment to energy-efficient technologies like inverters, heat pumps, and low-global-warming-potential refrigerants. These innovations enable proactive management and predictive maintenance, with ABI Research predicting that over 55% of HVAC systems will adopt wireless smart technology by 2030.

•    Regulatory Complexity and Compliance Costs is a Major Challenge

Regulatory complexity and rising compliance costs hinder the growth of the U.S. HVAC equipment market. Federal agencies, including the DOE and EPA, enforce strict energy efficiency and environmental standards, driving up costs. The refrigerant transition, mandated by the AIM Act of 2020, phases out HFCs, requiring lower-GWP refrigerants like R-454B and R-32 by January 2025. These changes aim to reduce HFCs by 85% by 2036 but significantly raise production costs. Additionally, the introduction of A2L systems, replacing R-410A units by the end of 2024, highlights the shift toward environmentally friendly yet costlier equipment. Meanwhile, industry dynamics are influenced by political and regulatory developments, from federal mandates to local natural gas restrictions. Compounding challenges include rising raw material costs, labor shortages, and supply chain disruptions. As stricter regulations necessitate advanced, energy-efficient technologies, manufacturers and consumers face increased financial pressures, potentially constraining market growth despite environmental benefits.

Key Market Players: 

Product launches, approvals, patents and events, acquisitions, partnerships and collaborations are key strategies adopted by players in the U.S. HVAC Equipment Market. The top 10 companies in this industry are listed below:
1.    Carrier Corporation
2.    Trane Technologies
3.    Lennox International Inc.
4.    Rheem Manufacturing Company
5.    Johnson Controls
6.    Daikin Industries, Ltd.
7.    Whirlpool Corporation
8.    Haier Group
9.    AAON Heating and Cooling Products
10.    SPX TECHNOLOGIES.

Scope of the Report: 


Report Metric

Details

Base Year Considered

2023

Forecast Period

2024–2030

CAGR

5.9%

Market Size in 2030

$69,945.8 Million


Segments Covered

By Equipment, Component, Implementation, Distribution Channel, Phase, and End-Use


Key Market Players

  1. Carrier Corporation
  2. Trane Technologies
  3. Lennox International Inc.
  4. Rheem Manufacturing Company
  5. Johnson Controls
  6. Daikin Industries, Ltd.
  7. Whirlpool Corporation
  8. Haier Group
  9. AAON Heating and Cooling Products
  10. SPX TECHNOLOGIES.


For more Electronics related reports, please click here

1.    U.S. HVAC Equipment Market - Overview
    1.1. Definitions and Scope
2.    U.S. HVAC Equipment Market - Executive summary
    2.1. Key Trends by Equipment
    2.2. Key Trends by Component
    2.3. Key Trends by Implementation
    2.4. Key Trends by Distribution Channel
    2.5. Key Trends by Phase
    2.6. Key Trends by End-Use
3.    U.S. HVAC Equipment Market 
    3.1. Comparative analysis
        3.1.1.    Product Benchmarking - Top 10 companies
        3.1.2. Top 5 Financials Analysis
        3.1.3. Market Value split by Top 10 companies
        3.1.4. Patent Analysis - Top 10 companies
        3.1.5. Pricing Analysis 
4.    U.S. HVAC Equipment Market – Startup companies Scenario Premium
    4.1. Top 10 startup company Analysis by
       4.1.1. Investment
       4.1.2. Revenue
       4.1.3. Market Shares
       4.1.4. Market Size and Application Analysis
       4.1.5. Venture Capital and Funding Scenario
5.    U.S. HVAC Equipment Market – Industry Market Entry Scenario Premium
    5.1. Regulatory Framework Overview
    5.2. New Business and Ease of Doing business index
    5.3. Case studies of successful ventures
    5.4. Customer Analysis – Top 10 companies
6.    U.S. HVAC Equipment Market Forces
    6.1. Drivers
    6.2. Constraints
    6.3. Challenges
    6.4. Porters five force model
        6.4.1.    Bargaining power of suppliers
        6.4.2.    Bargaining powers of customers
        6.4.3.    Threat of new entrants
        6.4.4.    Rivalry among existing players
        6.4.5.    Threat of substitutes 
7.    U.S. HVAC Equipment Market -Strategic analysis
    7.1. Value chain analysis
    7.2. Opportunities analysis
    7.3. Product life cycle
    7.4. Suppliers and distributors Market Share
8.    U.S. HVAC Equipment Market – By Equipment (Market Size -$Million / $Million)
    8.1. Heating
        8.1.1. Heat Pumps
            8.1.1.1. Air-to-Air Heat Pumps
            8.1.1.2. Air-to-Water Heat Pumps
            8.1.1.3. Water-to-Water Heat Pumps
        8.1.2.    Furnaces
            8.1.2.1. Oil Furnaces
            8.1.2.2. Gas Furnaces
            8.1.2.3. Electric Furnaces
        8.1.3. Boilers
            8.1.3.1. Steam Boilers
            8.1.3.2. Hot Water Boilers
        8.1.4.    Unitary Heaters
            8.1.4.1. Gas Unit Heaters
            8.1.4.2. Oil-fired Unit Heaters
            8.1.4.3. Electric Unit Heaters
    8.2. Ventilating
        8.2.1.    Air-handling Units
        8.2.2.    Air Filters
                    8.2.3.    Dehumidifiers
            8.2.3.1. Refrigeration Dehumidifiers
            8.2.3.2. Absorption Dehumidifiers
        8.2.4.    Ventilation Fans
            8.2.4.1. Crossflow Fans
            8.2.4.2. Axial Fans
            8.2.4.3. Centrifugal Fans
            8.2.4.4. Domestic Fans
            8.2.4.5. Range Hood Fans
            8.2.4.6. Power Roof Fans
        8.2.5.    Humidifiers
            8.2.5.1. Warm-mist Humidifiers
            8.2.5.2. Ultrasonic Humidifiers
            8.2.5.3. Cool-mist Humidifiers
        8.2.6.    Air Purifiers
            8.2.6.1. HEPA Air Purifiers
            8.2.6.2. Activated Carbon Air Purifiers
            8.2.6.3. Electrostatic Air Purifiers
            8.2.6.4. Ionic Air Purifiers
    8.3. Cooling
        8.3.1.    Unitary Air Conditioners
            8.3.1.1. Split Air Conditioners
            8.3.1.2. Packaged Air Conditioners
        8.3.2. VRF Systems
        8.3.3. Chillers
            8.3.3.1. Scroll Chillers
            8.3.3.2. Screw Chillers
            8.3.3.3. Centrifugal Chillers
            8.3.3.4. Reciprocating Chillers
            8.3.3.5. Absorption Chillers
        8.3.4.    Room Air Conditioners
        8.3.5.    Coolers
           8.3.5.1.    Ducted Coolers
           8.3.5.2.    Window Coolers
        8.3.6.    Cooling Towers
           8.3.6.1.    Evaporative Colling Towers
           8.3.6.2.    Dry Cooling Towers
           8.3.6.3.    Hybrid Cooling Towers
9.    U.S. HVAC Equipment Market – By Component (Market Size -$Million / $Million)
    9.1. Actuators
    9.2. Meters
    9.3. Sensors
    9.4. Thermostats
    9.5. Valves
    9.6. Others
10.    U.S. HVAC Equipment Market – By Implementation (Market Size -$Million / $Million)
     10.1. New Construction
     10.2. Retrofit
11.    U.S. HVAC Equipment Market – By Distribution Channel (Market Size -$Million / $Million)
    11.1. Direct
    11.2. Indirect
12.    U.S. HVAC Equipment Market – By Phase (Market Size -$Million / $Million)
    12.1. Single-phase
    12.2. Double-phase
    12.3. Three-phase
    12.4. More than Three-phase
    12.5. Variable Phase
13.    U.S. HVAC Equipment Market – By End-Use (Market Size -$Million / $Million)
    13.1. Residential
    13.2. Commercial
    13.3. Industrial
14.    U.S. HVAC Equipment Market - Entropy
    14.1. New product launches
    14.2. M&A's, collaborations, JVs and partnerships
15.    U.S. HVAC Equipment Market – Industry / Segment Competition landscape Premium
    15.1. Market Share Analysis
16.    U.S. HVAC Equipment Market Company Analysis
    16.1. Carrier Corporation
    16.2. Trane Technologies
    16.3. Lennox International Inc.
    16.4. Rheem Manufacturing Company
    16.5. Johnson Controls
    16.6. Daikin Industries, Ltd.
    16.7. Whirlpool Corporation
    16.8. Haier Group
    16.9. AAON Heating and Cooling Products
    16.10 .SPX TECHNOLOGIES.
    
"Financials to the Private Companies would be provided on best-effort basis."
List of Tables:
 
Table 1: U.S. HVAC Equipment Market Overview 2023-2030
Table 2: U.S. HVAC Equipment Market Leader Analysis 2023-2030 (US$)
Table 3: U.S. HVAC Equipment Market Product Analysis 2023-2030 (US$)
Table 4: U.S. HVAC Equipment Market End User Analysis 2023-2030 (US$)
Table 5: U.S. HVAC Equipment Market Patent Analysis 2013-2023* (US$)
Table 6: U.S. HVAC Equipment Market Financial Analysis 2023-2030 (US$)
Table 7: U.S. HVAC Equipment Market Driver Analysis 2023-2030 (US$)
Table 8: U.S. HVAC Equipment Market Challenges Analysis 2023-2030 (US$)
Table 9: U.S. HVAC Equipment Market Constraint Analysis 2023-2030 (US$)
Table 10: U.S. HVAC Equipment Market Supplier Bargaining Power Analysis 2023-2030 (US$)
Table 11: U.S. HVAC Equipment Market Buyer Bargaining Power Analysis 2023-2030 (US$)
Table 12: U.S. HVAC Equipment Market Threat of Substitutes Analysis 2023-2030 (US$)
Table 13: U.S. HVAC Equipment Market Threat of New Entrants Analysis 2023-2030 (US$)
Table 14: U.S. HVAC Equipment Market Degree of Competition Analysis 2023-2030 (US$)
Table 15: U.S. HVAC Equipment Market Value Chain Analysis 2023-2030 (US$)
Table 16: U.S. HVAC Equipment Market Pricing Analysis 2023-2030 (US$)
Table 17: U.S. HVAC Equipment Market Opportunities Analysis 2023-2030 (US$)
Table 18: U.S. HVAC Equipment Market Product Life Cycle Analysis 2023-2030 (US$)
Table 19: U.S. HVAC Equipment Market Supplier Analysis 2023-2030 (US$)
Table 20: U.S. HVAC Equipment Market Distributor Analysis 2023-2030 (US$)
Table 21: U.S. HVAC Equipment Market Trend Analysis 2023-2030 (US$)
Table 22: U.S. HVAC Equipment Market Size 2023 (US$)
Table 23: U.S. HVAC Equipment Market Forecast Analysis 2023-2030 (US$)
Table 24: U.S. HVAC Equipment Market Sales Forecast Analysis 2023-2030 (Units)
Table 25: U.S. HVAC Equipment Market, Revenue & Volume, By Type, 2023-2030 ($)
Table 26: U.S. HVAC Equipment Market By Type, Revenue & Volume, By Cooling, 2023-2030 ($)
Table 27: U.S. HVAC Equipment Market By Type, Revenue & Volume, By Heating, 2023-2030 ($)
Table 28: U.S. HVAC Equipment Market By Type, Revenue & Volume, By Ventilating, 2023-2030 ($)
Table 29: U.S. HVAC Equipment Market, Revenue & Volume, By Product, 2023-2030 ($)
Table 30: U.S. HVAC Equipment Market By Product, Revenue & Volume, By Actuators, 2023-2030 ($)
Table 31: U.S. HVAC Equipment Market By Product, Revenue & Volume, By Meters, 2023-2030 ($)
Table 32: U.S. HVAC Equipment Market By Product, Revenue & Volume, By Sensors, 2023-2030 ($)
Table 33: U.S. HVAC Equipment Market By Product, Revenue & Volume, By Thermostats, 2023-2030 ($)
Table 34: U.S. HVAC Equipment Market By Product, Revenue & Volume, By Valves, 2023-2030 ($)
Table 35: U.S. HVAC Equipment Market, Revenue & Volume, By End User Industry, 2023-2030 ($)
Table 36: U.S. HVAC Equipment Market By End User Industry, Revenue & Volume, By Airports, 2023-2030 ($)
Table 37: U.S. HVAC Equipment Market By End User Industry, Revenue & Volume, By Education, 2023-2030 ($)
Table 38: U.S. HVAC Equipment Market By End User Industry, Revenue & Volume, By Healthcare, 2023-2030 ($)
Table 39: U.S. HVAC Equipment Market By End User Industry, Revenue & Volume, By Residential, 2023-2030 ($)
Table 40: U.S. HVAC Equipment Market By End User Industry, Revenue & Volume, By Industrial, 2023-2030 ($)
Table 41: North America U.S. HVAC Equipment Market, Revenue & Volume, By Type, 2023-2030 ($)
Table 42: North America U.S. HVAC Equipment Market, Revenue & Volume, By Product, 2023-2030 ($)
Table 43: North America U.S. HVAC Equipment Market, Revenue & Volume, By End User Industry, 2023-2030 ($)
Table 44: South america U.S. HVAC Equipment Market, Revenue & Volume, By Type, 2023-2030 ($)
Table 45: South america U.S. HVAC Equipment Market, Revenue & Volume, By Product, 2023-2030 ($)
Table 46: South america U.S. HVAC Equipment Market, Revenue & Volume, By End User Industry, 2023-2030 ($)
Table 47: Europe U.S. HVAC Equipment Market, Revenue & Volume, By Type, 2023-2030 ($)
Table 48: Europe U.S. HVAC Equipment Market, Revenue & Volume, By Product, 2023-2030 ($)
Table 49: Europe U.S. HVAC Equipment Market, Revenue & Volume, By End User Industry, 2023-2030 ($)
Table 50: APAC U.S. HVAC Equipment Market, Revenue & Volume, By Type, 2023-2030 ($)
Table 51: APAC U.S. HVAC Equipment Market, Revenue & Volume, By Product, 2023-2030 ($)
Table 52: APAC U.S. HVAC Equipment Market, Revenue & Volume, By End User Industry, 2023-2030 ($)
Table 53: Middle East & Africa U.S. HVAC Equipment Market, Revenue & Volume, By Type, 2023-2030 ($)
Table 54: Middle East & Africa U.S. HVAC Equipment Market, Revenue & Volume, By Product, 2023-2030 ($)
Table 55: Middle East & Africa U.S. HVAC Equipment Market, Revenue & Volume, By End User Industry, 2023-2030 ($)
Table 56: Russia U.S. HVAC Equipment Market, Revenue & Volume, By Type, 2023-2030 ($)
Table 57: Russia U.S. HVAC Equipment Market, Revenue & Volume, By Product, 2023-2030 ($)
Table 58: Russia U.S. HVAC Equipment Market, Revenue & Volume, By End User Industry, 2023-2030 ($)
Table 59: Israel U.S. HVAC Equipment Market, Revenue & Volume, By Type, 2023-2030 ($)
Table 60: Israel U.S. HVAC Equipment Market, Revenue & Volume, By Product, 2023-2030 ($)
Table 61: Israel U.S. HVAC Equipment Market, Revenue & Volume, By End User Industry, 2023-2030 ($)
Table 62: Top Companies 2023 (US$) U.S. HVAC Equipment Market, Revenue & Volume
Table 63: Product Launch 2023-2030 U.S. HVAC Equipment Market, Revenue & Volume
Table 64: Mergers & Acquistions 2023-2030 U.S. HVAC Equipment Market, Revenue & Volume
 
 
List of Figures:
 
Figure 1: Overview of U.S. HVAC Equipment Market 2023-2030
Figure 2: Market Share Analysis for U.S. HVAC Equipment Market 2023 (US$)
Figure 3: Product Comparison in U.S. HVAC Equipment Market 2023-2030 (US$)
Figure 4: End User Profile for U.S. HVAC Equipment Market 2023-2030 (US$)
Figure 5: Patent Application and Grant in U.S. HVAC Equipment Market 2013-2023* (US$)
Figure 6: Top 5 Companies Financial Analysis in U.S. HVAC Equipment Market 2023-2030 (US$)
Figure 7: Market Entry Strategy in U.S. HVAC Equipment Market 2023-2030
Figure 8: Ecosystem Analysis in U.S. HVAC Equipment Market 2023
Figure 9: Average Selling Price in U.S. HVAC Equipment Market 2023-2030
Figure 10: Top Opportunites in U.S. HVAC Equipment Market 2023-2030
Figure 11: Market Life Cycle Analysis in U.S. HVAC Equipment Market
Figure 12: GlobalBy Type U.S. HVAC Equipment Market Revenue, 2023-2030 ($)
Figure 13: GlobalBy Product U.S. HVAC Equipment Market Revenue, 2023-2030 ($)
Figure 14: GlobalBy End User Industry U.S. HVAC Equipment Market Revenue, 2023-2030 ($)
Figure 15: Global U.S. HVAC Equipment Market - By Geography
Figure 16: Global U.S. HVAC Equipment Market Value & Volume, By Geography, 2023-2030 ($) 
Figure 17: Global U.S. HVAC Equipment Market CAGR, By Geography, 2023-2030 (%)
Figure 18: North America U.S. HVAC Equipment Market Value & Volume, 2023-2030 ($)
Figure 19: US U.S. HVAC Equipment Market Value & Volume, 2023-2030 ($)
Figure 20: US GDP and Population, 2023-2030 ($)
Figure 21: US GDP – Composition of 2023, By Sector of Origin
Figure 22: US Export and Import Value & Volume, 2023-2030 ($)
Figure 23: Canada U.S. HVAC Equipment Market Value & Volume, 2023-2030 ($)
Figure 24: Canada GDP and Population, 2023-2030 ($)
Figure 25: Canada GDP – Composition of 2023, By Sector of Origin
Figure 26: Canada Export and Import Value & Volume, 2023-2030 ($)
Figure 27: Mexico U.S. HVAC Equipment Market Value & Volume, 2023-2030 ($)
Figure 28: Mexico GDP and Population, 2023-2030 ($)
Figure 29: Mexico GDP – Composition of 2023, By Sector of Origin
Figure 30: Mexico Export and Import Value & Volume, 2023-2030 ($)
Figure 31: South America U.S. HVAC Equipment Market Value & Volume, 2023-2030 ($)
Figure 32: Brazil U.S. HVAC Equipment Market Value & Volume, 2023-2030 ($)
Figure 33: Brazil GDP and Population, 2023-2030 ($)
Figure 34: Brazil GDP – Composition of 2023, By Sector of Origin
Figure 35: Brazil Export and Import Value & Volume, 2023-2030 ($)
Figure 36: Venezuela U.S. HVAC Equipment Market Value & Volume, 2023-2030 ($)
Figure 37: Venezuela GDP and Population, 2023-2030 ($)
Figure 38: Venezuela GDP – Composition of 2023, By Sector of Origin
Figure 39: Venezuela Export and Import Value & Volume, 2023-2030 ($)
Figure 40: Argentina U.S. HVAC Equipment Market Value & Volume, 2023-2030 ($)
Figure 41: Argentina GDP and Population, 2023-2030 ($)
Figure 42: Argentina GDP – Composition of 2023, By Sector of Origin
Figure 43: Argentina Export and Import Value & Volume, 2023-2030 ($)
Figure 44: Ecuador U.S. HVAC Equipment Market Value & Volume, 2023-2030 ($)
Figure 45: Ecuador GDP and Population, 2023-2030 ($)
Figure 46: Ecuador GDP – Composition of 2023, By Sector of Origin
Figure 47: Ecuador Export and Import Value & Volume, 2023-2030 ($)
Figure 48: Peru U.S. HVAC Equipment Market Value & Volume, 2023-2030 ($)
Figure 49: Peru GDP and Population, 2023-2030 ($)
Figure 50: Peru GDP – Composition of 2023, By Sector of Origin
Figure 51: Peru Export and Import Value & Volume, 2023-2030 ($)
Figure 52: Colombia U.S. HVAC Equipment Market Value & Volume, 2023-2030 ($)
Figure 53: Colombia GDP and Population, 2023-2030 ($)
Figure 54: Colombia GDP – Composition of 2023, By Sector of Origin
Figure 55: Colombia Export and Import Value & Volume, 2023-2030 ($)
Figure 56: Costa Rica U.S. HVAC Equipment Market Value & Volume, 2023-2030 ($)
Figure 57: Costa Rica GDP and Population, 2023-2030 ($)
Figure 58: Costa Rica GDP – Composition of 2023, By Sector of Origin
Figure 59: Costa Rica Export and Import Value & Volume, 2023-2030 ($)
Figure 60: Europe U.S. HVAC Equipment Market Value & Volume, 2023-2030 ($)
Figure 61: U.K U.S. HVAC Equipment Market Value & Volume, 2023-2030 ($)
Figure 62: U.K GDP and Population, 2023-2030 ($)
Figure 63: U.K GDP – Composition of 2023, By Sector of Origin
Figure 64: U.K Export and Import Value & Volume, 2023-2030 ($)
Figure 65: Germany U.S. HVAC Equipment Market Value & Volume, 2023-2030 ($)
Figure 66: Germany GDP and Population, 2023-2030 ($)
Figure 67: Germany GDP – Composition of 2023, By Sector of Origin
Figure 68: Germany Export and Import Value & Volume, 2023-2030 ($)
Figure 69: Italy U.S. HVAC Equipment Market Value & Volume, 2023-2030 ($)
Figure 70: Italy GDP and Population, 2023-2030 ($)
Figure 71: Italy GDP – Composition of 2023, By Sector of Origin
Figure 72: Italy Export and Import Value & Volume, 2023-2030 ($)
Figure 73: France U.S. HVAC Equipment Market Value & Volume, 2023-2030 ($)
Figure 74: France GDP and Population, 2023-2030 ($)
Figure 75: France GDP – Composition of 2023, By Sector of Origin
Figure 76: France Export and Import Value & Volume, 2023-2030 ($)
Figure 77: Netherlands U.S. HVAC Equipment Market Value & Volume, 2023-2030 ($)
Figure 78: Netherlands GDP and Population, 2023-2030 ($)
Figure 79: Netherlands GDP – Composition of 2023, By Sector of Origin
Figure 80: Netherlands Export and Import Value & Volume, 2023-2030 ($)
Figure 81: Belgium U.S. HVAC Equipment Market Value & Volume, 2023-2030 ($)
Figure 82: Belgium GDP and Population, 2023-2030 ($)
Figure 83: Belgium GDP – Composition of 2023, By Sector of Origin
Figure 84: Belgium Export and Import Value & Volume, 2023-2030 ($)
Figure 85: Spain U.S. HVAC Equipment Market Value & Volume, 2023-2030 ($)
Figure 86: Spain GDP and Population, 2023-2030 ($)
Figure 87: Spain GDP – Composition of 2023, By Sector of Origin
Figure 88: Spain Export and Import Value & Volume, 2023-2030 ($)
Figure 89: Denmark U.S. HVAC Equipment Market Value & Volume, 2023-2030 ($)
Figure 90: Denmark GDP and Population, 2023-2030 ($)
Figure 91: Denmark GDP – Composition of 2023, By Sector of Origin
Figure 92: Denmark Export and Import Value & Volume, 2023-2030 ($)
Figure 93: APAC U.S. HVAC Equipment Market Value & Volume, 2023-2030 ($)
Figure 94: China U.S. HVAC Equipment Market Value & Volume, 2023-2030
Figure 95: China GDP and Population, 2023-2030 ($)
Figure 96: China GDP – Composition of 2023, By Sector of Origin
Figure 97: China Export and Import Value & Volume, 2023-2030 ($) U.S. HVAC Equipment Market China Export and Import Value & Volume, 2023-2030 ($)
Figure 98: Australia U.S. HVAC Equipment Market Value & Volume, 2023-2030 ($)
Figure 99: Australia GDP and Population, 2023-2030 ($)
Figure 100: Australia GDP – Composition of 2023, By Sector of Origin
Figure 101: Australia Export and Import Value & Volume, 2023-2030 ($)
Figure 102: South Korea U.S. HVAC Equipment Market Value & Volume, 2023-2030 ($)
Figure 103: South Korea GDP and Population, 2023-2030 ($)
Figure 104: South Korea GDP – Composition of 2023, By Sector of Origin
Figure 105: South Korea Export and Import Value & Volume, 2023-2030 ($)
Figure 106: India U.S. HVAC Equipment Market Value & Volume, 2023-2030 ($)
Figure 107: India GDP and Population, 2023-2030 ($)
Figure 108: India GDP – Composition of 2023, By Sector of Origin
Figure 109: India Export and Import Value & Volume, 2023-2030 ($)
Figure 110: Taiwan U.S. HVAC Equipment Market Value & Volume, 2023-2030 ($)
Figure 111: Taiwan GDP and Population, 2023-2030 ($)
Figure 112: Taiwan GDP – Composition of 2023, By Sector of Origin
Figure 113: Taiwan Export and Import Value & Volume, 2023-2030 ($)
Figure 114: Malaysia U.S. HVAC Equipment Market Value & Volume, 2023-2030 ($)
Figure 115: Malaysia GDP and Population, 2023-2030 ($)
Figure 116: Malaysia GDP – Composition of 2023, By Sector of Origin
Figure 117: Malaysia Export and Import Value & Volume, 2023-2030 ($)
Figure 118: Hong Kong U.S. HVAC Equipment Market Value & Volume, 2023-2030 ($)
Figure 119: Hong Kong GDP and Population, 2023-2030 ($)
Figure 120: Hong Kong GDP – Composition of 2023, By Sector of Origin
Figure 121: Hong Kong Export and Import Value & Volume, 2023-2030 ($)
Figure 122: Middle East & Africa U.S. HVAC Equipment Market Middle East & Africa 3D Printing Market Value & Volume, 2023-2030 ($)
Figure 123: Russia U.S. HVAC Equipment Market Value & Volume, 2023-2030 ($)
Figure 124: Russia GDP and Population, 2023-2030 ($)
Figure 125: Russia GDP – Composition of 2023, By Sector of Origin
Figure 126: Russia Export and Import Value & Volume, 2023-2030 ($)
Figure 127: Israel U.S. HVAC Equipment Market Value & Volume, 2023-2030 ($)
Figure 128: Israel GDP and Population, 2023-2030 ($)
Figure 129: Israel GDP – Composition of 2023, By Sector of Origin
Figure 130: Israel Export and Import Value & Volume, 2023-2030 ($)
Figure 131: Entropy Share, By Strategies, 2023-2030* (%) U.S. HVAC Equipment Market 
Figure 132: Developments, 2023-2030* U.S. HVAC Equipment Market 
Figure 133: Company 1 U.S. HVAC Equipment Market Net Revenue, By Years, 2023-2030* ($)
Figure 134: Company 1 U.S. HVAC Equipment Market Net Revenue Share, By Business segments, 2023 (%)
Figure 135: Company 1 U.S. HVAC Equipment Market Net Sales Share, By Geography, 2023 (%)
Figure 136: Company 2 U.S. HVAC Equipment Market Net Revenue, By Years, 2023-2030* ($)
Figure 137: Company 2 U.S. HVAC Equipment Market Net Revenue Share, By Business segments, 2023 (%)
Figure 138: Company 2 U.S. HVAC Equipment Market Net Sales Share, By Geography, 2023 (%)
Figure 139: Company 3 U.S. HVAC Equipment Market Net Revenue, By Years, 2023-2030* ($)
Figure 140: Company 3 U.S. HVAC Equipment Market Net Revenue Share, By Business segments, 2023 (%)
Figure 141: Company 3 U.S. HVAC Equipment Market Net Sales Share, By Geography, 2023 (%)
Figure 142: Company 4 U.S. HVAC Equipment Market Net Revenue, By Years, 2023-2030* ($)
Figure 143: Company 4 U.S. HVAC Equipment Market Net Revenue Share, By Business segments, 2023 (%)
Figure 144: Company 4 U.S. HVAC Equipment Market Net Sales Share, By Geography, 2023 (%)
Figure 145: Company 5 U.S. HVAC Equipment Market Net Revenue, By Years, 2023-2030* ($)
Figure 146: Company 5 U.S. HVAC Equipment Market Net Revenue Share, By Business segments, 2023 (%)
Figure 147: Company 5 U.S. HVAC Equipment Market Net Sales Share, By Geography, 2023 (%)
Figure 148: Company 6 U.S. HVAC Equipment Market Net Revenue, By Years, 2023-2030* ($)
Figure 149: Company 6 U.S. HVAC Equipment Market Net Revenue Share, By Business segments, 2023 (%)
Figure 150: Company 6 U.S. HVAC Equipment Market Net Sales Share, By Geography, 2023 (%)
Figure 151: Company 7 U.S. HVAC Equipment Market Net Revenue, By Years, 2023-2030* ($)
Figure 152: Company 7 U.S. HVAC Equipment Market Net Revenue Share, By Business segments, 2023 (%)
Figure 153: Company 7 U.S. HVAC Equipment Market Net Sales Share, By Geography, 2023 (%)
Figure 154: Company 8 U.S. HVAC Equipment Market Net Revenue, By Years, 2023-2030* ($)
Figure 155: Company 8 U.S. HVAC Equipment Market Net Revenue Share, By Business segments, 2023 (%)
Figure 156: Company 8 U.S. HVAC Equipment Market Net Sales Share, By Geography, 2023 (%)
Figure 157: Company 9 U.S. HVAC Equipment Market Net Revenue, By Years, 2023-2030* ($)
Figure 158: Company 9 U.S. HVAC Equipment Market Net Revenue Share, By Business segments, 2023 (%)
Figure 159: Company 9 U.S. HVAC Equipment Market Net Sales Share, By Geography, 2023 (%)
Figure 160: Company 10 U.S. HVAC Equipment Market Net Revenue, By Years, 2023-2030* ($)
Figure 161: Company 10 U.S. HVAC Equipment Market Net Revenue Share, By Business segments, 2023 (%)
Figure 162: Company 10 U.S. HVAC Equipment Market Net Sales Share, By Geography, 2023 (%)
Figure 163: Company 11 U.S. HVAC Equipment Market Net Revenue, By Years, 2023-2030* ($)
Figure 164: Company 11 U.S. HVAC Equipment Market Net Revenue Share, By Business segments, 2023 (%)
Figure 165: Company 11 U.S. HVAC Equipment Market Net Sales Share, By Geography, 2023 (%)
Figure 166: Company 12 U.S. HVAC Equipment Market Net Revenue, By Years, 2023-2030* ($)
Figure 167: Company 12 U.S. HVAC Equipment Market Net Revenue Share, By Business segments, 2023 (%)
Figure 168: Company 12 U.S. HVAC Equipment Market Net Sales Share, By Geography, 2023 (%)
Figure 169: Company 13 U.S. HVAC Equipment Market Net Revenue, By Years, 2023-2030* ($)
Figure 170: Company 13 U.S. HVAC Equipment Market Net Revenue Share, By Business segments, 2023 (%)
Figure 171: Company 13 U.S. HVAC Equipment Market Net Sales Share, By Geography, 2023 (%)
Figure 172: Company 14 U.S. HVAC Equipment Market Net Revenue, By Years, 2023-2030* ($)
Figure 173: Company 14 U.S. HVAC Equipment Market Net Revenue Share, By Business segments, 2023 (%)
Figure 174: Company 14 U.S. HVAC Equipment Market Net Sales Share, By Geography, 2023 (%)
Figure 175: Company 15 U.S. HVAC Equipment Market Net Revenue, By Years, 2023-2030* ($)
Figure 176: Company 15 U.S. HVAC Equipment Market Net Revenue Share, By Business segments, 2023 (%)
Figure 177: Company 15 U.S. HVAC Equipment Market Net Sales Share, By Geography, 2023 (%)

The U.S. HVAC Equipment Market is projected to grow at 5.9% CAGR during the forecast period 2024-2030.

U.S. HVAC Equipment Market size is estimated to surpass $ 69,945.7 Million by 2030 from $ 46,562.10 million in 2023.

The leading players in the U.S. HVAC Equipment Market are Carrier Corporation, Trane Technologies, Lennox International Inc., Rheem Manufacturing Company, Johnson Controls, and Others.