 Email
Email Print
Print


Oxygenated Solvents Market - Forecast(2025 - 2031)
Oxygenated Solvents Market Overview
Oxygenated Solvents market size is estimated to reach US$45.2 billion by 2027 after growing at a CAGR of 7.8% during the forecast period 2022-2027. Oxygenated solvents are different types of organic solvents such as alcohol, esters and glycol ethers whose chemical structure contains carbon and hydrogen atoms and are produced through the chemical reaction from olefin. Due to their high solvency and purity rate, such solvents have major applicability in the automotive, aerospace, building & construction and agriculture sectors for paints & coatings, adhesives, concrete additives and intermediates applications. This is influencing the oxygenated solvents market. Construction activities have also seen a surge over the year due to the growing demand for residential units resulting in significant growth in the building & construction sector. According to Mexico’s National Institute of Statistics and Geography, in Q2 of 2021, the construction industry in Mexico posted a high year-on-year growth rate of 33.8%. In addition to this, rapid growth witnessed by the automotive, aircraft and cleaning sectors is also driving the growth of the oxygenated solvents industry. However, VOC regulations by government organizations are anticipated to pose a challenge in the market growth of oxygenated solvents, thereby negatively impacting the oxygenated solvents market size. The lockdown caused due to COVID-19 led to the closures of plants, factories and sites in major end-users of oxygenated solvents such as automotive, aerospace and building & construction. This decreased the market revenue and negatively impacted the Oxygenated Solvents industry outlook.
Oxygenated Solvents Market Report Coverage
The “Oxygenated Solvents Market Report – Forecast
(2022 – 2027)” by IndustryARC, covers an in-depth analysis of the following
segments in the Oxygenated Solvents Industry.
Key Takeaways
- North America dominates the Oxygenated Solvent industry owing to the rapidly growing automotive, building & construction and aerospace sectors. This has significantly influenced the demand for organic solvents containing carbon atoms & hydrogen atoms in the region.
- The increase in the scale of aircraft production
and deliveries to tackle the growing air passenger traffic has propelled the
demand and usage of Oxygenated Solvents in the aerospace sector as surfactant
and lubricant intermediate. This is having a positive impact on the Oxygenated Solvents industry outlook.
- The growing projects related to commercial and
residential construction have boosted Oxygenated Solvents' demand in the building
& construction sector for concrete additives, adhesives and paints &
coatings applications, thereby driving the market growth of Oxygenated Solvents.
- The VOC emissions released during conventional Oxygenated Solvents manufacturing have compelled various government
authorities to implement certain guidelines to prevent such emissions. This can hamper
the production of conventional Oxygenated Solvents, which would negatively
impact the Oxygenated Solvents market size.
Bio Green held
the largest share in the Oxygenated Solvents market share in 2021 and is
estimated to grow at a CAGR of 7.9% during the forecast period 2022-2027. Bio
green oxygenated solvents are the types of organic solvents that are driven by
renewable raw materials. Unlike conventional sources, they have low VOC levels.
Due to their eco-friendly nature, the bio green oxygenated solvents are gaining significant traction in various manufacturing industries such as
automotive, building & construction and aerospace for paints &
coatings, adhesives and intermediate applications. The rapid development
witnessed by these major end-use industries of oxygenated solvents on account
of growing investments, rapid urbanization and favorable government policies
has contributed to the segment growth of bio green sources in the Oxygenated Solvents market during the forecast period.
Oxygenated Solvents Market Segment Analysis – by End-use Industry
The building
& construction sector held the largest share in the Oxygenated Solvents
market share in 2021 and is projected to grow at a CAGR of 8.2% during the
forecast period 2022-2027. Oxygenated solvents consisting of carbon atoms &
hydrogen atoms have high solvency and purity rate. Due to this, they are used
in paints & coatings, concrete additives and adhesive applications in the
building & construction sector. Rapid urbanization and investment inflows
have increased the scale of construction output. According to Eurostat, in
February 2022, production in building construction increased by 8.6%, whereas
civil engineering construction showed a 15% increase in the Euro area.
Furthermore, according to China’s National Bureau of Statistics, in Q2
of 2021, the construction sector of China registered a growth of 1.8%, while its
cumulative growth stood at 8.6% in the first half of 2021. Such rapid growth in the building
& construction sector has propelled the demand and usage of oxygenated
solvents in the sector for paints & coatings, adhesives and concrete
additives applications. These factors continue to boost the Oxygenated Solvents market growth.
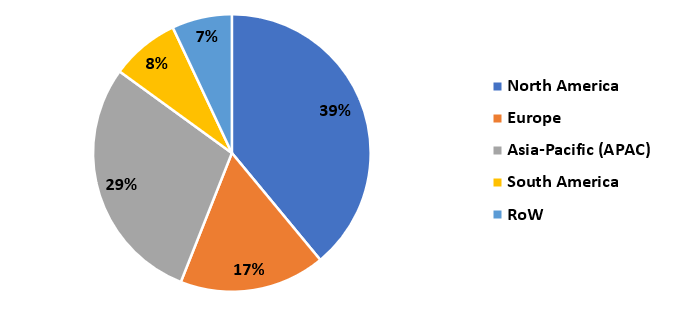
Oxygenated Solvents Market Segment Analysis – by Geography
North America held the largest Oxygenated Solvents market share of up to 39% in 2021. The region is witnessing significant growth in major end-users of oxygenated solvents such as automotive, building & construction and aerospace. According to the International Organization of Motor Vehicles Manufacturers, in 2021, automotive production in the US stood at 9.16 million units, showing a 4% increase. According to the quarterly report of Boeing, in Q1 of 2022, the company manufactured and delivered 95 commercial aircraft, showing a 23% increase in comparison to 2021 for the corresponding period. Furthermore, according to Statistics Canada, in January 2022, investment in institutional building increased by 0.6% to US$1.12 billion while industrial construction investment increased by 2.1% to US$691.4 million since mid-2020. Such rapid developments in these major end-users of oxygenated solvents would propel the usage of the solvents for paints & coatings, adhesives, additives and surface coatings applications. These factors would boost the growth of the Oxygenated Solvents industry in the North America region during the forecast period.
Oxygenated Solvents Market Drivers
Rapid Increase in Automotive Production:
Types
of organic solvents such as ketones, glycol ethers and esters have high
applicability in automotive paints & coatings, surfactants intermediate and
adhesives due to their good solvency power. The rapid development in the
automotive sector resulting from technology upgradation, growing investment
inflows and high demand for fuel-efficient vehicles has increased the
automotive production scale. According to the International
Organization of Motor Vehicle Manufacturers, in 2021, global automotive
production stood at 80.1 million units, showing a 3% increase in comparison to
2020, whereas, automotive production in South America region increased by 18%
and Africa showed a 16% increase. Such an increase in automotive production has
accelerated the demand and usage of oxygenated solvents for paints &
coatings, adhesives and surfactant intermediate. This is boosting the growth of
the Oxygenated Solvents industry during the forecast period.
Bolstering Growth in Aerospace Sector:
Oxygenated Solvents, having high solvency, are used as an intermediate in surfactants and lubricants to reduce the interfacial tension between parts. The growing air passenger traffic has increased the demand for new aircraft, thereby increasing the scale of aircraft deliveries. According to the General Aviation Manufacturers Association, in Q1 of 2022, the global aircraft production and deliveries stood at 491 units, showing a 14.7% increase in comparison to the volume produced and delivered in 2021. Furthermore, according to the annual report of Boeing, in 2021, the cumulative aircraft deliveries of the company increased by 3.5% in comparison to 2020. Such an increase in aircraft deliveries has increased the demand for oxygenated solvents in the aerospace sector to be used as surfactants and lubricants intermediate. This trend is propelling the growth of the Oxygenated Solvents industry during the forecast period.
Oxygenated Solvents Market Challenge
VOC Regulations by Government Organizations:
Oxygenated Solvents have two major sources, bio green and conventional. The manufacturing of conventional oxygenated solvents produces volatile organic compounds (VOC) whose emission into the atmosphere causes pollution problems. To prevent or minimize the emissions of volatile organic compounds, organizations such as the US Environment Protection Agency (EPA), California Air Resource Board (CARB), Ozone Transport Commission (OTC) and various other government organizations have imposed certain regulations to limit VOC emissions. Such regulations are anticipated to pose a challenge in the oxygenated solvents market growth as they can hamper the production of conventional oxygenated solvents. This might have a negative impact on the Oxygenated Solvents market size during the forecast period.
Oxygenated Solvents Industry Outlook
Technology launches,
acquisitions and R&D activities are key strategies adopted by players in
the Oxygenated Solvents market. The top 10 companies in the Oxygenated
Solvents Market are:
- Arkema Group
- Dow Chemical Company
- Exxon Mobil Corporation
- BASF SE
- Eastman Chemical Company
- LyondellBasell Industries Holding
- Royal Dutch Shell PLC
- Solvent Industry Association
- Solvay
- Banner Chemicals Limited
Recent Developments
- In April 2022, Solvay announced the production of new generation Oxygenated Solvents with excellent eco-friendly properties and non-flammability. They can be used in applications such as paint striping, agrochemistry and industrial cleaning.
- In October 2021, Brenntag formed an agreement with NXTLEVVEL biochem to expand its product portfolio of bio-green solvents which were used in household and industrial cleaning products.
- In July 2021, Merck launched a new line of complimentary green solvents which would be used in the photolithographic process during semiconductor manufacturing. This would boost the growth of bio-green solvents.
Relevant Reports
Report Code – CMR 0237
Report Code – CMR 0101
Report Code – CMR 50566
For more Chemicals and Materials Market reports, please click here