 Email
Email Print
Print


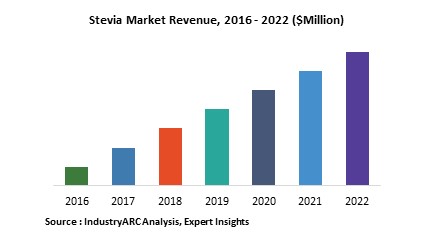
Stevia Ingredient & Retail Products Market - Forecast(2025 - 2031)
The global Stevia market has been analyzed with respect to different parameters such as demand, supply, end-users and providers of stevia based products. The Stevia market has been categorized based on key ingredients (active compounds), type of extract and end-use application. On the basis of Ingredient the report is segmented into Reb A and Stevioside, by type of extracts it is segmented into Liquid, Powder and leaves. End-use application of Stevia market mentioned in the report are table top, dressing and surface foods, confectionery, beverages, dairy foods, bakery, dietary supplements, snacks, and packaged goods.
The overall market is also presented from the perspective of different geographic regions and the key countries in each region. The market has been segmented into four regions: North America, Europe, Asia-pacific and Rest of the World. Major markets for stevia are analyzed for each region with market share analysis and regulations.
Sample Companies
Profiled in this Report are:
- PureCircle (U.S.),
- Cargill Inc. (U.S.),
- GLG LifeTech (Canada),
- Tate & Lyle (U.S.)
- SunwinStevia (China),
- 10+.
All of these companies together held a major market share in 2015. These companies have strong tie ups with food and beverage manufacturers as well as considerable brand image among the consumers. Other major players in the market include Stevia Corp (U.S.) and Ingredion Inc. (U.S.) with its brand ENLITEN.
1. Global Stevia Market-Overview.
1.1. Overview.
1.2. Classification.
1.2.1. Classification-By Key Ingredient.
1.2.2. Classification-By Type of Extract.
1.2.3. Classification- By End-Use.
1.2.4. Classification-By Region.
1.3. Stakeholders.
2. Global Stevia Market- Executive Summary.
3. Global Stevia Market- Market Landscape.
3.1. Market Share Analysis.
3.2. Financial Analysis of Top Five Players.
3.3. Product Benchmarking.
3.4. End–User Profiling.
3.5. Patent Analysis.
3.6. Government Regulations & Quality Standards.
4. Global Stevia Market – Market Forces.
4.1. Market Drivers.
4.1.1. Increasing Obesity Concern.
4.1.2. Instability Over Sugar Prices.
4.1.3. Global Regulatory Approval.
4.2. Market Constraints.
4.2.1. Presence of A Bitter Aftertaste When Consumed.
4.2.2. Possible Side Effects on The Reproductive, Renal and Cardio-Vascular Systems.
4.2.3. Cannot Be Used as A Sugar Substitute In Certain Types of Food.
4.3. Market Challenges.
4.3.1. High Cost Compared to Volume Produced.
4.3.2. High Levels of Adulteration Among Stevia Products.
4.4. Market Attractiveness.
4.4.1. Power of Suppliers.
4.4.2. Power of Customers.
4.4.3. Threat of New Entrants.
4.4.4. Threat of Substitution.
4.4.5. Degree of Competition.
5. Global Stevia Market- Strategic Analysis.
5.1. Value Chain Analysis.
5.1.1. R&D.
5.1.2. Seedlings.
5.1.3. Plantation.
5.1.4. Harvest.
5.1.5. Drying.
5.1.6. Extraction.
5.1.7. Purification and Blending.
5.1.8. Product.
5.1.9. End-Users.
5.2. Industry Life Cycle Analysis.
5.3. Opportunity Analysis.
5.4. Exports & Imports Analysis.
6. Global Sugar Substitutes Market.
6.1. High Intensity Sweeteners.
6.2. Low Intensity Sweeteners.
6.3. High Fructose Corn Syrup.
7. Global Stevia Market- By Type.
7.1. By Key functional/Sweetening ingredient.
7.1.1. Rebaudiosidea (Rebiana).
7.1.2. Stevioside.
7.2. By Type of Extracts.
7.2.1. Liquid Extracts.
7.2.1.1. Clear.
7.2.1.2. Dark.
7.2.2. Powder Extracts.
7.2.2.1. Stevia Blend.
7.2.2.2. Sweet Glycosides (40-50%).
7.2.2.3. Sweet Glycosides (80-95%).
7.2.3. Stevia Leaves.
7.2.3.1. Dried Leaves.
7.2.3.2. Ground Leaves.
7.2.3.3. Fresh Leaves.
7.2.3.4. Tea Cut Leaves.
8. Global Stevia Market- By End Use.
8.1. Confectionery.
8.2. Bakery.
8.3. Snacks.
8.4. Packaged Food.
8.5. Beverage.
8.6. Table Top Sweeteners and Dressing Food.
8.7. Dairy.
8.8. Dietary Supplements.
8.9. Others.
9. Global Stevia Market- By Geography.
9.1. North America.
9.1.1. U.S.
9.1.2. Canada.
9.1.3. Mexico.
9.2. Asia-Pacific.
9.2.1. China.
9.2.2. India.
9.2.3. Japan.
9.2.4. Australia & New Zealand.
9.2.5. Rest of APAC.
9.3. Europe.
9.3.1. France.
9.3.2. Switzerland.
9.3.3. U.K..
9.3.4. Germany
9.3.5. Netherlands.
9.3.6. Sweden.
9.3.7. Rest of Europe.
9.4. Row.
9.4.1. South America.
9.4.2. Middle East.
9.4.3. Africa.
10. Global Stevia Market- Market Entropy.
10.1. New Product Launches.
10.2. M&A’s, Agreements, Parnerships, Expansions
11. Global Stevia Ingredient & Retail Products Market - Company Profiles.
11.1. Company 1
11.2. Company 2
11.3. Company 3
11.4. Company 4
11.5. Company 5
11.6. Company 6
11.7. Company 7
11.8. Company 8
11.9. Company 9
11.10. Company 10
*More than 10 Companies are profiled in this Research Report*
"*Financials would be provided on a best efforts basis for private companies"
12. Appendix
12.1. List of Abbreviations.
12.2. Sources.
12.3. Research Methodology.
12.4. Expert Insights.
12.5. Disclaimer.
List of Tables:
Table1: Stevia Ingredient & Retail Products Market Overview 2023-2030
Table2: Stevia Ingredient & Retail Products Market Leader Analysis 2023-2024 (US$)
Table3: Stevia Ingredient & Retail Products Market Product Analysis 2023-2024 (US$)
Table4: Stevia Ingredient & Retail Products Market End User Analysis 2023-2024 (US$)
Table5: Stevia Ingredient & Retail Products Market Patent Analysis 2021-2023* (US$)
Table6: Stevia Ingredient & Retail Products Market Financial Analysis 2023-2024 (US$)
Table7: Stevia Ingredient & Retail Products Market Driver Analysis 2023-2024 (US$)
Table8: Stevia Ingredient & Retail Products Market Challenges Analysis 2023-2024 (US$)
Table9: Stevia Ingredient & Retail Products Market Constraint Analysis 2023-2024 (US$)
Table10: Stevia Ingredient & Retail Products Market Supplier Bargaining Power Analysis 2023-2024 (US$)
Table11: Stevia Ingredient & Retail Products Market Buyer Bargaining Power Analysis 2023-2024 (US$)
Table12: Stevia Ingredient & Retail Products Market Threat of Substitutes Analysis 2023-2024 (US$)
Table13: Stevia Ingredient & Retail Products Market Threat of New Entrants Analysis 2023-2024 (US$)
Table14: Stevia Ingredient & Retail Products Market Degree of Competition Analysis 2023-2024 (US$)
Table15: Stevia Ingredient & Retail Products Market Value Chain Analysis 2023-2024 (US$)
Table16: Stevia Ingredient & Retail Products Market Pricing Analysis 2023-2030 (US$)
Table17: Stevia Ingredient & Retail Products Market Opportunities Analysis 2023-2030 (US$)
Table18: Stevia Ingredient & Retail Products Market Product Life Cycle Analysis 2023-2030 (US$)
Table19: Stevia Ingredient & Retail Products Market Supplier Analysis 2023-2024 (US$)
Table20: Stevia Ingredient & Retail Products Market Distributor Analysis 2023-2024 (US$)
Table21: Stevia Ingredient & Retail Products Market Trend Analysis 2023-2024 (US$)
Table22: Stevia Ingredient & Retail Products Market Size 2023 (US$)
Table23: Stevia Ingredient & Retail Products Market Forecast Analysis 2023-2030 (US$)
Table24: Stevia Ingredient & Retail Products Market Sales Forecast Analysis 2023-2030 (Units)
Table25: Stevia Ingredient & Retail Products Market Revenue & Volume,By Type, 2023-2030 ($)
Table26: Stevia Ingredient & Retail Products Market By Type, Revenue & Volume,By Key functional/Sweetening ingredient, 2023-2030 ($)
Table27: Stevia Ingredient & Retail Products Market By Type, Revenue & Volume,By Type of Extracts, 2023-2030 ($)
Table28: Stevia Ingredient & Retail Products Market By Type, Revenue & Volume,By Liquid Extracts, 2023-2030 ($)
Table29: Stevia Ingredient & Retail Products Market By Type, Revenue & Volume,By Powder Extracts, 2023-2030 ($)
Table30: Stevia Ingredient & Retail Products Market By Type, Revenue & Volume,By Stevia Leaves, 2023-2030 ($)
Table31: Stevia Ingredient & Retail Products Market Revenue & Volume,By End Use, 2023-2030 ($)
Table32: Stevia Ingredient & Retail Products Market By End Use, Revenue & Volume,By Confectionery, 2023-2030 ($)
Table33: Stevia Ingredient & Retail Products Market By End Use, Revenue & Volume,By Bakery, 2023-2030 ($)
Table34: Stevia Ingredient & Retail Products Market By End Use, Revenue & Volume,By Snacks, 2023-2030 ($)
Table35: Stevia Ingredient & Retail Products Market By End Use, Revenue & Volume,By Packaged Food, 2023-2030 ($)
Table36: Stevia Ingredient & Retail Products Market By End Use, Revenue & Volume,By Beverage, 2023-2030 ($)
Table37: North America Stevia Ingredient & Retail Products Market Revenue & Volume,By Type, 2023-2030 ($)
Table38: North America Stevia Ingredient & Retail Products Market Revenue & Volume,By End Use, 2023-2030 ($)
Table39: South america Stevia Ingredient & Retail Products Market Revenue & Volume,By Type, 2023-2030 ($)
Table40: South america Stevia Ingredient & Retail Products Market Revenue & Volume,By End Use, 2023-2030 ($)
Table41: Europe Stevia Ingredient & Retail Products Market Revenue & Volume,By Type, 2023-2030 ($)
Table42: Europe Stevia Ingredient & Retail Products Market Revenue & Volume,By End Use, 2023-2030 ($)
Table43: APAC Stevia Ingredient & Retail Products Market Revenue & Volume,By Type, 2023-2030 ($)
Table44: APAC Stevia Ingredient & Retail Products Market Revenue & Volume,By End Use, 2023-2030 ($)
Table45: Middle East & Africa Stevia Ingredient & Retail Products Market Revenue & Volume,By Type, 2023-2030 ($)
Table46: Middle East & Africa Stevia Ingredient & Retail Products Market Revenue & Volume,By End Use, 2023-2030 ($)
Table47: Russia Stevia Ingredient & Retail Products Market Revenue & Volume,By Type, 2023-2030 ($)
Table48: Russia Stevia Ingredient & Retail Products Market Revenue & Volume,By End Use, 2023-2030 ($)
Table49: Israel Stevia Ingredient & Retail Products Market Revenue & Volume,By Type, 2023-2030 ($)
Table50: Israel Stevia Ingredient & Retail Products Market Revenue & Volume,By End Use, 2023-2030 ($)
Table51: Top Companies 2023 (US$)Stevia Ingredient & Retail Products Market Revenue & Volume,,
Table52: Product Launch 2023-2024Stevia Ingredient & Retail Products Market Revenue & Volume,,
Table53: Mergers & Acquistions 2023-2024Stevia Ingredient & Retail Products Market Revenue & Volume,,
List of Figures:
Figure 1: Overview of Stevia Ingredient & Retail Products Market 2023-2030
Figure 2: Market Share Analysis for Stevia Ingredient & Retail Products Market 2023 (US$)
Figure 3: Product Comparison in Stevia Ingredient & Retail Products Market 2023-2024 (US$)
Figure 4: End User Profile for Stevia Ingredient & Retail Products Market 2023-2024 (US$)
Figure 5: Patent Application and Grant in Stevia Ingredient & Retail Products Market 2021-2023* (US$)
Figure 6: Top 5 Companies Financial Analysis in Stevia Ingredient & Retail Products Market 2023-2024 (US$)
Figure 7: Market Entry Strategy in Stevia Ingredient & Retail Products Market 2023-2024
Figure 8: Ecosystem Analysis in Stevia Ingredient & Retail Products Market 2023
Figure 9: Average Selling Price in Stevia Ingredient & Retail Products Market 2023-2030
Figure 10: Top Opportunites in Stevia Ingredient & Retail Products Market 2023-2024
Figure 11: Market Life Cycle Analysis in Stevia Ingredient & Retail Products Market
Figure 12: GlobalBy TypeStevia Ingredient & Retail Products Market Revenue, 2023-2030 ($)
Figure 13: GlobalBy End UseStevia Ingredient & Retail Products Market Revenue, 2023-2030 ($)
Figure 14: Global Stevia Ingredient & Retail Products Market - By Geography
Figure 15: Global Stevia Ingredient & Retail Products Market Value & Volume, By Geography, 2023-2030 ($)
Figure 16: Global Stevia Ingredient & Retail Products Market CAGR, By Geography, 2023-2030 (%)
Figure 17: North America Stevia Ingredient & Retail Products Market Value & Volume, 2023-2030 ($)
Figure 18: US Stevia Ingredient & Retail Products Market Value & Volume, 2023-2030 ($)
Figure 19: US GDP and Population, 2023-2024 ($)
Figure 20: US GDP – Composition of 2023, By Sector of Origin
Figure 21: US Export and Import Value & Volume, 2023-2024 ($)
Figure 22: Canada Stevia Ingredient & Retail Products Market Value & Volume, 2023-2030 ($)
Figure 23: Canada GDP and Population, 2023-2024 ($)
Figure 24: Canada GDP – Composition of 2023, By Sector of Origin
Figure 25: Canada Export and Import Value & Volume, 2023-2024 ($)
Figure 26: Mexico Stevia Ingredient & Retail Products Market Value & Volume, 2023-2030 ($)
Figure 27: Mexico GDP and Population, 2023-2024 ($)
Figure 28: Mexico GDP – Composition of 2023, By Sector of Origin
Figure 29: Mexico Export and Import Value & Volume, 2023-2024 ($)
Figure 30: South America Stevia Ingredient & Retail Products Market Value & Volume, 2023-2030 ($)
Figure 31: Brazil Stevia Ingredient & Retail Products Market Value & Volume, 2023-2030 ($)
Figure 32: Brazil GDP and Population, 2023-2024 ($)
Figure 33: Brazil GDP – Composition of 2023, By Sector of Origin
Figure 34: Brazil Export and Import Value & Volume, 2023-2024 ($)
Figure 35: Venezuela Stevia Ingredient & Retail Products Market Value & Volume, 2023-2030 ($)
Figure 36: Venezuela GDP and Population, 2023-2024 ($)
Figure 37: Venezuela GDP – Composition of 2023, By Sector of Origin
Figure 38: Venezuela Export and Import Value & Volume, 2023-2024 ($)
Figure 39: Argentina Stevia Ingredient & Retail Products Market Value & Volume, 2023-2030 ($)
Figure 40: Argentina GDP and Population, 2023-2024 ($)
Figure 41: Argentina GDP – Composition of 2023, By Sector of Origin
Figure 42: Argentina Export and Import Value & Volume, 2023-2024 ($)
Figure 43: Ecuador Stevia Ingredient & Retail Products Market Value & Volume, 2023-2030 ($)
Figure 44: Ecuador GDP and Population, 2023-2024 ($)
Figure 45: Ecuador GDP – Composition of 2023, By Sector of Origin
Figure 46: Ecuador Export and Import Value & Volume, 2023-2024 ($)
Figure 47: Peru Stevia Ingredient & Retail Products Market Value & Volume, 2023-2030 ($)
Figure 48: Peru GDP and Population, 2023-2024 ($)
Figure 49: Peru GDP – Composition of 2023, By Sector of Origin
Figure 50: Peru Export and Import Value & Volume, 2023-2024 ($)
Figure 51: Colombia Stevia Ingredient & Retail Products Market Value & Volume, 2023-2030 ($)
Figure 52: Colombia GDP and Population, 2023-2024 ($)
Figure 53: Colombia GDP – Composition of 2023, By Sector of Origin
Figure 54: Colombia Export and Import Value & Volume, 2023-2024 ($)
Figure 55: Costa Rica Stevia Ingredient & Retail Products Market Value & Volume, 2023-2030 ($)
Figure 56: Costa Rica GDP and Population, 2023-2024 ($)
Figure 57: Costa Rica GDP – Composition of 2023, By Sector of Origin
Figure 58: Costa Rica Export and Import Value & Volume, 2023-2024 ($)
Figure 59: Europe Stevia Ingredient & Retail Products Market Value & Volume, 2023-2030 ($)
Figure 60: U.K Stevia Ingredient & Retail Products Market Value & Volume, 2023-2030 ($)
Figure 61: U.K GDP and Population, 2023-2024 ($)
Figure 62: U.K GDP – Composition of 2023, By Sector of Origin
Figure 63: U.K Export and Import Value & Volume, 2023-2024 ($)
Figure 64: Germany Stevia Ingredient & Retail Products Market Value & Volume, 2023-2030 ($)
Figure 65: Germany GDP and Population, 2023-2024 ($)
Figure 66: Germany GDP – Composition of 2023, By Sector of Origin
Figure 67: Germany Export and Import Value & Volume, 2023-2024 ($)
Figure 68: Italy Stevia Ingredient & Retail Products Market Value & Volume, 2023-2030 ($)
Figure 69: Italy GDP and Population, 2023-2024 ($)
Figure 70: Italy GDP – Composition of 2023, By Sector of Origin
Figure 71: Italy Export and Import Value & Volume, 2023-2024 ($)
Figure 72: France Stevia Ingredient & Retail Products Market Value & Volume, 2023-2030 ($)
Figure 73: France GDP and Population, 2023-2024 ($)
Figure 74: France GDP – Composition of 2023, By Sector of Origin
Figure 75: France Export and Import Value & Volume, 2023-2024 ($)
Figure 76: Netherlands Stevia Ingredient & Retail Products Market Value & Volume, 2023-2030 ($)
Figure 77: Netherlands GDP and Population, 2023-2024 ($)
Figure 78: Netherlands GDP – Composition of 2023, By Sector of Origin
Figure 79: Netherlands Export and Import Value & Volume, 2023-2024 ($)
Figure 80: Belgium Stevia Ingredient & Retail Products Market Value & Volume, 2023-2030 ($)
Figure 81: Belgium GDP and Population, 2023-2024 ($)
Figure 82: Belgium GDP – Composition of 2023, By Sector of Origin
Figure 83: Belgium Export and Import Value & Volume, 2023-2024 ($)
Figure 84: Spain Stevia Ingredient & Retail Products Market Value & Volume, 2023-2030 ($)
Figure 85: Spain GDP and Population, 2023-2024 ($)
Figure 86: Spain GDP – Composition of 2023, By Sector of Origin
Figure 87: Spain Export and Import Value & Volume, 2023-2024 ($)
Figure 88: Denmark Stevia Ingredient & Retail Products Market Value & Volume, 2023-2030 ($)
Figure 89: Denmark GDP and Population, 2023-2024 ($)
Figure 90: Denmark GDP – Composition of 2023, By Sector of Origin
Figure 91: Denmark Export and Import Value & Volume, 2023-2024 ($)
Figure 92: APAC Stevia Ingredient & Retail Products Market Value & Volume, 2023-2030 ($)
Figure 93: China Stevia Ingredient & Retail Products Market Value & Volume, 2023-2030
Figure 94: China GDP and Population, 2023-2024 ($)
Figure 95: China GDP – Composition of 2023, By Sector of Origin
Figure 96: China Export and Import Value & Volume, 2023-2024 ($)Stevia Ingredient & Retail Products Market China Export and Import Value & Volume, 2023-2024 ($)
Figure 97: Australia Stevia Ingredient & Retail Products Market Value & Volume, 2023-2030 ($)
Figure 98: Australia GDP and Population, 2023-2024 ($)
Figure 99: Australia GDP – Composition of 2023, By Sector of Origin
Figure 100: Australia Export and Import Value & Volume, 2023-2024 ($)
Figure 101: South Korea Stevia Ingredient & Retail Products Market Value & Volume, 2023-2030 ($)
Figure 102: South Korea GDP and Population, 2023-2024 ($)
Figure 103: South Korea GDP – Composition of 2023, By Sector of Origin
Figure 104: South Korea Export and Import Value & Volume, 2023-2024 ($)
Figure 105: India Stevia Ingredient & Retail Products Market Value & Volume, 2023-2030 ($)
Figure 106: India GDP and Population, 2023-2024 ($)
Figure 107: India GDP – Composition of 2023, By Sector of Origin
Figure 108: India Export and Import Value & Volume, 2023-2024 ($)
Figure 109: Taiwan Stevia Ingredient & Retail Products Market Value & Volume, 2023-2030 ($)
Figure 110: Taiwan GDP and Population, 2023-2024 ($)
Figure 111: Taiwan GDP – Composition of 2023, By Sector of Origin
Figure 112: Taiwan Export and Import Value & Volume, 2023-2024 ($)
Figure 113: Malaysia Stevia Ingredient & Retail Products Market Value & Volume, 2023-2030 ($)
Figure 114: Malaysia GDP and Population, 2023-2024 ($)
Figure 115: Malaysia GDP – Composition of 2023, By Sector of Origin
Figure 116: Malaysia Export and Import Value & Volume, 2023-2024 ($)
Figure 117: Hong Kong Stevia Ingredient & Retail Products Market Value & Volume, 2023-2030 ($)
Figure 118: Hong Kong GDP and Population, 2023-2024 ($)
Figure 119: Hong Kong GDP – Composition of 2023, By Sector of Origin
Figure 120: Hong Kong Export and Import Value & Volume, 2023-2024 ($)
Figure 121: Middle East & Africa Stevia Ingredient & Retail Products Market Middle East & Africa 3D Printing Market Value & Volume, 2023-2030 ($)
Figure 122: Russia Stevia Ingredient & Retail Products Market Value & Volume, 2023-2030 ($)
Figure 123: Russia GDP and Population, 2023-2024 ($)
Figure 124: Russia GDP – Composition of 2023, By Sector of Origin
Figure 125: Russia Export and Import Value & Volume, 2023-2024 ($)
Figure 126: Israel Stevia Ingredient & Retail Products Market Value & Volume, 2023-2030 ($)
Figure 127: Israel GDP and Population, 2023-2024 ($)
Figure 128: Israel GDP – Composition of 2023, By Sector of Origin
Figure 129: Israel Export and Import Value & Volume, 2023-2024 ($)
Figure 130: Entropy Share, By Strategies, 2023-2024* (%)Stevia Ingredient & Retail Products Market
Figure 131: Developments, 2023-2024*Stevia Ingredient & Retail Products Market
Figure 132: Company 1 Stevia Ingredient & Retail Products Market Net Revenue, By Years, 2023-2024* ($)
Figure 133: Company 1 Stevia Ingredient & Retail Products Market Net Revenue Share, By Business segments, 2023 (%)
Figure 134: Company 1 Stevia Ingredient & Retail Products Market Net Sales Share, By Geography, 2023 (%)
Figure 135: Company 2 Stevia Ingredient & Retail Products Market Net Revenue, By Years, 2023-2024* ($)
Figure 136: Company 2 Stevia Ingredient & Retail Products Market Net Revenue Share, By Business segments, 2023 (%)
Figure 137: Company 2 Stevia Ingredient & Retail Products Market Net Sales Share, By Geography, 2023 (%)
Figure 138: Company 3Stevia Ingredient & Retail Products Market Net Revenue, By Years, 2023-2024* ($)
Figure 139: Company 3Stevia Ingredient & Retail Products Market Net Revenue Share, By Business segments, 2023 (%)
Figure 140: Company 3Stevia Ingredient & Retail Products Market Net Sales Share, By Geography, 2023 (%)
Figure 141: Company 4 Stevia Ingredient & Retail Products Market Net Revenue, By Years, 2023-2024* ($)
Figure 142: Company 4 Stevia Ingredient & Retail Products Market Net Revenue Share, By Business segments, 2023 (%)
Figure 143: Company 4 Stevia Ingredient & Retail Products Market Net Sales Share, By Geography, 2023 (%)
Figure 144: Company 5 Stevia Ingredient & Retail Products Market Net Revenue, By Years, 2023-2024* ($)
Figure 145: Company 5 Stevia Ingredient & Retail Products Market Net Revenue Share, By Business segments, 2023 (%)
Figure 146: Company 5 Stevia Ingredient & Retail Products Market Net Sales Share, By Geography, 2023 (%)
Figure 147: Company 6 Stevia Ingredient & Retail Products Market Net Revenue, By Years, 2023-2024* ($)
Figure 148: Company 6 Stevia Ingredient & Retail Products Market Net Revenue Share, By Business segments, 2023 (%)
Figure 149: Company 6 Stevia Ingredient & Retail Products Market Net Sales Share, By Geography, 2023 (%)
Figure 150: Company 7 Stevia Ingredient & Retail Products Market Net Revenue, By Years, 2023-2024* ($)
Figure 151: Company 7 Stevia Ingredient & Retail Products Market Net Revenue Share, By Business segments, 2023 (%)
Figure 152: Company 7 Stevia Ingredient & Retail Products Market Net Sales Share, By Geography, 2023 (%)
Figure 153: Company 8 Stevia Ingredient & Retail Products Market Net Revenue, By Years, 2023-2024* ($)
Figure 154: Company 8 Stevia Ingredient & Retail Products Market Net Revenue Share, By Business segments, 2023 (%)
Figure 155: Company 8 Stevia Ingredient & Retail Products Market Net Sales Share, By Geography, 2023 (%)
Figure 156: Company 9 Stevia Ingredient & Retail Products Market Net Revenue, By Years, 2023-2024* ($)
Figure 157: Company 9 Stevia Ingredient & Retail Products Market Net Revenue Share, By Business segments, 2023 (%)
Figure 158: Company 9 Stevia Ingredient & Retail Products Market Net Sales Share, By Geography, 2023 (%)
Figure 159: Company 10 Stevia Ingredient & Retail Products Market Net Revenue, By Years, 2023-2024* ($)
Figure 160: Company 10 Stevia Ingredient & Retail Products Market Net Revenue Share, By Business segments, 2023 (%)
Figure 161: Company 10 Stevia Ingredient & Retail Products Market Net Sales Share, By Geography, 2023 (%)
Figure 162: Company 11 Stevia Ingredient & Retail Products Market Net Revenue, By Years, 2023-2024* ($)
Figure 163: Company 11 Stevia Ingredient & Retail Products Market Net Revenue Share, By Business segments, 2023 (%)
Figure 164: Company 11 Stevia Ingredient & Retail Products Market Net Sales Share, By Geography, 2023 (%)
Figure 165: Company 12 Stevia Ingredient & Retail Products Market Net Revenue, By Years, 2023-2024* ($)
Figure 166: Company 12 Stevia Ingredient & Retail Products Market Net Revenue Share, By Business segments, 2023 (%)
Figure 167: Company 12 Stevia Ingredient & Retail Products Market Net Sales Share, By Geography, 2023 (%)
Figure 168: Company 13Stevia Ingredient & Retail Products Market Net Revenue, By Years, 2023-2024* ($)
Figure 169: Company 13Stevia Ingredient & Retail Products Market Net Revenue Share, By Business segments, 2023 (%)
Figure 170: Company 13Stevia Ingredient & Retail Products Market Net Sales Share, By Geography, 2023 (%)
Figure 171: Company 14 Stevia Ingredient & Retail Products Market Net Revenue, By Years, 2023-2024* ($)
Figure 172: Company 14 Stevia Ingredient & Retail Products Market Net Revenue Share, By Business segments, 2023 (%)
Figure 173: Company 14 Stevia Ingredient & Retail Products Market Net Sales Share, By Geography, 2023 (%)
Figure 174: Company 15 Stevia Ingredient & Retail Products Market Net Revenue, By Years, 2023-2024* ($)
Figure 175: Company 15 Stevia Ingredient & Retail Products Market Net Revenue Share, By Business segments, 2023 (%)
Figure 176: Company 15 Stevia Ingredient & Retail Products Market Net Sales Share, By Geography, 2023 (%)