 Email
Email Print
Print


Building Insulation Materials Market - Forecast(2025 - 2031)
Building Insulation Materials Market Overview
COVID-19 Impact
Building Insulation Materials Market Report Coverage
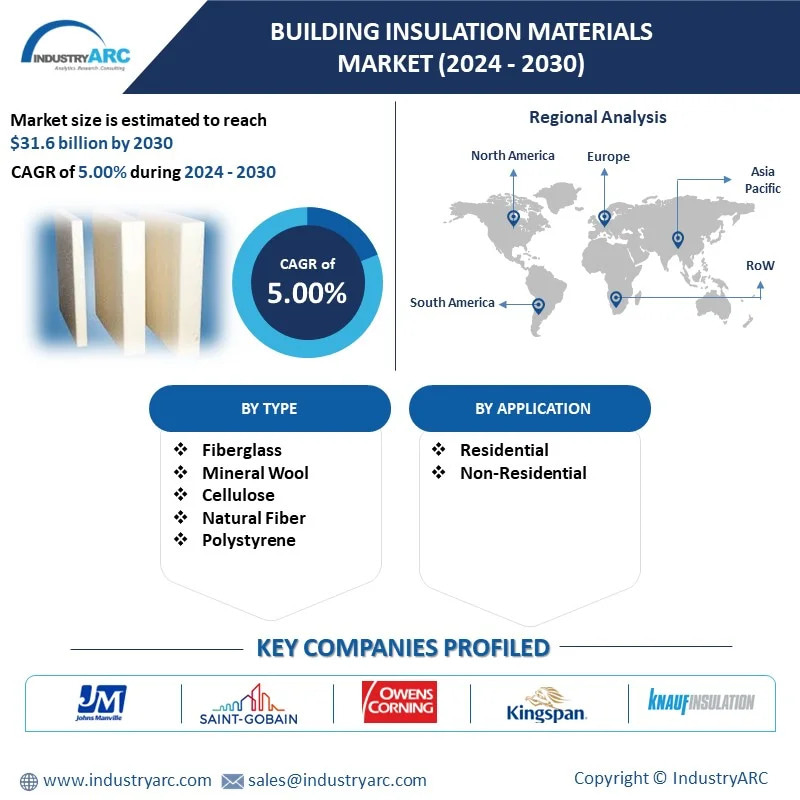
Key Takeaways

For More Details on This Report - Request for Sample
Building Insulation Market Segment Analysis – By Type
Building Insulation Materials Market Segment Analysis – By Application
Building Insulation Materials Market Segment Analysis – By Geography
Building Insulation Materials Market – Drivers
Rise in Population and Urbanization globally:
Conservation Of Energy:
Building Insulation Materials Market – Challenges
High Initial Investment Cost:
Building Insulation Materials Market Landscape
- Berkshire Hathaway (Johns Manville Corporation)
- Saint-Gobain S.A.
- BASF SE
- Kingspan Group plc
- Knauf Insulation, Inc.
- Owens Corning
- Huntsman Corporation
- Rockwool International A/S
- Holcim Group (Firestone Building Products Company)
- Cabot Corporation
Acquisitions/Technology Launches/Product Launches
List of Tables
Table 1: Building Insulation Materials Market Overview 2023-2030
Table 2: Building Insulation Materials Market Leader Analysis 2023-2024 (US$)
Table 3: Building Insulation Materials Market Product Analysis 2023-2024 (US$)
Table 4: Building Insulation Materials Market End User Analysis 2023-2024 (US$)
Table 5: Building Insulation Materials Market Patent Analysis 2021-2023* (US$)
Table 6: Building Insulation Materials Market Financial Analysis 2023-2024 (US$)
Table 7: Building Insulation Materials Market Driver Analysis 2023-2024 (US$)
Table 8: Building Insulation Materials Market Challenges Analysis 2023-2024 (US$)
Table 9: Building Insulation Materials Market Constraint Analysis 2023-2024 (US$)
Table 10: Building Insulation Materials Market Supplier Bargaining Power Analysis 2023-2024 (US$)
Table 11: Building Insulation Materials Market Buyer Bargaining Power Analysis 2023-2024 (US$)
Table 12: Building Insulation Materials Market Threat of Substitutes Analysis 2023-2024 (US$)
Table 13: Building Insulation Materials Market Threat of New Entrants Analysis 2023-2024 (US$)
Table 14: Building Insulation Materials Market Degree of Competition Analysis 2023-2024 (US$)
Table 15: Building Insulation Materials Market Value Chain Analysis 2023-2024 (US$)
Table 16: Building Insulation Materials Market Pricing Analysis 2023-2030 (US$)
Table 17: Building Insulation Materials Market Opportunities Analysis 2023-2030 (US$)
Table 18: Building Insulation Materials Market Product Life Cycle Analysis 2023-2030 (US$)
Table 19: Building Insulation Materials Market Supplier Analysis 2023-2024 (US$)
Table 20: Building Insulation Materials Market Distributor Analysis 2023-2024 (US$)
Table 21: Building Insulation Materials Market Trend Analysis 2023-2024 (US$)
Table 22: Building Insulation Materials Market Size 2023 (US$)
Table 23: Building Insulation Materials Market Forecast Analysis 2023-2030 (US$)
Table 24: Building Insulation Materials Market Sales Forecast Analysis 2023-2030 (Units)
Table 25: Building Insulation Materials Market, Revenue & Volume, By Type, 2023-2030 ($)
Table 26: Building Insulation Materials Market By Type, Revenue & Volume, By Wool insulation, 2023-2030 ($)
Table 27: Building Insulation Materials Market By Type, Revenue & Volume, By Plastic Insulation, 2023-2030 ($)
Table 28: Building Insulation Materials Market By Type, Revenue & Volume, By Expanded polystyrene (EPS), 2023-2030 ($)
Table 29: Building Insulation Materials Market By Type, Revenue & Volume, By Extruded polystyrene (XPS), 2023-2030 ($)
Table 30: Building Insulation Materials Market By Type, Revenue & Volume, By Polyurethane, 2023-2030 ($)
Table 31: Building Insulation Materials Market, Revenue & Volume, By Application, 2023-2030 ($)
Table 32: Building Insulation Materials Market By Application, Revenue & Volume, By Roofs, 2023-2030 ($)
Table 33: Building Insulation Materials Market By Application, Revenue & Volume, By Walls, 2023-2030 ($)
Table 34: Building Insulation Materials Market By Application, Revenue & Volume, By Floors, 2023-2030 ($)
Table 35: Building Insulation Materials Market, Revenue & Volume, By End User Industry, 2023-2030 ($)
Table 36: Building Insulation Materials Market By End User Industry, Revenue & Volume, By Residential Buildings, 2023-2030 ($)
Table 37: Building Insulation Materials Market By End User Industry, Revenue & Volume, By Non-Residential Buildings, 2023-2030 ($)
Table 38: Building Insulation Materials Market By End User Industry, Revenue & Volume, By Infrastructure, 2023-2030 ($)
Table 39: North America Building Insulation Materials Market, Revenue & Volume, By Type, 2023-2030 ($)
Table 40: North America Building Insulation Materials Market, Revenue & Volume, By Application, 2023-2030 ($)
Table 41: North America Building Insulation Materials Market, Revenue & Volume, By End User Industry, 2023-2030 ($)
Table 42: South america Building Insulation Materials Market, Revenue & Volume, By Type, 2023-2030 ($)
Table 43: South america Building Insulation Materials Market, Revenue & Volume, By Application, 2023-2030 ($)
Table 44: South america Building Insulation Materials Market, Revenue & Volume, By End User Industry, 2023-2030 ($)
Table 45: Europe Building Insulation Materials Market, Revenue & Volume, By Type, 2023-2030 ($)
Table 46: Europe Building Insulation Materials Market, Revenue & Volume, By Application, 2023-2030 ($)
Table 47: Europe Building Insulation Materials Market, Revenue & Volume, By End User Industry, 2023-2030 ($)
Table 48: APAC Building Insulation Materials Market, Revenue & Volume, By Type, 2023-2030 ($)
Table 49: APAC Building Insulation Materials Market, Revenue & Volume, By Application, 2023-2030 ($)
Table 50: APAC Building Insulation Materials Market, Revenue & Volume, By End User Industry, 2023-2030 ($)
Table 51: Middle East & Africa Building Insulation Materials Market, Revenue & Volume, By Type, 2023-2030 ($)
Table 52: Middle East & Africa Building Insulation Materials Market, Revenue & Volume, By Application, 2023-2030 ($)
Table 53: Middle East & Africa Building Insulation Materials Market, Revenue & Volume, By End User Industry, 2023-2030 ($)
Table 54: Russia Building Insulation Materials Market, Revenue & Volume, By Type, 2023-2030 ($)
Table 55: Russia Building Insulation Materials Market, Revenue & Volume, By Application, 2023-2030 ($)
Table 56: Russia Building Insulation Materials Market, Revenue & Volume, By End User Industry, 2023-2030 ($)
Table 57: Israel Building Insulation Materials Market, Revenue & Volume, By Type, 2023-2030 ($)
Table 58: Israel Building Insulation Materials Market, Revenue & Volume, By Application, 2023-2030 ($)
Table 59: Israel Building Insulation Materials Market, Revenue & Volume, By End User Industry, 2023-2030 ($)
Table 60: Top Companies 2023 (US$)Building Insulation Materials Market, Revenue & Volume
Table 61: Product Launch 2023-2024Building Insulation Materials Market, Revenue & Volume
Table 62: Mergers & Acquistions 2023-2024Building Insulation Materials Market, Revenue & Volume
List of Figures
Figure 1: Overview of Building Insulation Materials Market 2023-2030
Figure 2: Market Share Analysis for Building Insulation Materials Market 2023 (US$)
Figure 3: Product Comparison in Building Insulation Materials Market 2023-2024 (US$)
Figure 4: End User Profile for Building Insulation Materials Market 2023-2024 (US$)
Figure 5: Patent Application and Grant in Building Insulation Materials Market 2021-2023* (US$)
Figure 6: Top 5 Companies Financial Analysis in Building Insulation Materials Market 2023-2024 (US$)
Figure 7: Market Entry Strategy in Building Insulation Materials Market 2023-2024
Figure 8: Ecosystem Analysis in Building Insulation Materials Market 2023
Figure 9: Average Selling Price in Building Insulation Materials Market 2023-2030
Figure 10: Top Opportunites in Building Insulation Materials Market 2023-2024
Figure 11: Market Life Cycle Analysis in Building Insulation Materials Market
Figure 12: GlobalBy TypeBuilding Insulation Materials Market Revenue, 2023-2030 ($)
Figure 13: GlobalBy ApplicationBuilding Insulation Materials Market Revenue, 2023-2030 ($)
Figure 14: GlobalBy End User IndustryBuilding Insulation Materials Market Revenue, 2023-2030 ($)
Figure 15: Global Building Insulation Materials Market - By Geography
Figure 16: Global Building Insulation Materials Market Value & Volume, By Geography, 2023-2030 ($)
Figure 17: Global Building Insulation Materials Market CAGR, By Geography, 2023-2030 (%)
Figure 18: North America Building Insulation Materials Market Value & Volume, 2023-2030 ($)
Figure 19: US Building Insulation Materials Market Value & Volume, 2023-2030 ($)
Figure 20: US GDP and Population, 2023-2024 ($)
Figure 21: US GDP – Composition of 2023, By Sector of Origin
Figure 22: US Export and Import Value & Volume, 2023-2024 ($)
Figure 23: Canada Building Insulation Materials Market Value & Volume, 2023-2030 ($)
Figure 24: Canada GDP and Population, 2023-2024 ($)
Figure 25: Canada GDP – Composition of 2023, By Sector of Origin
Figure 26: Canada Export and Import Value & Volume, 2023-2024 ($)
Figure 27: Mexico Building Insulation Materials Market Value & Volume, 2023-2030 ($)
Figure 28: Mexico GDP and Population, 2023-2024 ($)
Figure 29: Mexico GDP – Composition of 2023, By Sector of Origin
Figure 30: Mexico Export and Import Value & Volume, 2023-2024 ($)
Figure 31: South America Building Insulation Materials Market Value & Volume, 2023-2030 ($)
Figure 32: Brazil Building Insulation Materials Market Value & Volume, 2023-2030 ($)
Figure 33: Brazil GDP and Population, 2023-2024 ($)
Figure 34: Brazil GDP – Composition of 2023, By Sector of Origin
Figure 35: Brazil Export and Import Value & Volume, 2023-2024 ($)
Figure 36: Venezuela Building Insulation Materials Market Value & Volume, 2023-2030 ($)
Figure 37: Venezuela GDP and Population, 2023-2024 ($)
Figure 38: Venezuela GDP – Composition of 2023, By Sector of Origin
Figure 39: Venezuela Export and Import Value & Volume, 2023-2024 ($)
Figure 40: Argentina Building Insulation Materials Market Value & Volume, 2023-2030 ($)
Figure 41: Argentina GDP and Population, 2023-2024 ($)
Figure 42: Argentina GDP – Composition of 2023, By Sector of Origin
Figure 43: Argentina Export and Import Value & Volume, 2023-2024 ($)
Figure 44: Ecuador Building Insulation Materials Market Value & Volume, 2023-2030 ($)
Figure 45: Ecuador GDP and Population, 2023-2024 ($)
Figure 46: Ecuador GDP – Composition of 2023, By Sector of Origin
Figure 47: Ecuador Export and Import Value & Volume, 2023-2024 ($)
Figure 48: Peru Building Insulation Materials Market Value & Volume, 2023-2030 ($)
Figure 49: Peru GDP and Population, 2023-2024 ($)
Figure 50: Peru GDP – Composition of 2023, By Sector of Origin
Figure 51: Peru Export and Import Value & Volume, 2023-2024 ($)
Figure 52: Colombia Building Insulation Materials Market Value & Volume, 2023-2030 ($)
Figure 53: Colombia GDP and Population, 2023-2024 ($)
Figure 54: Colombia GDP – Composition of 2023, By Sector of Origin
Figure 55: Colombia Export and Import Value & Volume, 2023-2024 ($)
Figure 56: Costa Rica Building Insulation Materials Market Value & Volume, 2023-2030 ($)
Figure 57: Costa Rica GDP and Population, 2023-2024 ($)
Figure 58: Costa Rica GDP – Composition of 2023, By Sector of Origin
Figure 59: Costa Rica Export and Import Value & Volume, 2023-2024 ($)
Figure 60: Europe Building Insulation Materials Market Value & Volume, 2023-2030 ($)
Figure 61: U.K Building Insulation Materials Market Value & Volume, 2023-2030 ($)
Figure 62: U.K GDP and Population, 2023-2024 ($)
Figure 63: U.K GDP – Composition of 2023, By Sector of Origin
Figure 64: U.K Export and Import Value & Volume, 2023-2024 ($)
Figure 65: Germany Building Insulation Materials Market Value & Volume, 2023-2030 ($)
Figure 66: Germany GDP and Population, 2023-2024 ($)
Figure 67: Germany GDP – Composition of 2023, By Sector of Origin
Figure 68: Germany Export and Import Value & Volume, 2023-2024 ($)
Figure 69: Italy Building Insulation Materials Market Value & Volume, 2023-2030 ($)
Figure 70: Italy GDP and Population, 2023-2024 ($)
Figure 71: Italy GDP – Composition of 2023, By Sector of Origin
Figure 72: Italy Export and Import Value & Volume, 2023-2024 ($)
Figure 73: France Building Insulation Materials Market Value & Volume, 2023-2030 ($)
Figure 74: France GDP and Population, 2023-2024 ($)
Figure 75: France GDP – Composition of 2023, By Sector of Origin
Figure 76: France Export and Import Value & Volume, 2023-2024 ($)
Figure 77: Netherlands Building Insulation Materials Market Value & Volume, 2023-2030 ($)
Figure 78: Netherlands GDP and Population, 2023-2024 ($)
Figure 79: Netherlands GDP – Composition of 2023, By Sector of Origin
Figure 80: Netherlands Export and Import Value & Volume, 2023-2024 ($)
Figure 81: Belgium Building Insulation Materials Market Value & Volume, 2023-2030 ($)
Figure 82: Belgium GDP and Population, 2023-2024 ($)
Figure 83: Belgium GDP – Composition of 2023, By Sector of Origin
Figure 84: Belgium Export and Import Value & Volume, 2023-2024 ($)
Figure 85: Spain Building Insulation Materials Market Value & Volume, 2023-2030 ($)
Figure 86: Spain GDP and Population, 2023-2024 ($)
Figure 87: Spain GDP – Composition of 2023, By Sector of Origin
Figure 88: Spain Export and Import Value & Volume, 2023-2024 ($)
Figure 89: Denmark Building Insulation Materials Market Value & Volume, 2023-2030 ($)
Figure 90: Denmark GDP and Population, 2023-2024 ($)
Figure 91: Denmark GDP – Composition of 2023, By Sector of Origin
Figure 92: Denmark Export and Import Value & Volume, 2023-2024 ($)
Figure 93: APAC Building Insulation Materials Market Value & Volume, 2023-2030 ($)
Figure 94: China Building Insulation Materials Market Value & Volume, 2023-2030
Figure 95: China GDP and Population, 2023-2024 ($)
Figure 96: China GDP – Composition of 2023, By Sector of Origin
Figure 97: China Export and Import Value & Volume, 2023-2024 ($)Building Insulation Materials Market China Export and Import Value & Volume, 2023-2024 ($)
Figure 98: Australia Building Insulation Materials Market Value & Volume, 2023-2030 ($)
Figure 99: Australia GDP and Population, 2023-2024 ($)
Figure 100: Australia GDP – Composition of 2023, By Sector of Origin
Figure 101: Australia Export and Import Value & Volume, 2023-2024 ($)
Figure 102: South Korea Building Insulation Materials Market Value & Volume, 2023-2030 ($)
Figure 103: South Korea GDP and Population, 2023-2024 ($)
Figure 104: South Korea GDP – Composition of 2023, By Sector of Origin
Figure 105: South Korea Export and Import Value & Volume, 2023-2024 ($)
Figure 106: India Building Insulation Materials Market Value & Volume, 2023-2030 ($)
Figure 107: India GDP and Population, 2023-2024 ($)
Figure 108: India GDP – Composition of 2023, By Sector of Origin
Figure 109: India Export and Import Value & Volume, 2023-2024 ($)
Figure 110: Taiwan Building Insulation Materials Market Value & Volume, 2023-2030 ($)
Figure 111: Taiwan GDP and Population, 2023-2024 ($)
Figure 112: Taiwan GDP – Composition of 2023, By Sector of Origin
Figure 113: Taiwan Export and Import Value & Volume, 2023-2024 ($)
Figure 114: Malaysia Building Insulation Materials Market Value & Volume, 2023-2030 ($)
Figure 115: Malaysia GDP and Population, 2023-2024 ($)
Figure 116: Malaysia GDP – Composition of 2023, By Sector of Origin
Figure 117: Malaysia Export and Import Value & Volume, 2023-2024 ($)
Figure 118: Hong Kong Building Insulation Materials Market Value & Volume, 2023-2030 ($)
Figure 119: Hong Kong GDP and Population, 2023-2024 ($)
Figure 120: Hong Kong GDP – Composition of 2023, By Sector of Origin
Figure 121: Hong Kong Export and Import Value & Volume, 2023-2024 ($)
Figure 122: Middle East & Africa Building Insulation Materials Market Middle East & Africa 3D Printing Market Value & Volume, 2023-2030 ($)
Figure 123: Russia Building Insulation Materials Market Value & Volume, 2023-2030 ($)
Figure 124: Russia GDP and Population, 2023-2024 ($)
Figure 125: Russia GDP – Composition of 2023, By Sector of Origin
Figure 126: Russia Export and Import Value & Volume, 2023-2024 ($)
Figure 127: Israel Building Insulation Materials Market Value & Volume, 2023-2030 ($)
Figure 128: Israel GDP and Population, 2023-2024 ($)
Figure 129: Israel GDP – Composition of 2023, By Sector of Origin
Figure 130: Israel Export and Import Value & Volume, 2023-2024 ($)
Figure 131: Entropy Share, By Strategies, 2023-2024* (%)Building Insulation Materials Market
Figure 132: Developments, 2023-2024*Building Insulation Materials Market
Figure 133: Company 1 Building Insulation Materials Market Net Revenue, By Years, 2023-2024* ($)
Figure 134: Company 1 Building Insulation Materials Market Net Revenue Share, By Business segments, 2023 (%)
Figure 135: Company 1 Building Insulation Materials Market Net Sales Share, By Geography, 2023 (%)
Figure 136: Company 2 Building Insulation Materials Market Net Revenue, By Years, 2023-2024* ($)
Figure 137: Company 2 Building Insulation Materials Market Net Revenue Share, By Business segments, 2023 (%)
Figure 138: Company 2 Building Insulation Materials Market Net Sales Share, By Geography, 2023 (%)
Figure 139: Company 3 Building Insulation Materials Market Net Revenue, By Years, 2023-2024* ($)
Figure 140: Company 3 Building Insulation Materials Market Net Revenue Share, By Business segments, 2023 (%)
Figure 141: Company 3 Building Insulation Materials Market Net Sales Share, By Geography, 2023 (%)
Figure 142: Company 4 Building Insulation Materials Market Net Revenue, By Years, 2023-2024* ($)
Figure 143: Company 4 Building Insulation Materials Market Net Revenue Share, By Business segments, 2023 (%)
Figure 144: Company 4 Building Insulation Materials Market Net Sales Share, By Geography, 2023 (%)
Figure 145: Company 5 Building Insulation Materials Market Net Revenue, By Years, 2023-2024* ($)
Figure 146: Company 5 Building Insulation Materials Market Net Revenue Share, By Business segments, 2023 (%)
Figure 147: Company 5 Building Insulation Materials Market Net Sales Share, By Geography, 2023 (%)
Figure 148: Company 6 Building Insulation Materials Market Net Revenue, By Years, 2023-2024* ($)
Figure 149: Company 6 Building Insulation Materials Market Net Revenue Share, By Business segments, 2023 (%)
Figure 150: Company 6 Building Insulation Materials Market Net Sales Share, By Geography, 2023 (%)
Figure 151: Company 7 Building Insulation Materials Market Net Revenue, By Years, 2023-2024* ($)
Figure 152: Company 7 Building Insulation Materials Market Net Revenue Share, By Business segments, 2023 (%)
Figure 153: Company 7 Building Insulation Materials Market Net Sales Share, By Geography, 2023 (%)
Figure 154: Company 8 Building Insulation Materials Market Net Revenue, By Years, 2023-2024* ($)
Figure 155: Company 8 Building Insulation Materials Market Net Revenue Share, By Business segments, 2023 (%)
Figure 156: Company 8 Building Insulation Materials Market Net Sales Share, By Geography, 2023 (%)
Figure 157: Company 9 Building Insulation Materials Market Net Revenue, By Years, 2023-2024* ($)
Figure 158: Company 9 Building Insulation Materials Market Net Revenue Share, By Business segments, 2023 (%)
Figure 159: Company 9 Building Insulation Materials Market Net Sales Share, By Geography, 2023 (%)
Figure 160: Company 10 Building Insulation Materials Market Net Revenue, By Years, 2023-2024* ($)
Figure 161: Company 10 Building Insulation Materials Market Net Revenue Share, By Business segments, 2023 (%)
Figure 162: Company 10 Building Insulation Materials Market Net Sales Share, By Geography, 2023 (%)
Figure 163: Company 11 Building Insulation Materials Market Net Revenue, By Years, 2023-2024* ($)
Figure 164: Company 11 Building Insulation Materials Market Net Revenue Share, By Business segments, 2023 (%)
Figure 165: Company 11 Building Insulation Materials Market Net Sales Share, By Geography, 2023 (%)
Figure 166: Company 12 Building Insulation Materials Market Net Revenue, By Years, 2023-2024* ($)
Figure 167: Company 12 Building Insulation Materials Market Net Revenue Share, By Business segments, 2023 (%)
Figure 168: Company 12 Building Insulation Materials Market Net Sales Share, By Geography, 2023 (%)
Figure 169: Company 13 Building Insulation Materials Market Net Revenue, By Years, 2023-2024* ($)
Figure 170: Company 13 Building Insulation Materials Market Net Revenue Share, By Business segments, 2023 (%)
Figure 171: Company 13 Building Insulation Materials Market Net Sales Share, By Geography, 2023 (%)
Figure 172: Company 14 Building Insulation Materials Market Net Revenue, By Years, 2023-2024* ($)
Figure 173: Company 14 Building Insulation Materials Market Net Revenue Share, By Business segments, 2023 (%)
Figure 174: Company 14 Building Insulation Materials Market Net Sales Share, By Geography, 2023 (%)
Figure 175: Company 15 Building Insulation Materials Market Net Revenue, By Years, 2023-2024* ($)
Figure 176: Company 15 Building Insulation Materials Market Net Revenue Share, By Business segments, 2023 (%)
Figure 177: Company 15 Building Insulation Materials Market Net Sales Share, By Geography, 2023 (%)