 Email
Email Print
Print


Polycarbonate Resin Market - By Viscosity (Low, Medium, High), By Application (Packaging, Household Products, Automotive, Construction, Paint, Medicine, Electrical Products, Optical Products, IT & Communication), Geographic Analysis - Forecast (2024 - 2030)
- The resins may continue to grow in other industries such as electronics, optical, construction, where the durability factor comes into play. Polycarbonate resins have low-scratch resistance and hence, additives are mixed in production to create stronger variants.
- In the electronics industry, more mobile phones and tablets are using polycarbonate variants as it reduces weight when compared to regular plastic.
- Polycarbonates are popular in eyewear as they are lightweight and possess a natural ultra violet filter.
- Evaluate market potential through analyzing growth rates (CAGR %), Volume (Units) and Value ($M) data given at country level – for product types, end use applications and by different industry verticals.
- Understand the different dynamics influencing the market – key driving factors, challenges and hidden opportunities.
- Get in-depth insights on your competitor performance – market shares, strategies, financial benchmarking, product benchmarking, SWOT and more.
- Analyze the sales and distribution channels across key geographies to improve top-line revenues.
- Understand the industry supply chain with a deep-dive on the value augmentation at each step, in order to optimize value and bring efficiencies in your processes.
- Get a quick outlook on the market entropy – M&A’s, deals, partnerships, product launches of all key players for the past 4 years.
- Evaluate the supply-demand gaps, import-export statistics and regulatory landscape for more than top 20 countries globally for the market.
Key Market Players:
The Top 5 companies in thePolycarbonate Resin Market are:
- Covestro AG
- SABIC
- Teijin Limited
- LG Chem
- Mitsubishi Engineering-Plastics Corporation (MEP)
For more Chemicals and Materials Market reports, please click here
List of Tables
Table 1: Polycarbonate Resin Market Overview 2023-2030
Table 2: Polycarbonate Resin Market Leader Analysis 2023-2024 (US$)
Table 3: Polycarbonate Resin Market Product Analysis 2023-2024 (US$)
Table 4: Polycarbonate Resin Market End User Analysis 2023-2024 (US$)
Table 5: Polycarbonate Resin Market Patent Analysis 2021-2023* (US$)
Table 6: Polycarbonate Resin Market Financial Analysis 2023-2024 (US$)
Table 7: Polycarbonate Resin Market Driver Analysis 2023-2024 (US$)
Table 8: Polycarbonate Resin Market Challenges Analysis 2023-2024 (US$)
Table 9: Polycarbonate Resin Market Constraint Analysis 2023-2024 (US$)
Table 10: Polycarbonate Resin Market Supplier Bargaining Power Analysis 2023-2024 (US$)
Table 11: Polycarbonate Resin Market Buyer Bargaining Power Analysis 2023-2024 (US$)
Table 12: Polycarbonate Resin Market Threat of Substitutes Analysis 2023-2024 (US$)
Table 13: Polycarbonate Resin Market Threat of New Entrants Analysis 2023-2024 (US$)
Table 14: Polycarbonate Resin Market Degree of Competition Analysis 2023-2024 (US$)
Table 15: Polycarbonate Resin Market Value Chain Analysis 2023-2024 (US$)
Table 16: Polycarbonate Resin Market Pricing Analysis 2023-2030 (US$)
Table 17: Polycarbonate Resin Market Opportunities Analysis 2023-2030 (US$)
Table 18: Polycarbonate Resin Market Product Life Cycle Analysis 2023-2030 (US$)
Table 19: Polycarbonate Resin Market Supplier Analysis 2023-2024 (US$)
Table 20: Polycarbonate Resin Market Distributor Analysis 2023-2024 (US$)
Table 21: Polycarbonate Resin Market Trend Analysis 2023-2024 (US$)
Table 22: Polycarbonate Resin Market Size 2023 (US$)
Table 23: Polycarbonate Resin Market Forecast Analysis 2023-2030 (US$)
Table 24: Polycarbonate Resin Market Sales Forecast Analysis 2023-2030 (Units)
Table 25: Polycarbonate Resin Market , Revenue & Volume,By Application, 2023-2030 ($)
Table 26: Polycarbonate Resin Market By Application, Revenue & Volume,By Packaging, 2023-2030 ($)
Table 27: Polycarbonate Resin Market By Application, Revenue & Volume,By Automotive, 2023-2030 ($)
Table 28: Polycarbonate Resin Market By Application, Revenue & Volume,By Building and Construction, 2023-2030 ($)
Table 29: Polycarbonate Resin Market By Application, Revenue & Volume,By Paints and Coatings, 2023-2030 ($)
Table 30: Polycarbonate Resin Market By Application, Revenue & Volume,By Application 5, 2023-2030 ($)
Table 31: Polycarbonate Resin Market , Revenue & Volume,By Electronics and Electrical (Incl. Optical Media & Lighting), 2023-2030 ($)
Table 32: North America Polycarbonate Resin Market , Revenue & Volume,By Application, 2023-2030 ($)
Table 33: North America Polycarbonate Resin Market , Revenue & Volume,By Electronics and Electrical (Incl. Optical Media & Lighting), 2023-2030 ($)
Table 34: South america Polycarbonate Resin Market , Revenue & Volume,By Application, 2023-2030 ($)
Table 35: South america Polycarbonate Resin Market , Revenue & Volume,By Electronics and Electrical (Incl. Optical Media & Lighting), 2023-2030 ($)
Table 36: Europe Polycarbonate Resin Market , Revenue & Volume,By Application, 2023-2030 ($)
Table 37: Europe Polycarbonate Resin Market , Revenue & Volume,By Electronics and Electrical (Incl. Optical Media & Lighting), 2023-2030 ($)
Table 38: APAC Polycarbonate Resin Market , Revenue & Volume,By Application, 2023-2030 ($)
Table 39: APAC Polycarbonate Resin Market , Revenue & Volume,By Electronics and Electrical (Incl. Optical Media & Lighting), 2023-2030 ($)
Table 40: Middle East & Africa Polycarbonate Resin Market , Revenue & Volume,By Application, 2023-2030 ($)
Table 41: Middle East & Africa Polycarbonate Resin Market , Revenue & Volume,By Electronics and Electrical (Incl. Optical Media & Lighting), 2023-2030 ($)
Table 42: Russia Polycarbonate Resin Market , Revenue & Volume,By Application, 2023-2030 ($)
Table 43: Russia Polycarbonate Resin Market , Revenue & Volume,By Electronics and Electrical (Incl. Optical Media & Lighting), 2023-2030 ($)
Table 44: Israel Polycarbonate Resin Market , Revenue & Volume,By Application, 2023-2030 ($)
Table 45: Israel Polycarbonate Resin Market , Revenue & Volume,By Electronics and Electrical (Incl. Optical Media & Lighting), 2023-2030 ($)
Table 46: Top Companies 2023 (US$)Polycarbonate Resin Market , Revenue & Volume,,
Table 47: Product Launch 2023-2024Polycarbonate Resin Market , Revenue & Volume,,
Table 48: Mergers & Acquistions 2023-2024Polycarbonate Resin Market , Revenue & Volume,,
List of Figures
Figure 1: Overview of Polycarbonate Resin Market 2023-2030
Figure 2: Market Share Analysis for Polycarbonate Resin Market 2023 (US$)
Figure 3: Product Comparison in Polycarbonate Resin Market 2023-2024 (US$)
Figure 4: End User Profile for Polycarbonate Resin Market 2023-2024 (US$)
Figure 5: Patent Application and Grant in Polycarbonate Resin Market 2021-2023* (US$)
Figure 6: Top 5 Companies Financial Analysis in Polycarbonate Resin Market 2023-2024 (US$)
Figure 7: Market Entry Strategy in Polycarbonate Resin Market 2023-2024
Figure 8: Ecosystem Analysis in Polycarbonate Resin Market 2023
Figure 9: Average Selling Price in Polycarbonate Resin Market 2023-2030
Figure 10: Top Opportunites in Polycarbonate Resin Market 2023-2024
Figure 11: Market Life Cycle Analysis in Polycarbonate Resin Market
Figure 12: GlobalBy ApplicationPolycarbonate Resin Market Revenue, 2023-2030 ($)
Figure 13: GlobalBy Electronics and Electrical (Incl. Optical Media & Lighting)Polycarbonate Resin Market Revenue, 2023-2030 ($)
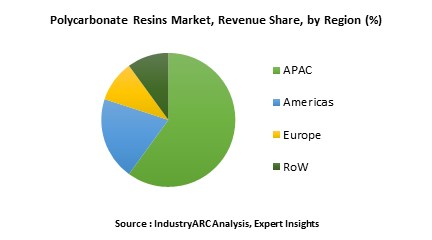
Figure 14: Global Polycarbonate Resin Market - By Geography
Figure 15: Global Polycarbonate Resin Market Value & Volume, By Geography, 2023-2030 ($)
Figure 16: Global Polycarbonate Resin Market CAGR, By Geography, 2023-2030 (%)
Figure 17: North America Polycarbonate Resin Market Value & Volume, 2023-2030 ($)
Figure 18: US Polycarbonate Resin Market Value & Volume, 2023-2030 ($)
Figure 19: US GDP and Population, 2023-2024 ($)
Figure 20: US GDP – Composition of 2023, By Sector of Origin
Figure 21: US Export and Import Value & Volume, 2023-2024 ($)
Figure 22: Canada Polycarbonate Resin Market Value & Volume, 2023-2030 ($)
Figure 23: Canada GDP and Population, 2023-2024 ($)
Figure 24: Canada GDP – Composition of 2023, By Sector of Origin
Figure 25: Canada Export and Import Value & Volume, 2023-2024 ($)
Figure 26: Mexico Polycarbonate Resin Market Value & Volume, 2023-2030 ($)
Figure 27: Mexico GDP and Population, 2023-2024 ($)
Figure 28: Mexico GDP – Composition of 2023, By Sector of Origin
Figure 29: Mexico Export and Import Value & Volume, 2023-2024 ($)
Figure 30: South America Polycarbonate Resin Market South America 3D Printing Market Value & Volume, 2023-2030 ($)
Figure 31: Brazil Polycarbonate Resin Market Value & Volume, 2023-2030 ($)
Figure 32: Brazil GDP and Population, 2023-2024 ($)
Figure 33: Brazil GDP – Composition of 2023, By Sector of Origin
Figure 34: Brazil Export and Import Value & Volume, 2023-2024 ($)
Figure 35: Venezuela Polycarbonate Resin Market Value & Volume, 2023-2030 ($)
Figure 36: Venezuela GDP and Population, 2023-2024 ($)
Figure 37: Venezuela GDP – Composition of 2023, By Sector of Origin
Figure 38: Venezuela Export and Import Value & Volume, 2023-2024 ($)
Figure 39: Argentina Polycarbonate Resin Market Value & Volume, 2023-2030 ($)
Figure 40: Argentina GDP and Population, 2023-2024 ($)
Figure 41: Argentina GDP – Composition of 2023, By Sector of Origin
Figure 42: Argentina Export and Import Value & Volume, 2023-2024 ($)
Figure 43: Ecuador Polycarbonate Resin Market Value & Volume, 2023-2030 ($)
Figure 44: Ecuador GDP and Population, 2023-2024 ($)
Figure 45: Ecuador GDP – Composition of 2023, By Sector of Origin
Figure 46: Ecuador Export and Import Value & Volume, 2023-2024 ($)
Figure 47: Peru Polycarbonate Resin Market Value & Volume, 2023-2030 ($)
Figure 48: Peru GDP and Population, 2023-2024 ($)
Figure 49: Peru GDP – Composition of 2023, By Sector of Origin
Figure 50: Peru Export and Import Value & Volume, 2023-2024 ($)
Figure 51: Colombia Polycarbonate Resin Market Value & Volume, 2023-2030 ($)
Figure 52: Colombia GDP and Population, 2023-2024 ($)
Figure 53: Colombia GDP – Composition of 2023, By Sector of Origin
Figure 54: Colombia Export and Import Value & Volume, 2023-2024 ($)
Figure 55: Costa Rica Polycarbonate Resin Market Costa Rica 3D Printing Market Value & Volume, 2023-2030 ($)
Figure 56: Costa Rica GDP and Population, 2023-2024 ($)
Figure 57: Costa Rica GDP – Composition of 2023, By Sector of Origin
Figure 58: Costa Rica Export and Import Value & Volume, 2023-2024 ($)
Figure 59: Europe Polycarbonate Resin Market Value & Volume, 2023-2030 ($)
Figure 60: U.K Polycarbonate Resin Market Value & Volume, 2023-2030 ($)
Figure 61: U.K GDP and Population, 2023-2024 ($)
Figure 62: U.K GDP – Composition of 2023, By Sector of Origin
Figure 63: U.K Export and Import Value & Volume, 2023-2024 ($)
Figure 64: Germany Polycarbonate Resin Market Value & Volume, 2023-2030 ($)
Figure 65: Germany GDP and Population, 2023-2024 ($)
Figure 66: Germany GDP – Composition of 2023, By Sector of Origin
Figure 67: Germany Export and Import Value & Volume, 2023-2024 ($)
Figure 68: Italy Polycarbonate Resin Market Value & Volume, 2023-2030 ($)
Figure 69: Italy GDP and Population, 2023-2024 ($)
Figure 70: Italy GDP – Composition of 2023, By Sector of Origin
Figure 71: Italy Export and Import Value & Volume, 2023-2024 ($)
Figure 72: France Polycarbonate Resin Market Value & Volume, 2023-2030 ($)
Figure 73: France GDP and Population, 2023-2024 ($)
Figure 74: France GDP – Composition of 2023, By Sector of Origin
Figure 75: France Export and Import Value & Volume, 2023-2024 ($)
Figure 76: Netherlands Polycarbonate Resin Market Value & Volume, 2023-2030 ($)
Figure 77: Netherlands GDP and Population, 2023-2024 ($)
Figure 78: Netherlands GDP – Composition of 2023, By Sector of Origin
Figure 79: Netherlands Export and Import Value & Volume, 2023-2024 ($)
Figure 80: Belgium Polycarbonate Resin Market Value & Volume, 2023-2030 ($)
Figure 81: Belgium GDP and Population, 2023-2024 ($)
Figure 82: Belgium GDP – Composition of 2023, By Sector of Origin
Figure 83: Belgium Export and Import Value & Volume, 2023-2024 ($)
Figure 84: Spain Polycarbonate Resin Market Value & Volume, 2023-2030 ($)
Figure 85: Spain GDP and Population, 2023-2024 ($)
Figure 86: Spain GDP – Composition of 2023, By Sector of Origin
Figure 87: Spain Export and Import Value & Volume, 2023-2024 ($)
Figure 88: Denmark Polycarbonate Resin Market Value & Volume, 2023-2030 ($)
Figure 89: Denmark GDP and Population, 2023-2024 ($)
Figure 90: Denmark GDP – Composition of 2023, By Sector of Origin
Figure 91: Denmark Export and Import Value & Volume, 2023-2024 ($)
Figure 92: APAC Polycarbonate Resin Market Value & Volume, 2023-2030 ($)
Figure 93: China Polycarbonate Resin Market Value & Volume, 2023-2030
Figure 94: China GDP and Population, 2023-2024 ($)
Figure 95: China GDP – Composition of 2023, By Sector of Origin
Figure 96: China Export and Import Value & Volume, 2023-2024 ($)Polycarbonate Resin Market China Export and Import Value & Volume, 2023-2024 ($)
Figure 97: Australia Polycarbonate Resin Market Value & Volume, 2023-2030 ($)
Figure 98: Australia GDP and Population, 2023-2024 ($)
Figure 99: Australia GDP – Composition of 2023, By Sector of Origin
Figure 100: Australia Export and Import Value & Volume, 2023-2024 ($)
Figure 101: South Korea Polycarbonate Resin Market Value & Volume, 2023-2030 ($)
Figure 102: South Korea GDP and Population, 2023-2024 ($)
Figure 103: South Korea GDP – Composition of 2023, By Sector of Origin
Figure 104: South Korea Export and Import Value & Volume, 2023-2024 ($)
Figure 105: India Polycarbonate Resin Market Value & Volume, 2023-2030 ($)
Figure 106: India GDP and Population, 2023-2024 ($)
Figure 107: India GDP – Composition of 2023, By Sector of Origin
Figure 108: India Export and Import Value & Volume, 2023-2024 ($)
Figure 109: Taiwan Polycarbonate Resin Market Taiwan 3D Printing Market Value & Volume, 2023-2030 ($)
Figure 110: Taiwan GDP and Population, 2023-2024 ($)
Figure 111: Taiwan GDP – Composition of 2023, By Sector of Origin
Figure 112: Taiwan Export and Import Value & Volume, 2023-2024 ($)
Figure 113: Malaysia Polycarbonate Resin Market Malaysia 3D Printing Market Value & Volume, 2023-2030 ($)
Figure 114: Malaysia GDP and Population, 2023-2024 ($)
Figure 115: Malaysia GDP – Composition of 2023, By Sector of Origin
Figure 116: Malaysia Export and Import Value & Volume, 2023-2024 ($)
Figure 117: Hong Kong Polycarbonate Resin Market Hong Kong 3D Printing Market Value & Volume, 2023-2030 ($)
Figure 118: Hong Kong GDP and Population, 2023-2024 ($)
Figure 119: Hong Kong GDP – Composition of 2023, By Sector of Origin
Figure 120: Hong Kong Export and Import Value & Volume, 2023-2024 ($)
Figure 121: Middle East & Africa Polycarbonate Resin Market Middle East & Africa 3D Printing Market Value & Volume, 2023-2030 ($)
Figure 122: Russia Polycarbonate Resin Market Russia 3D Printing Market Value & Volume, 2023-2030 ($)
Figure 123: Russia GDP and Population, 2023-2024 ($)
Figure 124: Russia GDP – Composition of 2023, By Sector of Origin
Figure 125: Russia Export and Import Value & Volume, 2023-2024 ($)
Figure 126: Israel Polycarbonate Resin Market Value & Volume, 2023-2030 ($)
Figure 127: Israel GDP and Population, 2023-2024 ($)
Figure 128: Israel GDP – Composition of 2023, By Sector of Origin
Figure 129: Israel Export and Import Value & Volume, 2023-2024 ($)
Figure 130: Entropy Share, By Strategies, 2023-2024* (%)Polycarbonate Resin Market
Figure 131: Developments, 2023-2024*Polycarbonate Resin Market
Figure 132: Company 1 Polycarbonate Resin Market Net Revenue, By Years, 2023-2024* ($)
Figure 133: Company 1 Polycarbonate Resin Market Net Revenue Share, By Business segments, 2023 (%)
Figure 134: Company 1 Polycarbonate Resin Market Net Sales Share, By Geography, 2023 (%)
Figure 135: Company 2 Polycarbonate Resin Market Net Revenue, By Years, 2023-2024* ($)
Figure 136: Company 2 Polycarbonate Resin Market Net Revenue Share, By Business segments, 2023 (%)
Figure 137: Company 2 Polycarbonate Resin Market Net Sales Share, By Geography, 2023 (%)
Figure 138: Company 3Polycarbonate Resin Market Net Revenue, By Years, 2023-2024* ($)
Figure 139: Company 3Polycarbonate Resin Market Net Revenue Share, By Business segments, 2023 (%)
Figure 140: Company 3Polycarbonate Resin Market Net Sales Share, By Geography, 2023 (%)
Figure 141: Company 4 Polycarbonate Resin Market Net Revenue, By Years, 2023-2024* ($)
Figure 142: Company 4 Polycarbonate Resin Market Net Revenue Share, By Business segments, 2023 (%)
Figure 143: Company 4 Polycarbonate Resin Market Net Sales Share, By Geography, 2023 (%)
Figure 144: Company 5 Polycarbonate Resin Market Net Revenue, By Years, 2023-2024* ($)
Figure 145: Company 5 Polycarbonate Resin Market Net Revenue Share, By Business segments, 2023 (%)
Figure 146: Company 5 Polycarbonate Resin Market Net Sales Share, By Geography, 2023 (%)
Figure 147: Company 6 Polycarbonate Resin Market Net Revenue, By Years, 2023-2024* ($)
Figure 148: Company 6 Polycarbonate Resin Market Net Revenue Share, By Business segments, 2023 (%)
Figure 149: Company 6 Polycarbonate Resin Market Net Sales Share, By Geography, 2023 (%)
Figure 150: Company 7 Polycarbonate Resin Market Net Revenue, By Years, 2023-2024* ($)
Figure 151: Company 7 Polycarbonate Resin Market Net Revenue Share, By Business segments, 2023 (%)
Figure 152: Company 7 Polycarbonate Resin Market Net Sales Share, By Geography, 2023 (%)
Figure 153: Company 8 Polycarbonate Resin Market Net Revenue, By Years, 2023-2024* ($)
Figure 154: Company 8 Polycarbonate Resin Market Net Revenue Share, By Business segments, 2023 (%)
Figure 155: Company 8 Polycarbonate Resin Market Net Sales Share, By Geography, 2023 (%)
Figure 156: Company 9 Polycarbonate Resin Market Net Revenue, By Years, 2023-2024* ($)
Figure 157: Company 9 Polycarbonate Resin Market Net Revenue Share, By Business segments, 2023 (%)
Figure 158: Company 9 Polycarbonate Resin Market Net Sales Share, By Geography, 2023 (%)
Figure 159: Company 10 Polycarbonate Resin Market Net Revenue, By Years, 2023-2024* ($)
Figure 160: Company 10 Polycarbonate Resin Market Net Revenue Share, By Business segments, 2023 (%)
Figure 161: Company 10 Polycarbonate Resin Market Net Sales Share, By Geography, 2023 (%)
Figure 162: Company 11 Polycarbonate Resin Market Net Revenue, By Years, 2023-2024* ($)
Figure 163: Company 11 Polycarbonate Resin Market Net Revenue Share, By Business segments, 2023 (%)
Figure 164: Company 11 Polycarbonate Resin Market Net Sales Share, By Geography, 2023 (%)
Figure 165: Company 12 Polycarbonate Resin Market Net Revenue, By Years, 2023-2024* ($)
Figure 166: Company 12 Polycarbonate Resin Market Net Revenue Share, By Business segments, 2023 (%)
Figure 167: Company 12 Polycarbonate Resin Market Net Sales Share, By Geography, 2023 (%)
Figure 168: Company 13Polycarbonate Resin Market Net Revenue, By Years, 2023-2024* ($)
Figure 169: Company 13Polycarbonate Resin Market Net Revenue Share, By Business segments, 2023 (%)
Figure 170: Company 13Polycarbonate Resin Market Net Sales Share, By Geography, 2023 (%)
Figure 171: Company 14 Polycarbonate Resin Market Net Revenue, By Years, 2023-2024* ($)
Figure 172: Company 14 Polycarbonate Resin Market Net Revenue Share, By Business segments, 2023 (%)
Figure 173: Company 14 Polycarbonate Resin Market Net Sales Share, By Geography, 2023 (%)
Figure 174: Company 15 Polycarbonate Resin Market Net Revenue, By Years, 2023-2024* ($)
Figure 175: Company 15 Polycarbonate Resin Market Net Revenue Share, By Business segments, 2023 (%)
Figure 176: Company 15 Polycarbonate Resin Market Net Sales Share, By Geography, 2023 (%)