U.S. Olefins Market - Forecast(2024 - 2030)

Report Code: CMR 0157 Report Format: PDF + Excel
The U.S Olefins Market is segmented by type, feedstock, product and end user. The market consists of ethylene and propylene products. Among these, ethylene market is anticipated to rise at a CAGR of 4.3% between 2018 and 2023. Among the different feedstock used for the production of olefins, ethane accounted for 21.55 MMTPA in 2017 and is expected to rise at a CAGR of 5.6% during 2018-2023. The use of ethane reduces the production cost significantly and thus the demand is increasing rapidly. The demand for olefins will continue rising during the forecast period as it is widely used in construction, polyester fibers, and packaging of consumer products.

What are Olefins?
Olefins are also known as alkenes which are made up of hydrogen and carbon that contains one or more pairs of carbon atoms linked by a double bond. Ethylene occurs naturally in the environment and is produced by plants of all types. Olefins are class of compounds which include ethylene, propylene and butadiene. The production of olefin is mainly dependent on natural gas processing products or crude oil fractions. Ethylene is produced from various feed stocks such as crude oil condensates, natural gas, ethane, butane, propane and others. The current technology used for the olefin production is steam cracking. Ethylene is the largest volume olefin produced in the U.S. and globally.  

   
What are the applications of Olefins?
Olefins are used in various industries such as polymer, building and construction, food, manufacturing, textile and automotive. Polymers of ethylene are used to manufacture fibers, bins, pails, crates, bottles, piping, food packaging films, trash liners, bags, wire and cable sheathing, insulation, surface coatings for paper and cardboard and wide variety of other products. In building and construction, olefins are used in tile and flooring. Ethylene is also used to manufacture other chemicals that are used as antifreeze, solvents, surfactants, detergents, and polyglycols. Olefins are also used as fuel gas in the welding and cutting operations in manufacturing industries. They are also used as a refrigerant in commercial greenhouses as a ripening agent for fruits and vegetables.

U.S. Olefins Market

Market Research and Market Trends of U.S Olefins Market:
  • The exploitation of crude oil has become very expensive due to the depletion of sources. This opens doors for the use of alternative, cost effective and bio based feed stocks for the production of olefins. The olefin market is focusing on the use of biomass, a carbon- rich material, as a feedstock. The manufacturers are aiming to make the best use of bio based products with high efficiency so that the production becomes cost effective. 
  • Due to the technological advancements and refinements in fracking process, the methane production has increased enormously and the price of methane has dropped significantly. This has drawn the attention of several olefin manufacturing companies in the United States. Due to the large availability of shale gas, manufacturers are finding routes for valorizing methane in the form of olefins either directly or indirectly. 
  • LyondellBasell Industries has acquired A. Schulman Inc. for $2.25 billion. This acquisition will allow the company to gain high growth markets such as agriculture, electronics and construction. This merger indicates how the abundance and affordability of U.S. shale natural gas, combined with pro-growth public policies, is making a real difference in the growth of America's economy.
  • Companies are investing in the development of new olefin producing technologies to improve the way plastics and chemical precursors are produced and separated by saving energy and creating less waste. The main focus of the companies creating new value from existing streams, all while capturing energy savings and reducing carbon footprint.

Who are the Major Players in U.S Olefins Market?
The companies referred in the market research report are Dow Chemical Company, BASF SE, Royal Dutch Shell plc, ExxonMobil Corporation and 10 other companies.

What is our report scope?
The report incorporates in-depth assessment of the competitive landscape, product market sizing, product benchmarking, market trends, product developments, financial analysis, strategic analysis and so on to gauge the impact forces and potential opportunities of the market. Apart from this the report also includes a study of major developments in the market such as product launches, agreements, acquisitions, collaborations, mergers and so on to comprehend the prevailing market dynamics at present and its impact during the forecast period 2018-2023.

All our reports are customizable to your company needs to a certain extent, we do provide 20 free consulting hours along with purchase of each report, and this will allow you to request any additional data to customize the report to your needs.

Key Takeaways from this Report
  • Evaluate market potential through analyzing growth rates (CAGR %), Volume (Units) and Value ($M) data given at country level – for product types, end use applications and by different industry verticals.
  • Understand the different dynamics influencing the market – key driving factors, challenges and hidden opportunities.
  • Get in-depth insights on your competitor performance – market shares, strategies, financial benchmarking, product benchmarking, SWOT and more.
  • Analyze the sales and distribution channels across key geographies to improve top-line revenues.
  • Understand the industry supply chain with a deep-dive on the value augmentation at each step, in order to optimize value and bring efficiencies in your processes. 
  • Get a quick outlook on the market entropy – M&A’s, deals, partnerships, product launches of all key players for the past 4 years. 
  • Evaluate the supply-demand gaps, import-export statistics and regulatory landscape for more than top 20 countries globally for the market. 

1. U.S Olefins Market Overview

2. U.S Olefins Market Executive Summary

3. U.S Olefins Market Landscape

   3.1. Market share Analysis

   3.2. Comparative Analysis

      3.2.1. Product Benchmarking

      3.2.2. Product Share Analysis

      3.2.3. Top 5 Financials Analysis

      3.2.4. End-Users Analysis

4. U.S Olefins Market Forces   

   4.1. Market Drivers

   4.2. Market Challenges

   4.3. Market Restraints 

   4.4. Attractiveness of Oilfield Biocides and Bio Solvents Industry

      4.4.1. Power of Suppliers

      4.4.2. Power of Customers

      4.4.3. Threats of Substitution

      4.4.4. Degree of Competition

      4.4.5. Threats of New Entrants

5. U.S Olefins Market - Strategic Analysis

   5.1. Value Chain Analysis

   5.2. Suppliers and Distributors

   5.3. Pricing Analysis

   5.4. Product/Market life Cycle Analysis

   5.5. Regulation Analysis

6. U.S Olefins Market – By Type

   6.1. Monoolefins

   6.2. Diolefins

   6.3. Triolefins

   6.4. Others

7. U.S Olefins Market – By Feedstock

   7.1. Gaseous Feeds

      7.1.1. Ethane

      7.1.2. Propane

      7.1.3. Butane

      7.1.4. Others

   7.2. Liquid Feeds

      7.2.1. Condensates from natural gas

      7.2.2. Crude Oil

      7.2.3. Atmospheric gas oil

      7.2.4. Hydrogenated vacuum gas oil

      7.2.5. Others

8. U.S Olefins Market – By Production Technique

   8.1. Thermal Steam Cracking (TCS)

   8.2. Fluid Catalytic Cracking (FCC)

   8.3. Refinery Process

   8.4. Others

9. U.S Olefins Market – By Product

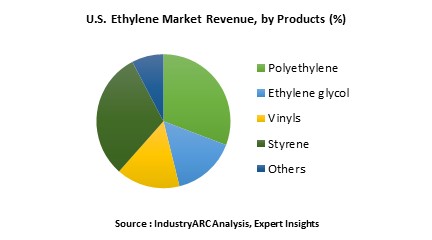
   9.1. Ethylene products

      9.1.1. Polyethylene

      9.1.2. Ethylene glycol

      9.1.3. Vinyl

      9.1.4. Styrene

      9.1.5.  Others

   9.2. Propylene products

      9.2.1. Polypropylene

      9.2.2. Cumene

      9.2.3. Acrylonitrile

      9.2.4.  Others

10. U.S Olefins Market – By End User

   10.1. Polymer Industry

      10.1.1. Polyethlene

      10.1.2. Gaskets

      10.1.3. Plastic Gloves

      10.1.4. Fibers

      10.1.5. Crates

      10.1.6. Others

   10.2. Food Industry

      10.2.1. Bottles

      10.2.2. Food packaging

      10.2.3. Others

   10.3. Chemical Industry

      10.3.1. Antifreeze

      10.3.2. Solvent

      10.3.3. Surfactant

      10.3.4. Detergent

      10.3.5. Others

   10.4. Building and Constructing

      10.4.1. Tiles

      10.4.2. Flooring

      10.4.3. Others

   10.5. Manufacturing Industry

      10.5.1. Welding

      10.5.2. Cutting

   10.6. Oil and Gas

      10.6.1. Refrigerant

      10.6.2. Lubricants

      10.6.3. Oil field chemicals

      10.6.4. Others

   10.7. Automotive Industry

      10.7.1. Seat construction

      10.7.2. Truck liners

      10.7.3. Load decks

      10.7.4. Package shelf

      10.7.5. Others

   10.8. Others

11. U.S Olefins Market Entropy

   11.1. New Product Launches

   11.2. M&As, Collaborations, JVs and Partnerships

12. U.S Olefins Market Company Profiles 

   12.1. Dow Chemical Company

   12.2. BASF SE

   12.3. Royal Dutch Shell plc

   12.4. ExxonMobil Corporation 

   12.5. Company 5

   12.6. Company 6

   12.7. Company 7

   12.8. Company 8

   12.9. Company 9

   12.10. Company 10

*More than 10 Companies are profiled in this Research Report*

"*Financials would be provided on a best efforts basis for private companies"

13. Appendix

   13.1. Abbreviations

   13.2. Sources

   13.3. Research Methodology

   13.4. Bibliography

   13.5. Compilation of Expert Insights

   13.6. Disclaimer

List Of Tables:

Table 1 Ethylene Plants In The U.S. (Mmtpa)
Table 2 U.S. Ethylene Demand, By Feedstock 2014-2020 (Mt)
Table 3 U.S. Ethylene Market Volume, By Product 2014-2020 (Mt)
Table 4 U.S. Ethylene Market Revenue, By Product 2014-2020 ($Million)
Table 5 U.S. Propylene Market Volume, By Product 2014-2020 (Mt)
Table 6 U.S. Propylene Market Revenue, By Product 2014-2020 ($Million)
Table 7 New Ethylene Plants, By Capacity
Table 8 New Propane Dehydrogenation Plants, By Capacity
Table 9 The Dow Chemical Company – Financials
Table 10 The Dow Chemical Company – Production Facilities
Table 11 Exxonmobil Corporation – Financials
Table 12 Exxonmobil Corporation – Production Facilities
Table 13 Lyondellbasell Industries Nv – Financials
Table 14 Lyondellbasell Industries Nv – Production Facilities
Table 15 Basf Se – Financials
Table 16 Basf Se– Production Facilities
Table 17 Royal Dutch Shell Plc –  Financials
Table 18 Royal Dutch Shell Plc – Production Facilities


List Of Figures:

Figure 1 U.S. Ethylene Production Share, By Company, 2014 (%)
Figure 2 U.S. Olefins Demand, Mmtpa, 2014-2020
Figure 3 U.S. Ethylene Demand By Feedstock, Mmtpa, 2014-2020
Figure 4 U.S. Ethylene Demand By Product, Mmtpa, 2014-2020
Figure 5 U.S. Ethylene Market Revenue By Product, 2014-2020
Figure 6 U.S. Ethylene Production, Mmtpa, 2014-2020
Figure 7 U.S. Propylene Demand Forecast By Process, Mmtpa, 2014-2020
Figure 8 U.S. Propylene Demand Forecast By Product, Mmtpa, 2014-2020
Figure 9 U.S. Ethylene Export Forecast 2015-2020
Figure 10 Major Ethylene Exports From U.S. In 2013-2014
Figure 11 U.S. Ethylene Import Forecast 2015-2020
Figure 12 U.S. Ethylene Net Exports, Mmtpa, 2014-2020
Figure 13 U.S. Propylene Export Forecast 2015-2020
Figure 14 Major Propylene Exports From U.S. In 2014
Figure 15 U.S. Propylene Import Forecast 2015-2020
Figure 16 U.S. Propylene Net Exports, Mmtpa, 2014-2020
Figure 17 Average Export – Import Prices Of Ethylene In The U.S. 2005-2020
Figure 18 Average Export – Import Prices Of Propylene In The U.S. 2005-2020
Figure 19 Ethylene Vs. Propylene Price
Figure 20 Olefins In U.S. – Supply Chain Analysis
Figure 21 Ethylene Chain
Figure 22 Propylene Chain
Figure 23 Dow Chemical- Business Segment-2014
Figure 24 Dow Chemical- Geographic Segment-2014
Figure 25 Exxonmobil- Business Segment-2014
Figure 26 Exxonmobil- Geographic Segment-2014
Figure 27 Lyondellbasell-Business Segment
Figure 28 Basf Se-Business Segment-2014
Figure 29 Basf Se-Geographic Segment
Figure 30 Royal Dutch Shell Plc- Business Segment
Figure 31 Royal Dutch Shell Plc- Geographic Segment