 Email
Email Print
Print


Omega-3 Polyunsaturated Fatty Acids Market Overview:
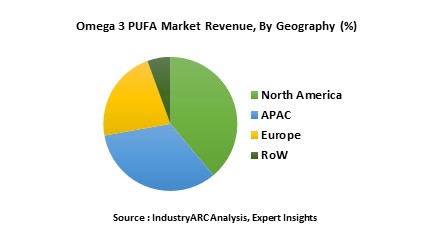
Omega-3 Polyunsaturated Fatty Acids are ingredients that are used to improve the cardiovascular system and are a part of polyunsaturated fatty acids. These ingredients are available in marine sources and plant sources. The market for Omega 3 polyunsaturated fatty acids was valued at $2188.87 million and is estimated to reach by $3229.99 million by 2023 at an estimated CAGR of 6.7%. North America held the largest share in the market with a share of 46.3% followed by the APAC region. EPA has been the largest ingredient type in the Omega-3 polyunsaturated fatty acids holding a share value of 64.7%.
Omega-3 Polyunsaturated Fatty Acids Market Outlook:
Omega 3 polyunsaturated fatty acids are classified in to many types such as EPA, DHA, SDA, ALA and many more. EPA and DHA are derived from variety of fishes like salmon, mackerel, sardine and many more. Each of the omega-3 polyunsaturated fatty acids have their own benefits. But, DHA plays an important role over other fatty acids as it helps in brain development. EPA helps in relieving from depression and many more. There are various forms of availability of these fatty acids such as powder, liquids and capsules. The sources of Omega-3 polyunsaturated fatty acids are marine and plants. Marine animals such as salmon, mackerel, herring and sardines and plant sources like flaxseeds, chia seeds, walnuts, soybean oil, canola oil and many more are rich sources of omega-3 polyunsaturated fatty acids.
The cost for Omega-3 polyunsaturated fatty acids of 1000mg is around $128-$136.
Omega-3 Polyunsaturated Fatty Acids Market Growth drivers:
The increasing awareness in consumers on the benefits of omega-3 polyunsaturated fatty acids and nutrition is a major key driver for the omega-3 polyunsaturated fatty acids. The usage of omega-3 polyunsaturated fatty acids with omega-6 polyunsaturated fatty acids in medicine for treating cardiovascular diseases and cancer is also driving the omega-3 polyunsaturated fatty acids market. The continuous research and developments in the omega-3 polyunsaturated fatty acids will also fuel the growth of the market.
Omega-3 Polyunsaturated Fatty Acids Market Challenges:
The major challenge in the Omega-3 Polyunsaturated Fatty Acids market is the low production of fish oil and also the rancid nature of oils. The other challenge that is restricting the growth of the oils is the poor research and development activities in this market.
Omega-3 Polyunsaturated Fatty Acids Market Research Scope:
The base year of the study is 2017, with forecast done up to 2023. The study presents a thorough analysis of the competitive landscape, taking into account the market shares of the leading companies. It also provides information on unit shipments. These provide the key market participants with the necessary business intelligence and help them understand the future of the Superabsorbent Market. The assessment includes the forecast, an overview of the competitive structure, the market shares of the competitors, as well as the market trends, market demands, market drivers, market challenges, and product analysis. The market drivers and restraints have been assessed to fathom their impact over the forecast period. This report further identifies the key opportunities for growth while also detailing the key challenges and possible threats. The key areas of focus include the types of plastics in the electric vehicle market, and their specific applications in different types of vehicles.
Omega-3 Polyunsaturated Fatty Acids (SAP) Market Report: Industry Coverage
Omega-3 Polyunsaturated Fatty Acids Market– By Type: Alpha-Linolenic Acid (ALA), Eicosapentaenoic Acid (ESA), Docosahexaenoic Acid, Stearidonic Acid (SDA), Heneicosapentaenoic Acid and Others
Omega-3 Polyunsaturated Fatty Acids Market– By Form: Oils, Capsules, Powder.
Omega-3 Polyunsaturated Fatty Acids Market– By Source: Salmon, Anchovy, Cod, Krill, Algae and others.
Omega-3 Polyunsaturated Fatty Acids Market– By Application: Dietary supplements, Food and Beverages industry, Pharmaceuticals industry.
The Superabsorbent Market report also analyzes the major geographic regions for the market as well as the major countries for the market in these regions. The regions and countries covered in the study include:
- North America: The U.S., Canada, Mexico
- South America: Brazil, Venezuela, Argentina, Ecuador, Peru, Colombia, Costa Rica
- Europe: The U.K., Germany, Italy, France, The Netherlands, Belgium, Spain, Denmark
- APAC: China, Japan, Australia, South Korea, India, Taiwan, Malaysia, Hong Kong
- Middle East and Africa: Israel, South Africa, Saudi Arabia
Omega-3 Polyunsaturated Fatty Acids Market Key Players Perspective:
Some of the Key players in this market that have been studied for this report include: Cargill Incorporated, Golden Omega S.A, Croda International Plc, Omega Protein Corporation, FMC Corporation and many more.
Market Research and Market Trends of Omega-3 Polyunsaturated Fatty Acids Market
- Latitude™, a plant-based oil alternative for fish feed applications by Cargill Inc., has reduced its dependency on marine sources, thus by reducing environmental degradation. This product has longer omega-3 chains and is suitable for fish feed manufacturers. Canola oil is being used in this product as the major ingredient and has no effect on fish growth rates.
- Cooke Inc., a major company in the aquaculture has acquired Omega Protein Corporation, also a key player in the Omega-3 Polyunsaturated fatty acids for $500 million. This acquisition is to provide various nutritional foods and products, dietary supplements and many more from the marine sources.
- Royal DSM and Evonik industries have set up a new company called Veramaris V.O.F. to produce omega-3 fatty acids from marine algae that can be used for animal nutrition. This company was constructed in Blair, U.S.A and will start selling the oils from 2019.
1. Omega-3 Polyunsaturated Fatty Acids Market - Overview
1.1. Definitions and Scope
2. Omega-3 Polyunsaturated Fatty Acids Market - Executive summary
2.1. Market Revenue, Market Size and Key Trends by Company
2.2. Key Trends by type of Application
2.3. Key Trends segmented by Geography
3. Omega-3 Polyunsaturated Fatty Acids Market
3.1. Comparative analysis
3.1.1. Product Benchmarking - Top 10 companies
3.1.2. Top 5 Financials Analysis
3.1.3. Market Value split by Top 10 companies
3.1.4. Patent Analysis - Top 10 companies
3.1.5. Pricing Analysis
4. Omega-3 Polyunsaturated Fatty Acids Market – Startup companies Scenario Premium
4.1. Top 10 startup company Analysis by
4.1.1. Investment
4.1.2. Revenue
4.1.3. Market Shares
4.1.4. Market Size and Application Analysis
4.1.5. Venture Capital and Funding Scenario
5. Omega-3 Polyunsaturated Fatty Acids Market – Industry Market Entry Scenario Premium
5.1. Regulatory Framework Overview
5.2. New Business and Ease of Doing business index
5.3. Case studies of successful ventures
5.4. Customer Analysis – Top 10 companies
6. Omega-3 Polyunsaturated Fatty Acids Market Forces
6.1. Drivers
6.2. Constraints
6.3. Challenges
6.4. Porters five force model
6.4.1. Bargaining power of suppliers
6.4.2. Bargaining powers of customers
6.4.3. Threat of new entrants
6.4.4. Rivalry among existing players
6.4.5. Threat of substitutes
7. Omega-3 Polyunsaturated Fatty Acids Market -Strategic analysis
7.1. Value chain analysis
7.2. Opportunities analysis
7.3. Product life cycle
8. Omega-3 Polyunsaturated Fatty Acids Market– By Type (Market Size -$Million / $Billion)
8.1. Segment type Size and Market Share Analysis
8.2. Application Revenue and Trends by type of Application
8.3. Product Segment Analysis by Type
8.3.1. Alpha-Linolenic Acid (ALA)
8.3.2. Eicosapentaenoic Acid (ESA)
8.3.3. Docosahexaenoic Acid
8.3.4. Stearidonic Acid (SDA)
8.3.5. Heneicosapentaenoic Acid
8.3.6. Others
9. Omega-3 Polyunsaturated Fatty Acids Market– By Form (Market Size -$Million / $Billion)
9.1. Oils
9.2. Capsules
9.3. Powder
10. Omega-3 Polyunsaturated Fatty Acids Market– By Source (Market Size -$Million / $Billion)
10.1. Marine sources
10.1.1. Salmon
10.1.2. Anchovy
10.1.3. Cod
10.1.4. Krill
10.1.5. Algae
10.1.6. Others
10.2. Plant sources
10.2.1. Flaxseed
10.2.2. Chia seeds
10.2.3. Walnuts
10.2.4. Others
11. Omega-3 Polyunsaturated Fatty Acids Market– By Oil Composition (Market Size -$Million / $Billion)
11.1. Triglyceride
11.2. Ethyl ester
11.3. Phospholipid
12. Omega-3 Polyunsaturated Fatty Acids Market– By Application (Market Size -$Million / $Billion)
12.1. Dietary supplements
12.2. Pharmaceuticals
12.3. Infant formula
12.4. Functional foods & beverages
12.5. Others
13. Omega-3 Polyunsaturated Fatty Acids Market– By End-user industry (Market Size -$Million / $Billion)
13.1. Market Size and Market Share Analysis
13.2. Application Revenue and Trend Research
13.3. Product Segment Analysis
13.3.1. Food & Beverages industry
13.3.2. Pharmaceuticals industry
14. Omega-3 Polyunsaturated Fatty Acids Market- By Geography (Market Size -$Million / $Billion)
14.1. Omega-3 Polyunsaturated Fatty Acids Market - North America Segment Research
14.2. North America Market Research (Million / $Billion)
14.2.1. Segment type Size and Market Size Analysis
14.2.2. Revenue and Trends
14.2.3. Application Revenue and Trends by type of Application
14.2.4. Company Revenue and Product Analysis
14.2.5. North America Product type and Application Market Size
14.2.5.1. U.S.
14.2.5.2. Canada
14.2.5.3. Mexico
14.2.5.4. Rest of North America
14.3. Omega-3 Polyunsaturated Fatty Acids Market- South America Segment Research
14.4. South America Market Research (Market Size -$Million / $Billion)
14.4.1. Segment type Size and Market Size Analysis
14.4.2. Revenue and Trends
14.4.3. Application Revenue and Trends by type of Application
14.4.4. Company Revenue and Product Analysis
14.4.5. South America Product type and Application Market Size
14.4.5.1. Brazil
14.4.5.2. Venezuela
14.4.5.3. Argentina
14.4.5.4. Ecuador
14.4.5.5. Peru
14.4.5.6. Colombia
14.4.5.7. Costa Rica
14.4.5.8. Rest of South America
14.5. Omega-3 Polyunsaturated Fatty Acids Market- Europe Segment Research
14.6. Europe Market Research (Market Size -$Million / $Billion)
14.6.1. Segment type Size and Market Size Analysis
14.6.2. Revenue and Trends
14.6.3. Application Revenue and Trends by type of Application
14.6.4. Company Revenue and Product Analysis
14.6.5. Europe Segment Product type and Application Market Size
14.6.5.1. U.K
14.6.5.2. Germany
14.6.5.3. Italy
14.6.5.4. France
14.6.5.5. Netherlands
14.6.5.6. Belgium
14.6.5.7. Spain
14.6.5.8. Denmark
14.6.5.9. Rest of Europe
14.7. Omega-3 Polyunsaturated Fatty Acids Market– APAC Segment Research
14.8. APAC Market Research (Market Size -$Million / $Billion)
14.8.1. Segment type Size and Market Size Analysis
14.8.2. Revenue and Trends
14.8.3. Application Revenue and Trends by type of Application
14.8.4. Company Revenue and Product Analysis
14.8.5. APAC Segment – Product type and Application Market Size
14.8.5.1. China
14.8.5.2. Australia
14.8.5.3. Japan
14.8.5.4. South Korea
14.8.5.5. India
14.8.5.6. Taiwan
14.8.5.7. Malaysia
14.8.5.8. Hong Kong
14.8.5.9. Rest of APAC
14.9. Omega-3 Polyunsaturated Fatty Acids Market– Middle East Segment and Africa Segment Research
14.10. Middle East & Africa Market Research (Market Size -$Million / $Billion)
14.10.1. Segment type Size and Market Size Analysis
14.10.2. Revenue and Trend Analysis
14.10.3. Application Revenue and Trends by type of Application
14.10.4. Company Revenue and Product Analysis
14.10.5. Middle East Segment Product type and Application Market Size
14.10.5.1. Israel
14.10.5.2. Saudi Arabia
14.10.5.3. UAE
14.10.6. Africa Segment Analysis
14.10.6.1. South Africa
14.10.6.2. Rest of Middle East & Africa
15. Omega-3 Polyunsaturated Fatty Acids Market - Entropy
15.1. New product launches
15.2. M&A's, collaborations, JVs and partnerships
16. Omega-3 Polyunsaturated Fatty Acids Market – Industry / Segment Competition landscape Premium
16.1. Market Share Analysis
16.1.1. Market Share by Country- Top companies
16.1.2. Market Share by Region- Top 10 companies
16.1.3. Market Share by type of Application – Top 10 companies
16.1.4. Market Share by type of Product / Product category- Top 10 companies
16.1.5. Market Share at global level- Top 10 companies
16.1.6. Best Practices for companies
17. Omega-3 Polyunsaturated Fatty Acids Market – Key Company List by Country Premium
18. Omega-3 Polyunsaturated Fatty Acids Market Company Analysis
18.1. Market Share, Company Revenue, Products, M&A, Developments
18.2. Cargill Incorporated
18.3. Golden Omega S.A
18.4. Croda International Plc
18.5. Omega Protein Corporation
18.6. FMC Corporation
18.7. Company 7
18.8. Company 8
18.9. Company 9
18.10. Company 10+
"*Financials would be provided on a best efforts basis for private companies"
19. Omega-3 Polyunsaturated Fatty Acids Market -Appendix
19.1. Abbreviations
19.2. Sources
20. Omega-3 Polyunsaturated Fatty Acids Market -Methodology Premium
20.1. Research Methodology
20.1.1. Company Expert Interviews
20.1.2. Industry Databases
20.1.3. Associations
20.1.4. Company News
20.1.5. Company Annual Reports
20.1.6. Application Trends
20.1.7. New Products and Product database
20.1.8. Company Transcripts
20.1.9. R&D Trends
20.1.10. Key Opinion Leaders Interviews
20.1.11. Supply and Demand Trends
List of Tables
Table 1 Omega 3 PUFA Market Overview 2023-2030
Table 2 Omega 3 PUFA Market Leader Analysis 2023-2024 (US$)
Table 3 Omega 3 PUFA MarketProduct Analysis 2023-2024 (US$)
Table 4 Omega 3 PUFA MarketEnd User Analysis 2023-2024 (US$)
Table 5 Omega 3 PUFA MarketPatent Analysis 2021-2023* (US$)
Table 6 Omega 3 PUFA MarketFinancial Analysis 2023-2024 (US$)
Table 7 Omega 3 PUFA Market Driver Analysis 2023-2024 (US$)
Table 8 Omega 3 PUFA MarketChallenges Analysis 2023-2024 (US$)
Table 9 Omega 3 PUFA MarketConstraint Analysis 2023-2024 (US$)
Table 10 Omega 3 PUFA Market Supplier Bargaining Power Analysis 2023-2024 (US$)
Table 11 Omega 3 PUFA Market Buyer Bargaining Power Analysis 2023-2024 (US$)
Table 12 Omega 3 PUFA Market Threat of Substitutes Analysis 2023-2024 (US$)
Table 13 Omega 3 PUFA Market Threat of New Entrants Analysis 2023-2024 (US$)
Table 14 Omega 3 PUFA Market Degree of Competition Analysis 2023-2024 (US$)
Table 15 Omega 3 PUFA MarketValue Chain Analysis 2023-2024 (US$)
Table 16 Omega 3 PUFA MarketPricing Analysis 2023-2030 (US$)
Table 17 Omega 3 PUFA MarketOpportunities Analysis 2023-2030 (US$)
Table 18 Omega 3 PUFA MarketProduct Life Cycle Analysis 2023-2030 (US$)
Table 19 Omega 3 PUFA MarketSupplier Analysis 2023-2024 (US$)
Table 20 Omega 3 PUFA MarketDistributor Analysis 2023-2024 (US$)
Table 21 Omega 3 PUFA Market Trend Analysis 2023-2024 (US$)
Table 22 Omega 3 PUFA Market Size 2023 (US$)
Table 23 Omega 3 PUFA Market Forecast Analysis 2023-2030 (US$)
Table 24 Omega 3 PUFA Market Sales Forecast Analysis 2023-2030 (Units)
Table 25 Omega 3 PUFA Market, Revenue & Volume,By Type, 2023-2030 ($)
Table 26 Omega 3 PUFA MarketBy Type, Revenue & Volume,By Pharmaceutical & Clinical Nutrition, 2023-2030 ($)
Table 27 Omega 3 PUFA MarketBy Type, Revenue & Volume,By Infant Food, 2023-2030 ($)
Table 28 Omega 3 PUFA MarketBy Type, Revenue & Volume,By Fortified Foods And Beverages, 2023-2030 ($)
Table 29 Omega 3 PUFA MarketBy Type, Revenue & Volume,By Nutritional Supplements, 2023-2030 ($)
Table 30 Omega 3 PUFA MarketBy Type, Revenue & Volume,By Omega-3 Fatty Acids, 2023-2030 ($)
Table 31 Omega 3 PUFA Market, Revenue & Volume,By Source, 2023-2030 ($)
Table 32 Omega 3 PUFA MarketBy Source, Revenue & Volume,By Plant Based, 2023-2030 ($)
Table 33 Omega 3 PUFA MarketBy Source, Revenue & Volume,By Marine Animals, 2023-2030 ($)
Table 34 Omega 3 PUFA MarketBy Source, Revenue & Volume,By Micro Algae, 2023-2030 ($)
Table 35 Omega 3 PUFA MarketBy Source, Revenue & Volume,By Anchovy/ Sardines, 2023-2030 ($)
Table 36 Omega 3 PUFA MarketBy Source, Revenue & Volume,By Concentrates, 2023-2030 ($)
Table 37 Omega 3 PUFA Market, Revenue & Volume,By Chemical Composition, 2023-2030 ($)
Table 38 Omega 3 PUFA MarketBy Chemical Composition, Revenue & Volume,By Triglyceride (Tg), 2023-2030 ($)
Table 39 Omega 3 PUFA MarketBy Chemical Composition, Revenue & Volume,By Ethyl Ester (Ee), 2023-2030 ($)
Table 40 Omega 3 PUFA MarketBy Chemical Composition, Revenue & Volume,By Phospholipid (Pl), 2023-2030 ($)
Table 41 North America Omega 3 PUFA Market, Revenue & Volume,By Type, 2023-2030 ($)
Table 42 North America Omega 3 PUFA Market, Revenue & Volume,By Source, 2023-2030 ($)
Table 43 North America Omega 3 PUFA Market, Revenue & Volume,By Chemical Composition, 2023-2030 ($)
Table 44 South america Omega 3 PUFA Market, Revenue & Volume,By Type, 2023-2030 ($)
Table 45 South america Omega 3 PUFA Market, Revenue & Volume,By Source, 2023-2030 ($)
Table 46 South america Omega 3 PUFA Market, Revenue & Volume,By Chemical Composition, 2023-2030 ($)
Table 47 Europe Omega 3 PUFA Market, Revenue & Volume,By Type, 2023-2030 ($)
Table 48 Europe Omega 3 PUFA Market, Revenue & Volume,By Source, 2023-2030 ($)
Table 49 Europe Omega 3 PUFA Market, Revenue & Volume,By Chemical Composition, 2023-2030 ($)
Table 50 APAC Omega 3 PUFA Market, Revenue & Volume,By Type, 2023-2030 ($)
Table 51 APAC Omega 3 PUFA Market, Revenue & Volume,By Source, 2023-2030 ($)
Table 52 APAC Omega 3 PUFA Market, Revenue & Volume,By Chemical Composition, 2023-2030 ($)
Table 53 Middle East & Africa Omega 3 PUFA Market, Revenue & Volume,By Type, 2023-2030 ($)
Table 54 Middle East & Africa Omega 3 PUFA Market, Revenue & Volume,By Source, 2023-2030 ($)
Table 55 Middle East & Africa Omega 3 PUFA Market, Revenue & Volume,By Chemical Composition, 2023-2030 ($)
Table 56 Russia Omega 3 PUFA Market, Revenue & Volume,By Type, 2023-2030 ($)
Table 57 Russia Omega 3 PUFA Market, Revenue & Volume,By Source, 2023-2030 ($)
Table 58 Russia Omega 3 PUFA Market, Revenue & Volume,By Chemical Composition, 2023-2030 ($)
Table 59 Israel Omega 3 PUFA Market, Revenue & Volume,By Type, 2023-2030 ($)
Table 60 Israel Omega 3 PUFA Market, Revenue & Volume,By Source, 2023-2030 ($)
Table 61 Israel Omega 3 PUFA Market, Revenue & Volume,By Chemical Composition, 2023-2030 ($)
Table 62 Top Companies 2023 (US$)Omega 3 PUFA Market, Revenue & Volume,,
Table 63 Product Launch 2023-2024Omega 3 PUFA Market, Revenue & Volume,,
Table 64 Mergers & Acquistions 2023-2024Omega 3 PUFA Market, Revenue & Volume,,
List of Figures
Figure 1 Overview of Omega 3 PUFA Market 2023-2030
Figure 2 Market Share Analysis for Omega 3 PUFA Market 2023 (US$)
Figure 3 Product Comparison in Omega 3 PUFA Market 2023-2024 (US$)
Figure 4 End User Profile for Omega 3 PUFA Market 2023-2024 (US$)
Figure 5 Patent Application and Grant in Omega 3 PUFA Market 2021-2023* (US$)
Figure 6 Top 5 Companies Financial Analysis in Omega 3 PUFA Market 2023-2024 (US$)
Figure 7 Market Entry Strategy in Omega 3 PUFA Market 2023-2024
Figure 8 Ecosystem Analysis in Omega 3 PUFA Market2023
Figure 9 Average Selling Price in Omega 3 PUFA Market 2023-2030
Figure 10 Top Opportunites in Omega 3 PUFA Market 2023-2024
Figure 11 Market Life Cycle Analysis in Omega 3 PUFA Market
Figure 12 GlobalBy TypeOmega 3 PUFA Market Revenue, 2023-2030 ($)
Figure 13 GlobalBy SourceOmega 3 PUFA Market Revenue, 2023-2030 ($)
Figure 14 GlobalBy Chemical CompositionOmega 3 PUFA Market Revenue, 2023-2030 ($)
Figure 15 Global Omega 3 PUFA Market - By Geography
Figure 16 Global Omega 3 PUFA Market Value & Volume, By Geography, 2023-2030 ($)
Figure 17 Global Omega 3 PUFA Market CAGR, By Geography, 2023-2030 (%)
Figure 18 North America Omega 3 PUFA Market Value & Volume, 2023-2030 ($)
Figure 19 US Omega 3 PUFA Market Value & Volume, 2023-2030 ($)
Figure 20 US GDP and Population, 2023-2024 ($)
Figure 21 US GDP – Composition of 2023, By Sector of Origin
Figure 22 US Export and Import Value & Volume, 2023-2024 ($)
Figure 23 Canada Omega 3 PUFA Market Value & Volume, 2023-2030 ($)
Figure 24 Canada GDP and Population, 2023-2024 ($)
Figure 25 Canada GDP – Composition of 2023, By Sector of Origin
Figure 26 Canada Export and Import Value & Volume, 2023-2024 ($)
Figure 27 Mexico Omega 3 PUFA Market Value & Volume, 2023-2030 ($)
Figure 28 Mexico GDP and Population, 2023-2024 ($)
Figure 29 Mexico GDP – Composition of 2023, By Sector of Origin
Figure 30 Mexico Export and Import Value & Volume, 2023-2024 ($)
Figure 31 South America Omega 3 PUFA MarketSouth America 3D Printing Market Value & Volume, 2023-2030 ($)
Figure 32 Brazil Omega 3 PUFA Market Value & Volume, 2023-2030 ($)
Figure 33 Brazil GDP and Population, 2023-2024 ($)
Figure 34 Brazil GDP – Composition of 2023, By Sector of Origin
Figure 35 Brazil Export and Import Value & Volume, 2023-2024 ($)
Figure 36 Venezuela Omega 3 PUFA Market Value & Volume, 2023-2030 ($)
Figure 37 Venezuela GDP and Population, 2023-2024 ($)
Figure 38 Venezuela GDP – Composition of 2023, By Sector of Origin
Figure 39 Venezuela Export and Import Value & Volume, 2023-2024 ($)
Figure 40 Argentina Omega 3 PUFA Market Value & Volume, 2023-2030 ($)
Figure 41 Argentina GDP and Population, 2023-2024 ($)
Figure 42 Argentina GDP – Composition of 2023, By Sector of Origin
Figure 43 Argentina Export and Import Value & Volume, 2023-2024 ($)
Figure 44 Ecuador Omega 3 PUFA Market Value & Volume, 2023-2030 ($)
Figure 45 Ecuador GDP and Population, 2023-2024 ($)
Figure 46 Ecuador GDP – Composition of 2023, By Sector of Origin
Figure 47 Ecuador Export and Import Value & Volume, 2023-2024 ($)
Figure 48 Peru Omega 3 PUFA Market Value & Volume, 2023-2030 ($)
Figure 49 Peru GDP and Population, 2023-2024 ($)
Figure 50 Peru GDP – Composition of 2023, By Sector of Origin
Figure 51 Peru Export and Import Value & Volume, 2023-2024 ($)
Figure 52 Colombia Omega 3 PUFA Market Value & Volume, 2023-2030 ($)
Figure 53 Colombia GDP and Population, 2023-2024 ($)
Figure 54 Colombia GDP – Composition of 2023, By Sector of Origin
Figure 55 Colombia Export and Import Value & Volume, 2023-2024 ($)
Figure 56 Costa Rica Omega 3 PUFA MarketCosta Rica 3D Printing Market Value & Volume, 2023-2030 ($)
Figure 57 Costa Rica GDP and Population, 2023-2024 ($)
Figure 58 Costa Rica GDP – Composition of 2023, By Sector of Origin
Figure 59 Costa Rica Export and Import Value & Volume, 2023-2024 ($)
Figure 60 Europe Omega 3 PUFA Market Value & Volume, 2023-2030 ($)
Figure 61 U.K Omega 3 PUFA Market Value & Volume, 2023-2030 ($)
Figure 62 U.K GDP and Population, 2023-2024 ($)
Figure 63 U.K GDP – Composition of 2023, By Sector of Origin
Figure 64 U.K Export and Import Value & Volume, 2023-2024 ($)
Figure 65 Germany Omega 3 PUFA Market Value & Volume, 2023-2030 ($)
Figure 66 Germany GDP and Population, 2023-2024 ($)
Figure 67 Germany GDP – Composition of 2023, By Sector of Origin
Figure 68 Germany Export and Import Value & Volume, 2023-2024 ($)
Figure 69 Italy Omega 3 PUFA Market Value & Volume, 2023-2030 ($)
Figure 70 Italy GDP and Population, 2023-2024 ($)
Figure 71 Italy GDP – Composition of 2023, By Sector of Origin
Figure 72 Italy Export and Import Value & Volume, 2023-2024 ($)
Figure 73 France Omega 3 PUFA Market Value & Volume, 2023-2030 ($)
Figure 74 France GDP and Population, 2023-2024 ($)
Figure 75 France GDP – Composition of 2023, By Sector of Origin
Figure 76 France Export and Import Value & Volume, 2023-2024 ($)
Figure 77 Netherlands Omega 3 PUFA Market Value & Volume, 2023-2030 ($)
Figure 78 Netherlands GDP and Population, 2023-2024 ($)
Figure 79 Netherlands GDP – Composition of 2023, By Sector of Origin
Figure 80 Netherlands Export and Import Value & Volume, 2023-2024 ($)
Figure 81 Belgium Omega 3 PUFA Market Value & Volume, 2023-2030 ($)
Figure 82 Belgium GDP and Population, 2023-2024 ($)
Figure 83 Belgium GDP – Composition of 2023, By Sector of Origin
Figure 84 Belgium Export and Import Value & Volume, 2023-2024 ($)
Figure 85 Spain Omega 3 PUFA Market Value & Volume, 2023-2030 ($)
Figure 86 Spain GDP and Population, 2023-2024 ($)
Figure 87 Spain GDP – Composition of 2023, By Sector of Origin
Figure 88 Spain Export and Import Value & Volume, 2023-2024 ($)
Figure 89 Denmark Omega 3 PUFA Market Value & Volume, 2023-2030 ($)
Figure 90 Denmark GDP and Population, 2023-2024 ($)
Figure 91 Denmark GDP – Composition of 2023, By Sector of Origin
Figure 92 Denmark Export and Import Value & Volume, 2023-2024 ($)
Figure 93 APAC Omega 3 PUFA Market Value & Volume, 2023-2030 ($)
Figure 94 China Omega 3 PUFA MarketValue & Volume, 2023-2030
Figure 95 China GDP and Population, 2023-2024 ($)
Figure 96 China GDP – Composition of 2023, By Sector of Origin
Figure 97 China Export and Import Value & Volume, 2023-2024 ($)Omega 3 PUFA MarketChina Export and Import Value & Volume, 2023-2024 ($)
Figure 98 Australia Omega 3 PUFA Market Value & Volume, 2023-2030 ($)
Figure 99 Australia GDP and Population, 2023-2024 ($)
Figure 100 Australia GDP – Composition of 2023, By Sector of Origin
Figure 101 Australia Export and Import Value & Volume, 2023-2024 ($)
Figure 102 South Korea Omega 3 PUFA Market Value & Volume, 2023-2030 ($)
Figure 103 South Korea GDP and Population, 2023-2024 ($)
Figure 104 South Korea GDP – Composition of 2023, By Sector of Origin
Figure 105 South Korea Export and Import Value & Volume, 2023-2024 ($)
Figure 106 India Omega 3 PUFA Market Value & Volume, 2023-2030 ($)
Figure 107 India GDP and Population, 2023-2024 ($)
Figure 108 India GDP – Composition of 2023, By Sector of Origin
Figure 109 India Export and Import Value & Volume, 2023-2024 ($)
Figure 110 Taiwan Omega 3 PUFA MarketTaiwan 3D Printing Market Value & Volume, 2023-2030 ($)
Figure 111 Taiwan GDP and Population, 2023-2024 ($)
Figure 112 Taiwan GDP – Composition of 2023, By Sector of Origin
Figure 113 Taiwan Export and Import Value & Volume, 2023-2024 ($)
Figure 114 Malaysia Omega 3 PUFA MarketMalaysia 3D Printing Market Value & Volume, 2023-2030 ($)
Figure 115 Malaysia GDP and Population, 2023-2024 ($)
Figure 116 Malaysia GDP – Composition of 2023, By Sector of Origin
Figure 117 Malaysia Export and Import Value & Volume, 2023-2024 ($)
Figure 118 Hong Kong Omega 3 PUFA MarketHong Kong 3D Printing Market Value & Volume, 2023-2030 ($)
Figure 119 Hong Kong GDP and Population, 2023-2024 ($)
Figure 120 Hong Kong GDP – Composition of 2023, By Sector of Origin
Figure 121 Hong Kong Export and Import Value & Volume, 2023-2024 ($)
Figure 122 Middle East & Africa Omega 3 PUFA MarketMiddle East & Africa 3D Printing Market Value & Volume, 2023-2030 ($)
Figure 123 Russia Omega 3 PUFA MarketRussia 3D Printing Market Value & Volume, 2023-2030 ($)
Figure 124 Russia GDP and Population, 2023-2024 ($)
Figure 125 Russia GDP – Composition of 2023, By Sector of Origin
Figure 126 Russia Export and Import Value & Volume, 2023-2024 ($)
Figure 127 Israel Omega 3 PUFA Market Value & Volume, 2023-2030 ($)
Figure 128 Israel GDP and Population, 2023-2024 ($)
Figure 129 Israel GDP – Composition of 2023, By Sector of Origin
Figure 130 Israel Export and Import Value & Volume, 2023-2024 ($)
Figure 131 Entropy Share, By Strategies, 2023-2024* (%)Omega 3 PUFA Market
Figure 132 Developments, 2023-2024*Omega 3 PUFA Market
Figure 133 Company 1 Omega 3 PUFA Market Net Revenue, By Years, 2023-2024* ($)
Figure 134 Company 1 Omega 3 PUFA Market Net Revenue Share, By Business segments, 2023 (%)
Figure 135 Company 1 Omega 3 PUFA Market Net Sales Share, By Geography, 2023 (%)
Figure 136 Company 2 Omega 3 PUFA Market Net Revenue, By Years, 2023-2024* ($)
Figure 137 Company 2 Omega 3 PUFA Market Net Revenue Share, By Business segments, 2023 (%)
Figure 138 Company 2 Omega 3 PUFA Market Net Sales Share, By Geography, 2023 (%)
Figure 139 Company 3Omega 3 PUFA Market Net Revenue, By Years, 2023-2024* ($)
Figure 140 Company 3Omega 3 PUFA Market Net Revenue Share, By Business segments, 2023 (%)
Figure 141 Company 3Omega 3 PUFA Market Net Sales Share, By Geography, 2023 (%)
Figure 142 Company 4 Omega 3 PUFA Market Net Revenue, By Years, 2023-2024* ($)
Figure 143 Company 4 Omega 3 PUFA Market Net Revenue Share, By Business segments, 2023 (%)
Figure 144 Company 4 Omega 3 PUFA Market Net Sales Share, By Geography, 2023 (%)
Figure 145 Company 5 Omega 3 PUFA Market Net Revenue, By Years, 2023-2024* ($)
Figure 146 Company 5 Omega 3 PUFA Market Net Revenue Share, By Business segments, 2023 (%)
Figure 147 Company 5 Omega 3 PUFA Market Net Sales Share, By Geography, 2023 (%)
Figure 148 Company 6 Omega 3 PUFA Market Net Revenue, By Years, 2023-2024* ($)
Figure 149 Company 6 Omega 3 PUFA Market Net Revenue Share, By Business segments, 2023 (%)
Figure 150 Company 6 Omega 3 PUFA Market Net Sales Share, By Geography, 2023 (%)
Figure 151 Company 7 Omega 3 PUFA Market Net Revenue, By Years, 2023-2024* ($)
Figure 152 Company 7 Omega 3 PUFA Market Net Revenue Share, By Business segments, 2023 (%)
Figure 153 Company 7 Omega 3 PUFA Market Net Sales Share, By Geography, 2023 (%)
Figure 154 Company 8 Omega 3 PUFA Market Net Revenue, By Years, 2023-2024* ($)
Figure 155 Company 8 Omega 3 PUFA Market Net Revenue Share, By Business segments, 2023 (%)
Figure 156 Company 8 Omega 3 PUFA Market Net Sales Share, By Geography, 2023 (%)
Figure 157 Company 9 Omega 3 PUFA Market Net Revenue, By Years, 2023-2024* ($)
Figure 158 Company 9 Omega 3 PUFA Market Net Revenue Share, By Business segments, 2023 (%)
Figure 159 Company 9 Omega 3 PUFA Market Net Sales Share, By Geography, 2023 (%)
Figure 160 Company 10 Omega 3 PUFA Market Net Revenue, By Years, 2023-2024* ($)
Figure 161 Company 10 Omega 3 PUFA Market Net Revenue Share, By Business segments, 2023 (%)
Figure 162 Company 10 Omega 3 PUFA Market Net Sales Share, By Geography, 2023 (%)
Figure 163 Company 11 Omega 3 PUFA Market Net Revenue, By Years, 2023-2024* ($)
Figure 164 Company 11 Omega 3 PUFA Market Net Revenue Share, By Business segments, 2023 (%)
Figure 165 Company 11 Omega 3 PUFA Market Net Sales Share, By Geography, 2023 (%)
Figure 166 Company 12 Omega 3 PUFA Market Net Revenue, By Years, 2023-2024* ($)
Figure 167 Company 12 Omega 3 PUFA Market Net Revenue Share, By Business segments, 2023 (%)
Figure 168 Company 12 Omega 3 PUFA Market Net Sales Share, By Geography, 2023 (%)
Figure 169 Company 13Omega 3 PUFA Market Net Revenue, By Years, 2023-2024* ($)
Figure 170 Company 13Omega 3 PUFA Market Net Revenue Share, By Business segments, 2023 (%)
Figure 171 Company 13Omega 3 PUFA Market Net Sales Share, By Geography, 2023 (%)
Figure 172 Company 14 Omega 3 PUFA Market Net Revenue, By Years, 2023-2024* ($)
Figure 173 Company 14 Omega 3 PUFA Market Net Revenue Share, By Business segments, 2023 (%)
Figure 174 Company 14 Omega 3 PUFA Market Net Sales Share, By Geography, 2023 (%)
Figure 175 Company 15 Omega 3 PUFA Market Net Revenue, By Years, 2023-2024* ($)
Figure 176 Company 15 Omega 3 PUFA Market Net Revenue Share, By Business segments, 2023 (%)
Figure 177 Company 15 Omega 3 PUFA Market Net Sales Share, By Geography, 2023 (%)