 Email
Email Print
Print


The conditions/ environment of operation of shunt reactor are not the same as it was a few decades ago owing to the dynamism of this market. Shunt reactor market is constantly evolving thus facilitating development of new technologies. Low transmission power lines combined with growth of renewable energy are the major drivers for this industry.
Dry type Reactors are constructed as single phase units and are thus arranged in a fashion to minimize stray magnetic field on surrounding (in the absence of metallic shielding). When such an arrangement is difficult, some form of magnetic shielding is required and designed with care to minimize eddy current loss and arcing at any joints within the metallic loops. One of the advantages of dry type reactor is absence of inrush current. Oil immersed reactors can be core-less or with gapped iron core. These are either single phase or three phase design with or without fan cooling. These are installed within tanks which hold oil & act as metallic magnetic shields.
Extra-high-voltage (EHV) transmission lines are employed to transmit power over vast distances; due to the long lengths, these lines have large shunt capacitances associated with them. Shunt capacitance exists between the individual phases of the transmission line and also between the phase conductors and ground. When a transmission line is energized, it draws a large charging current because of the large shunt capacitance of the line.
The global market for Shunt reactor was estimated to be $XX billion in 2015. The global market for Power Metering market is estimated to grow at a CAGR of XX% and is forecast to reach $XX billion by 2021. The dry type reactors are forecast to have the highest growth of X% during the forecast period 2016-2021. Power substations, various industries are the major end-users for Shunt reactor.
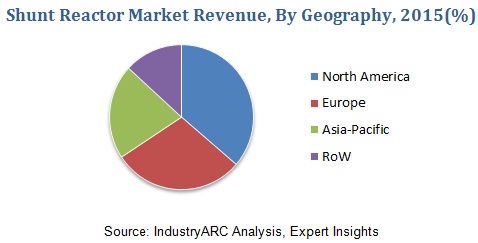
North America is the leading market for Shunt Reactor. North America region is forecast to have highest growth in the next few years due to growing adoption of shunt reactor in industrial applications. North America shunt reactor market accounts to XX% of the global market for Shunt reactor and is the fastest growing market followed by Asia.
1. Market Overview
2. Executive Summary
3. Shunt Reactor Market Landscape
3.1. Market Share Analysis
3.2. Comparative Analysis
3.2.1. Product Benchmarking
3.2.2. End User Profiling
3.2.3. Top 5 Financials Analysis
4. Shunt Reactor Market Forces
4.1. Market Drivers
4.1.1. Addition Of High Voltage Transmission Lines
4.1.2. Low Transmission Power Lines
4.1.3. Growth Of Renewable Energy
4.2. Market Constraints & Challenges
4.2.1. Low Quality & Cheap Products
4.3. Attractiveness Of The Shunt Reactor Industry
4.3.1. Power Of Suppliers
4.3.2. Threats From New Entrants
4.3.3. Power Of Buyer
4.3.4. Threat From Substitute Product
4.3.5. Degree Of Competition
5. Shunt Reactor Market-Strategic Analysis
5.1. Shunt Reactor Market - Value Chain Analysis
5.2. Pricing Analysis
5.3. Opportunity Analysis
5.3.1. Adopting Smart Grid Technology
5.3.2. Continues Increase In Power Generation Capacity
5.4. Suppliers And Distributors
5.5. Swot Analysis
6. Shunt Reactor Market-By Phase
6.1. Introduction
6.2. Single Phase
6.3. Three Phase
7. Shunt Reactor Markte-By Types
7.1. Introduction
7.2. Air-Core Dry Shunt Reactor
7.3. Oil-Immersed
7.4. Others
8. Shunt Reactor Market-By Industry
8.1. Power Substations
8.2. Chemical Industry
8.3. Oil & Gas Industry
8.4. Pharmaceutical
8.5. Pulp & Paper
8.6. Electronics
8.7. Food & Beverage
8.8. Electrical Utilities
8.9. Others
9. Shunt Reactor Market-By Geography
9.1. North America
9.1.1. U.S.
9.1.2. Canada
9.1.3. Mexico
9.2. Europe
9.2.1. U.K.
9.2.2. Germany
9.2.3. Italy
9.2.4. France
9.2.5. Spain
9.2.6. Others
9.3. Asia
9.3.1. China
9.3.2. South Korea
9.3.3. Japan
9.3.4. India
9.3.5. Others
9.4. Rest Of The World (Row)
9.4.1. Mea
9.4.2. South America
9.4.3. Oceania
10. Shunt Reactor Market Entropy
10.1. New Product Developments
10.2. Mergers And Acquisitions
11. Company Profiles
*More than 40 Companies are profiled in this Research Report, Complete List available on Request*
"*Financials would be provided on a best efforts basis for private companies"
List of Tables:
Table 1: Shunt Reactor Market Overview 2023-2030
Table 2: Shunt Reactor Market Leader Analysis 2023-2030 (US$)
Table 3: Shunt Reactor Market Product Analysis 2023-2030 (US$)
Table 4: Shunt Reactor Market End User Analysis 2023-2030 (US$)
Table 5: Shunt Reactor Market Patent Analysis 2013-2023* (US$)
Table 6: Shunt Reactor Market Financial Analysis 2023-2030 (US$)
Table 7: Shunt Reactor Market Driver Analysis 2023-2030 (US$)
Table 8: Shunt Reactor Market Challenges Analysis 2023-2030 (US$)
Table 9: Shunt Reactor Market Constraint Analysis 2023-2030 (US$)
Table 10: Shunt Reactor Market Supplier Bargaining Power Analysis 2023-2030 (US$)
Table 11: Shunt Reactor Market Buyer Bargaining Power Analysis 2023-2030 (US$)
Table 12: Shunt Reactor Market Threat of Substitutes Analysis 2023-2030 (US$)
Table 13: Shunt Reactor Market Threat of New Entrants Analysis 2023-2030 (US$)
Table 14: Shunt Reactor Market Degree of Competition Analysis 2023-2030 (US$)
Table 15: Shunt Reactor Market Value Chain Analysis 2023-2030 (US$)
Table 16: Shunt Reactor Market Pricing Analysis 2023-2030 (US$)
Table 17: Shunt Reactor Market Opportunities Analysis 2023-2030 (US$)
Table 18: Shunt Reactor Market Product Life Cycle Analysis 2023-2030 (US$)
Table 19: Shunt Reactor Market Supplier Analysis 2023-2030 (US$)
Table 20: Shunt Reactor Market Distributor Analysis 2023-2030 (US$)
Table 21: Shunt Reactor Market Trend Analysis 2023-2030 (US$)
Table 22: Shunt Reactor Market Size 2023 (US$)
Table 23: Shunt Reactor Market Forecast Analysis 2023-2030 (US$)
Table 24: Shunt Reactor Market Sales Forecast Analysis 2023-2030 (Units)
Table 25: Shunt Reactor Market, Revenue & Volume, By Types, 2023-2030 ($)
Table 26: Shunt Reactor Market By Types, Revenue & Volume, By Air-Core Dry Shunt Reactor, 2023-2030 ($)
Table 27: Shunt Reactor Market By Types, Revenue & Volume, By Oil-Immersed, 2023-2030 ($)
Table 28: Shunt Reactor Market, Revenue & Volume, By Phase, 2023-2030 ($)
Table 29: Shunt Reactor Market By Phase, Revenue & Volume, By Single Phase, 2023-2030 ($)
Table 30: Shunt Reactor Market By Phase, Revenue & Volume, By Three Phase, 2023-2030 ($)
Table 31: Shunt Reactor Market, Revenue & Volume, By Industry, 2023-2030 ($)
Table 32: Shunt Reactor Market By Industry, Revenue & Volume, By Power Substations, 2023-2030 ($)
Table 33: Shunt Reactor Market By Industry, Revenue & Volume, By Chemical Industry, 2023-2030 ($)
Table 34: Shunt Reactor Market By Industry, Revenue & Volume, By Oil & Gas Industry, 2023-2030 ($)
Table 35: Shunt Reactor Market By Industry, Revenue & Volume, By Pharmaceutical, 2023-2030 ($)
Table 36: Shunt Reactor Market By Industry, Revenue & Volume, By Pulp & Paper, 2023-2030 ($)
Table 37: North America Shunt Reactor Market, Revenue & Volume, By Types, 2023-2030 ($)
Table 38: North America Shunt Reactor Market, Revenue & Volume, By Phase, 2023-2030 ($)
Table 39: North America Shunt Reactor Market, Revenue & Volume, By Industry, 2023-2030 ($)
Table 40: South america Shunt Reactor Market, Revenue & Volume, By Types, 2023-2030 ($)
Table 41: South america Shunt Reactor Market, Revenue & Volume, By Phase, 2023-2030 ($)
Table 42: South america Shunt Reactor Market, Revenue & Volume, By Industry, 2023-2030 ($)
Table 43: Europe Shunt Reactor Market, Revenue & Volume, By Types, 2023-2030 ($)
Table 44: Europe Shunt Reactor Market, Revenue & Volume, By Phase, 2023-2030 ($)
Table 45: Europe Shunt Reactor Market, Revenue & Volume, By Industry, 2023-2030 ($)
Table 46: APAC Shunt Reactor Market, Revenue & Volume, By Types, 2023-2030 ($)
Table 47: APAC Shunt Reactor Market, Revenue & Volume, By Phase, 2023-2030 ($)
Table 48: APAC Shunt Reactor Market, Revenue & Volume, By Industry, 2023-2030 ($)
Table 49: Middle East & Africa Shunt Reactor Market, Revenue & Volume, By Types, 2023-2030 ($)
Table 50: Middle East & Africa Shunt Reactor Market, Revenue & Volume, By Phase, 2023-2030 ($)
Table 51: Middle East & Africa Shunt Reactor Market, Revenue & Volume, By Industry, 2023-2030 ($)
Table 52: Russia Shunt Reactor Market, Revenue & Volume, By Types, 2023-2030 ($)
Table 53: Russia Shunt Reactor Market, Revenue & Volume, By Phase, 2023-2030 ($)
Table 54: Russia Shunt Reactor Market, Revenue & Volume, By Industry, 2023-2030 ($)
Table 55: Israel Shunt Reactor Market, Revenue & Volume, By Types, 2023-2030 ($)
Table 56: Israel Shunt Reactor Market, Revenue & Volume, By Phase, 2023-2030 ($)
Table 57: Israel Shunt Reactor Market, Revenue & Volume, By Industry, 2023-2030 ($)
Table 58: Top Companies 2023 (US$) Shunt Reactor Market, Revenue & Volume
Table 59: Product Launch 2023-2030 Shunt Reactor Market, Revenue & Volume
Table 60: Mergers & Acquistions 2023-2030 Shunt Reactor Market, Revenue & Volume
List of Figures:
Figure 1: Overview of Shunt Reactor Market 2023-2030
Figure 2: Market Share Analysis for Shunt Reactor Market 2023 (US$)
Figure 3: Product Comparison in Shunt Reactor Market 2023-2030 (US$)
Figure 4: End User Profile for Shunt Reactor Market 2023-2030 (US$)
Figure 5: Patent Application and Grant in Shunt Reactor Market 2013-2023* (US$)
Figure 6: Top 5 Companies Financial Analysis in Shunt Reactor Market 2023-2030 (US$)
Figure 7: Market Entry Strategy in Shunt Reactor Market 2023-2030
Figure 8: Ecosystem Analysis in Shunt Reactor Market 2023
Figure 9: Average Selling Price in Shunt Reactor Market 2023-2030
Figure 10: Top Opportunites in Shunt Reactor Market 2023-2030
Figure 11: Market Life Cycle Analysis in Shunt Reactor Market
Figure 12: GlobalBy Types Shunt Reactor Market Revenue, 2023-2030 ($)
Figure 13: GlobalBy Phase Shunt Reactor Market Revenue, 2023-2030 ($)
Figure 14: GlobalBy Industry Shunt Reactor Market Revenue, 2023-2030 ($)
Figure 15: Global Shunt Reactor Market - By Geography
Figure 16: Global Shunt Reactor Market Value & Volume, By Geography, 2023-2030 ($)
Figure 17: Global Shunt Reactor Market CAGR, By Geography, 2023-2030 (%)
Figure 18: North America Shunt Reactor Market Value & Volume, 2023-2030 ($)
Figure 19: US Shunt Reactor Market Value & Volume, 2023-2030 ($)
Figure 20: US GDP and Population, 2023-2030 ($)
Figure 21: US GDP – Composition of 2023, By Sector of Origin
Figure 22: US Export and Import Value & Volume, 2023-2030 ($)
Figure 23: Canada Shunt Reactor Market Value & Volume, 2023-2030 ($)
Figure 24: Canada GDP and Population, 2023-2030 ($)
Figure 25: Canada GDP – Composition of 2023, By Sector of Origin
Figure 26: Canada Export and Import Value & Volume, 2023-2030 ($)
Figure 27: Mexico Shunt Reactor Market Value & Volume, 2023-2030 ($)
Figure 28: Mexico GDP and Population, 2023-2030 ($)
Figure 29: Mexico GDP – Composition of 2023, By Sector of Origin
Figure 30: Mexico Export and Import Value & Volume, 2023-2030 ($)
Figure 31: South America Shunt Reactor Market Value & Volume, 2023-2030 ($)
Figure 32: Brazil Shunt Reactor Market Value & Volume, 2023-2030 ($)
Figure 33: Brazil GDP and Population, 2023-2030 ($)
Figure 34: Brazil GDP – Composition of 2023, By Sector of Origin
Figure 35: Brazil Export and Import Value & Volume, 2023-2030 ($)
Figure 36: Venezuela Shunt Reactor Market Value & Volume, 2023-2030 ($)
Figure 37: Venezuela GDP and Population, 2023-2030 ($)
Figure 38: Venezuela GDP – Composition of 2023, By Sector of Origin
Figure 39: Venezuela Export and Import Value & Volume, 2023-2030 ($)
Figure 40: Argentina Shunt Reactor Market Value & Volume, 2023-2030 ($)
Figure 41: Argentina GDP and Population, 2023-2030 ($)
Figure 42: Argentina GDP – Composition of 2023, By Sector of Origin
Figure 43: Argentina Export and Import Value & Volume, 2023-2030 ($)
Figure 44: Ecuador Shunt Reactor Market Value & Volume, 2023-2030 ($)
Figure 45: Ecuador GDP and Population, 2023-2030 ($)
Figure 46: Ecuador GDP – Composition of 2023, By Sector of Origin
Figure 47: Ecuador Export and Import Value & Volume, 2023-2030 ($)
Figure 48: Peru Shunt Reactor Market Value & Volume, 2023-2030 ($)
Figure 49: Peru GDP and Population, 2023-2030 ($)
Figure 50: Peru GDP – Composition of 2023, By Sector of Origin
Figure 51: Peru Export and Import Value & Volume, 2023-2030 ($)
Figure 52: Colombia Shunt Reactor Market Value & Volume, 2023-2030 ($)
Figure 53: Colombia GDP and Population, 2023-2030 ($)
Figure 54: Colombia GDP – Composition of 2023, By Sector of Origin
Figure 55: Colombia Export and Import Value & Volume, 2023-2030 ($)
Figure 56: Costa Rica Shunt Reactor Market Value & Volume, 2023-2030 ($)
Figure 57: Costa Rica GDP and Population, 2023-2030 ($)
Figure 58: Costa Rica GDP – Composition of 2023, By Sector of Origin
Figure 59: Costa Rica Export and Import Value & Volume, 2023-2030 ($)
Figure 60: Europe Shunt Reactor Market Value & Volume, 2023-2030 ($)
Figure 61: U.K Shunt Reactor Market Value & Volume, 2023-2030 ($)
Figure 62: U.K GDP and Population, 2023-2030 ($)
Figure 63: U.K GDP – Composition of 2023, By Sector of Origin
Figure 64: U.K Export and Import Value & Volume, 2023-2030 ($)
Figure 65: Germany Shunt Reactor Market Value & Volume, 2023-2030 ($)
Figure 66: Germany GDP and Population, 2023-2030 ($)
Figure 67: Germany GDP – Composition of 2023, By Sector of Origin
Figure 68: Germany Export and Import Value & Volume, 2023-2030 ($)
Figure 69: Italy Shunt Reactor Market Value & Volume, 2023-2030 ($)
Figure 70: Italy GDP and Population, 2023-2030 ($)
Figure 71: Italy GDP – Composition of 2023, By Sector of Origin
Figure 72: Italy Export and Import Value & Volume, 2023-2030 ($)
Figure 73: France Shunt Reactor Market Value & Volume, 2023-2030 ($)
Figure 74: France GDP and Population, 2023-2030 ($)
Figure 75: France GDP – Composition of 2023, By Sector of Origin
Figure 76: France Export and Import Value & Volume, 2023-2030 ($)
Figure 77: Netherlands Shunt Reactor Market Value & Volume, 2023-2030 ($)
Figure 78: Netherlands GDP and Population, 2023-2030 ($)
Figure 79: Netherlands GDP – Composition of 2023, By Sector of Origin
Figure 80: Netherlands Export and Import Value & Volume, 2023-2030 ($)
Figure 81: Belgium Shunt Reactor Market Value & Volume, 2023-2030 ($)
Figure 82: Belgium GDP and Population, 2023-2030 ($)
Figure 83: Belgium GDP – Composition of 2023, By Sector of Origin
Figure 84: Belgium Export and Import Value & Volume, 2023-2030 ($)
Figure 85: Spain Shunt Reactor Market Value & Volume, 2023-2030 ($)
Figure 86: Spain GDP and Population, 2023-2030 ($)
Figure 87: Spain GDP – Composition of 2023, By Sector of Origin
Figure 88: Spain Export and Import Value & Volume, 2023-2030 ($)
Figure 89: Denmark Shunt Reactor Market Value & Volume, 2023-2030 ($)
Figure 90: Denmark GDP and Population, 2023-2030 ($)
Figure 91: Denmark GDP – Composition of 2023, By Sector of Origin
Figure 92: Denmark Export and Import Value & Volume, 2023-2030 ($)
Figure 93: APAC Shunt Reactor Market Value & Volume, 2023-2030 ($)
Figure 94: China Shunt Reactor Market Value & Volume, 2023-2030
Figure 95: China GDP and Population, 2023-2030 ($)
Figure 96: China GDP – Composition of 2023, By Sector of Origin
Figure 97: China Export and Import Value & Volume, 2023-2030 ($) Shunt Reactor Market China Export and Import Value & Volume, 2023-2030 ($)
Figure 98: Australia Shunt Reactor Market Value & Volume, 2023-2030 ($)
Figure 99: Australia GDP and Population, 2023-2030 ($)
Figure 100: Australia GDP – Composition of 2023, By Sector of Origin
Figure 101: Australia Export and Import Value & Volume, 2023-2030 ($)
Figure 102: South Korea Shunt Reactor Market Value & Volume, 2023-2030 ($)
Figure 103: South Korea GDP and Population, 2023-2030 ($)
Figure 104: South Korea GDP – Composition of 2023, By Sector of Origin
Figure 105: South Korea Export and Import Value & Volume, 2023-2030 ($)
Figure 106: India Shunt Reactor Market Value & Volume, 2023-2030 ($)
Figure 107: India GDP and Population, 2023-2030 ($)
Figure 108: India GDP – Composition of 2023, By Sector of Origin
Figure 109: India Export and Import Value & Volume, 2023-2030 ($)
Figure 110: Taiwan Shunt Reactor Market Value & Volume, 2023-2030 ($)
Figure 111: Taiwan GDP and Population, 2023-2030 ($)
Figure 112: Taiwan GDP – Composition of 2023, By Sector of Origin
Figure 113: Taiwan Export and Import Value & Volume, 2023-2030 ($)
Figure 114: Malaysia Shunt Reactor Market Value & Volume, 2023-2030 ($)
Figure 115: Malaysia GDP and Population, 2023-2030 ($)
Figure 116: Malaysia GDP – Composition of 2023, By Sector of Origin
Figure 117: Malaysia Export and Import Value & Volume, 2023-2030 ($)
Figure 118: Hong Kong Shunt Reactor Market Value & Volume, 2023-2030 ($)
Figure 119: Hong Kong GDP and Population, 2023-2030 ($)
Figure 120: Hong Kong GDP – Composition of 2023, By Sector of Origin
Figure 121: Hong Kong Export and Import Value & Volume, 2023-2030 ($)
Figure 122: Middle East & Africa Shunt Reactor Market Middle East & Africa 3D Printing Market Value & Volume, 2023-2030 ($)
Figure 123: Russia Shunt Reactor Market Value & Volume, 2023-2030 ($)
Figure 124: Russia GDP and Population, 2023-2030 ($)
Figure 125: Russia GDP – Composition of 2023, By Sector of Origin
Figure 126: Russia Export and Import Value & Volume, 2023-2030 ($)
Figure 127: Israel Shunt Reactor Market Value & Volume, 2023-2030 ($)
Figure 128: Israel GDP and Population, 2023-2030 ($)
Figure 129: Israel GDP – Composition of 2023, By Sector of Origin
Figure 130: Israel Export and Import Value & Volume, 2023-2030 ($)
Figure 131: Entropy Share, By Strategies, 2023-2030* (%) Shunt Reactor Market
Figure 132: Developments, 2023-2030* Shunt Reactor Market
Figure 133: Company 1 Shunt Reactor Market Net Revenue, By Years, 2023-2030* ($)
Figure 134: Company 1 Shunt Reactor Market Net Revenue Share, By Business segments, 2023 (%)
Figure 135: Company 1 Shunt Reactor Market Net Sales Share, By Geography, 2023 (%)
Figure 136: Company 2 Shunt Reactor Market Net Revenue, By Years, 2023-2030* ($)
Figure 137: Company 2 Shunt Reactor Market Net Revenue Share, By Business segments, 2023 (%)
Figure 138: Company 2 Shunt Reactor Market Net Sales Share, By Geography, 2023 (%)
Figure 139: Company 3 Shunt Reactor Market Net Revenue, By Years, 2023-2030* ($)
Figure 140: Company 3 Shunt Reactor Market Net Revenue Share, By Business segments, 2023 (%)
Figure 141: Company 3 Shunt Reactor Market Net Sales Share, By Geography, 2023 (%)
Figure 142: Company 4 Shunt Reactor Market Net Revenue, By Years, 2023-2030* ($)
Figure 143: Company 4 Shunt Reactor Market Net Revenue Share, By Business segments, 2023 (%)
Figure 144: Company 4 Shunt Reactor Market Net Sales Share, By Geography, 2023 (%)
Figure 145: Company 5 Shunt Reactor Market Net Revenue, By Years, 2023-2030* ($)
Figure 146: Company 5 Shunt Reactor Market Net Revenue Share, By Business segments, 2023 (%)
Figure 147: Company 5 Shunt Reactor Market Net Sales Share, By Geography, 2023 (%)
Figure 148: Company 6 Shunt Reactor Market Net Revenue, By Years, 2023-2030* ($)
Figure 149: Company 6 Shunt Reactor Market Net Revenue Share, By Business segments, 2023 (%)
Figure 150: Company 6 Shunt Reactor Market Net Sales Share, By Geography, 2023 (%)
Figure 151: Company 7 Shunt Reactor Market Net Revenue, By Years, 2023-2030* ($)
Figure 152: Company 7 Shunt Reactor Market Net Revenue Share, By Business segments, 2023 (%)
Figure 153: Company 7 Shunt Reactor Market Net Sales Share, By Geography, 2023 (%)
Figure 154: Company 8 Shunt Reactor Market Net Revenue, By Years, 2023-2030* ($)
Figure 155: Company 8 Shunt Reactor Market Net Revenue Share, By Business segments, 2023 (%)
Figure 156: Company 8 Shunt Reactor Market Net Sales Share, By Geography, 2023 (%)
Figure 157: Company 9 Shunt Reactor Market Net Revenue, By Years, 2023-2030* ($)
Figure 158: Company 9 Shunt Reactor Market Net Revenue Share, By Business segments, 2023 (%)
Figure 159: Company 9 Shunt Reactor Market Net Sales Share, By Geography, 2023 (%)
Figure 160: Company 10 Shunt Reactor Market Net Revenue, By Years, 2023-2030* ($)
Figure 161: Company 10 Shunt Reactor Market Net Revenue Share, By Business segments, 2023 (%)
Figure 162: Company 10 Shunt Reactor Market Net Sales Share, By Geography, 2023 (%)
Figure 163: Company 11 Shunt Reactor Market Net Revenue, By Years, 2023-2030* ($)
Figure 164: Company 11 Shunt Reactor Market Net Revenue Share, By Business segments, 2023 (%)
Figure 165: Company 11 Shunt Reactor Market Net Sales Share, By Geography, 2023 (%)
Figure 166: Company 12 Shunt Reactor Market Net Revenue, By Years, 2023-2030* ($)
Figure 167: Company 12 Shunt Reactor Market Net Revenue Share, By Business segments, 2023 (%)
Figure 168: Company 12 Shunt Reactor Market Net Sales Share, By Geography, 2023 (%)
Figure 169: Company 13 Shunt Reactor Market Net Revenue, By Years, 2023-2030* ($)
Figure 170: Company 13 Shunt Reactor Market Net Revenue Share, By Business segments, 2023 (%)
Figure 171: Company 13 Shunt Reactor Market Net Sales Share, By Geography, 2023 (%)
Figure 172: Company 14 Shunt Reactor Market Net Revenue, By Years, 2023-2030* ($)
Figure 173: Company 14 Shunt Reactor Market Net Revenue Share, By Business segments, 2023 (%)
Figure 174: Company 14 Shunt Reactor Market Net Sales Share, By Geography, 2023 (%)
Figure 175: Company 15 Shunt Reactor Market Net Revenue, By Years, 2023-2030* ($)
Figure 176: Company 15 Shunt Reactor Market Net Revenue Share, By Business segments, 2023 (%)
Figure 177: Company 15 Shunt Reactor Market Net Sales Share, By Geography, 2023 (%)