 Email
Email Print
Print


Smart Energy Devices Market - Forecast(2025 - 2031)
Smart energy device market is a critical component for the advancing process industry. Since past decade, the market has been experiencing a rapid growth in with advancements in technology, increasing automation, and integrating the entire value chain of industry. Increased requirements of smart energy devices by consumers for safety, security and convenience, demand for energy efficient solutions, and developments in Internet of Things are the key drivers for the growth of the smart energy devices market.
There is a growing need for smart energy-efficient homes, offices and industrial plants, and this need is increasingly being supported by regulations. Hence there is a growing market for technologies enabling this through the deployment of smart metering as well as intelligent monitoring control systems, heating and lighting.
The global market for smart energy devices market was estimated to be $XX billion in 2015. The global market for smart energy devices market is estimated to grow at a CAGR of XX% and is forecast to reach $XX billion by 2021. The smart meters are forecast to have the highest growth of X% during the forecast period 2016-2021. Water treatment, power consumption are the major end-users for smart energy devices market. As smart energy devices market is an important component in power generation industry. Increasing investment in expanding power generation capacity would drive the demand for smart energy devices market.
The smart energy devices market has been classified on the basis of type into smart meters, smart displays, smart home appliances, smart kitchen, and others. By component into power, memory, processing and communication interface; by operation into emission reductions, security of energy supply, reducing carbon foot print, quality service to end user; and by end-user. Owing to benefits such as lower price as well as lower power consumption, smart energy devices market is being used across industry verticals. However, power generation and water treatment are key end use industries of the global smart energy devices market.
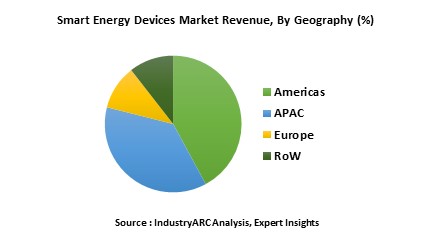
America is the leading market for smart energy devices market with North America leading the charge. American region is forecast to have highest growth in the next few years due to growing adoption of smart energy devices market in industrial applications. America smart energy devices market accounts to XX% of the global market in terms of revenue followed by Asia-Pacific.
There are many key players operating in the global smart devices market which hold the majority market share of around XX% in 2015 such as:
- GE Energy
- Landis + Gyr
- Senus, Simens
- ABB and others
Key Market Players:
The Top 5 companies in the Smart Energy Devices Market are:
- GE Vernova
- ABB Ltd.
- Schneider Electric SE
- Honeywell International Inc.
- Siemens
For more Electronics Market reports, please click here
1. Market Overview
2. Executive Summary
3. Smart Energy Devices Market Landscape
3.1. Market Share Analysis
3.2. Comparative Analysis
3.2.1. Product Benchmarking
3.2.2. End user Profiling
3.2.3. Top 5 Financials Analysis
4. Smart Energy Devices Market Forces
4.1. Market Drivers
4.2. Market Constraints & Challenges
4.3. Attractiveness of the Smart Energy devices Industry
4.3.1. Power of Suppliers
4.3.2. Threats From New Entrants
4.3.3. Power of Buyer
4.3.4. Threat From Substitute Product
4.3.5. Degree of Competition
5. Smart Energy Devices Market Strategic Analysis
5.1. Value Chain Analysis
5.2. Pricing Analysis
5.3. Opportunity Analysis
5.4. Product Life Cycle
5.5. Suppliers and Distributors
6. Smart Energy Devices Market -By Type
6.1. Introduction
6.2. Smart Meters
6.2.1. Smart Thermostats
6.2.2. Load Control Switches
6.2.3. Electric Vehicles
6.3. Smart Displays
6.4. Smart Home Appliances
6.4.1. Washer
6.4.2. Dryer
6.4.3. Air Conditioner
6.4.4. Vacuum Cleaner
6.4.5. Water Heater
6.4.6. Lighting Devices
6.4.7. Security Devices
6.5. Smart Kitchen Appliance
6.5.1. Refrigerator
6.5.2. Dishwasher
6.5.3. Freezer
6.5.4. Cooker
6.5.5. Cook top
6.5.6. Oven
6.6. Smart Connectivity Appliances
6.6.1. Wi-Fi
6.6.2. Bluetooth
6.6.3. NFC
7. Smart Energy Devices Market -By Component
7.1. Introduction
7.2. Power Component
7.3. Memory Component
7.4. Processing Component
7.5. Communication Interface
8. Smart Energy Devices Market By Application
8.1. Emission Reductions
8.2. Security of Energy Supply
8.3. Reducing Carbon Footprint
8.4. Quality Service to End User
9. Smart Energy Devices Market -By End-User
9.1. Home Appliances Market
9.2. Mining
9.3. Water Treatment
9.4. Power Generation
9.5. General Machineries
9.6. Others
10. Smart Energy Devices Market -By Geography
10.1. Americas
10.1.1. U.S.
10.1.2. Canada
10.1.3. Brazil
10.1.4. Mexico
10.1.5. Others
10.2. Europe
10.2.1. U.K.
10.2.2. Germany
10.2.3. Italy
10.2.4. France
10.2.5. Spain
10.2.6. Others
10.3. Asia
10.3.1. China
10.3.2. South Korea
10.3.3. Japan
10.3.4. India
10.3.5. ANZ
10.3.6. Others
10.4. Rest of The World (RoW)
10.4.1. Middle East
10.4.2. Africa
11. Smart Energy Devices Market Market-Entropy
11.1. New Product Developments
11.2. Product launcher, JVs, Mergers and Acquisitions
12. Company Profiles
*More than 40 Companies are profiled in this Research Report, Complete List available on Request*
"*Financials would be provided on a best efforts basis for private companies"
13. Appendix
13.1. Abbreviations
13.2. Sources
13.3. Research Methodology
13.4. Bibliography
13.5. Compilation of Expert Insights
List of Tables
Table 1 Smart Energy Devices Market Overview 2023-2030
Table 2 Smart Energy Devices Market Leader Analysis 2023-2030 (US$)
Table 3 Smart Energy Devices MarketProduct Analysis 2023-2030 (US$)
Table 4 Smart Energy Devices MarketEnd User Analysis 2023-2030 (US$)
Table 5 Smart Energy Devices MarketPatent Analysis 2013-2023* (US$)
Table 6 Smart Energy Devices MarketFinancial Analysis 2023-2030 (US$)
Table 7 Smart Energy Devices Market Driver Analysis 2023-2030 (US$)
Table 8 Smart Energy Devices MarketChallenges Analysis 2023-2030 (US$)
Table 9 Smart Energy Devices MarketConstraint Analysis 2023-2030 (US$)
Table 10 Smart Energy Devices Market Supplier Bargaining Power Analysis 2023-2030 (US$)
Table 11 Smart Energy Devices Market Buyer Bargaining Power Analysis 2023-2030 (US$)
Table 12 Smart Energy Devices Market Threat of Substitutes Analysis 2023-2030 (US$)
Table 13 Smart Energy Devices Market Threat of New Entrants Analysis 2023-2030 (US$)
Table 14 Smart Energy Devices Market Degree of Competition Analysis 2023-2030 (US$)
Table 15 Smart Energy Devices MarketValue Chain Analysis 2023-2030 (US$)
Table 16 Smart Energy Devices MarketPricing Analysis 2023-2030 (US$)
Table 17 Smart Energy Devices MarketOpportunities Analysis 2023-2030 (US$)
Table 18 Smart Energy Devices MarketProduct Life Cycle Analysis 2023-2030 (US$)
Table 19 Smart Energy Devices MarketSupplier Analysis 2023-2030 (US$)
Table 20 Smart Energy Devices MarketDistributor Analysis 2023-2030 (US$)
Table 21 Smart Energy Devices Market Trend Analysis 2023-2030 (US$)
Table 22 Smart Energy Devices Market Size 2023 (US$)
Table 23 Smart Energy Devices Market Forecast Analysis 2023-2030 (US$)
Table 24 Smart Energy Devices Market Sales Forecast Analysis 2023-2030 (Units)
Table 25 Smart Energy Devices Market, Revenue & Volume,By Type, 2023-2030 ($)
Table 26 Smart Energy Devices MarketBy Type, Revenue & Volume,By Smart Meters, 2023-2030 ($)
Table 27 Smart Energy Devices MarketBy Type, Revenue & Volume,By Smart Displays, 2023-2030 ($)
Table 28 Smart Energy Devices MarketBy Type, Revenue & Volume,By Smart Home Appliances, 2023-2030 ($)
Table 29 Smart Energy Devices MarketBy Type, Revenue & Volume,By Smart Kitchen Appliance, 2023-2030 ($)
Table 30 Smart Energy Devices MarketBy Type, Revenue & Volume,By Smart Connectivity Appliances, 2023-2030 ($)
Table 31 Smart Energy Devices Market, Revenue & Volume,By Component, 2023-2030 ($)
Table 32 Smart Energy Devices MarketBy Component, Revenue & Volume,By Power Component, 2023-2030 ($)
Table 33 Smart Energy Devices MarketBy Component, Revenue & Volume,By Memory Component, 2023-2030 ($)
Table 34 Smart Energy Devices MarketBy Component, Revenue & Volume,By Processing Component, 2023-2030 ($)
Table 35 Smart Energy Devices MarketBy Component, Revenue & Volume,By Communication Interface, 2023-2030 ($)
Table 36 Smart Energy Devices Market, Revenue & Volume,By Application, 2023-2030 ($)
Table 37 Smart Energy Devices MarketBy Application, Revenue & Volume,By Emission Reductions, 2023-2030 ($)
Table 38 Smart Energy Devices MarketBy Application, Revenue & Volume,By Security of Energy Supply, 2023-2030 ($)
Table 39 Smart Energy Devices MarketBy Application, Revenue & Volume,By Reducing Carbon Footprint, 2023-2030 ($)
Table 40 Smart Energy Devices MarketBy Application, Revenue & Volume,By Quality Service to End User, 2023-2030 ($)
Table 41 Smart Energy Devices Market, Revenue & Volume,By End Use, 2023-2030 ($)
Table 42 Smart Energy Devices MarketBy End Use, Revenue & Volume,By Home Appliances Market, 2023-2030 ($)
Table 43 Smart Energy Devices MarketBy End Use, Revenue & Volume,By Mining , 2023-2030 ($)
Table 44 Smart Energy Devices MarketBy End Use, Revenue & Volume,By Water Treatment, 2023-2030 ($)
Table 45 Smart Energy Devices MarketBy End Use, Revenue & Volume,By Power Generation, 2023-2030 ($)
Table 46 Smart Energy Devices MarketBy End Use, Revenue & Volume,By General Machineries , 2023-2030 ($)
Table 47 North America Smart Energy Devices Market, Revenue & Volume,By Type, 2023-2030 ($)
Table 48 North America Smart Energy Devices Market, Revenue & Volume,By Component, 2023-2030 ($)
Table 49 North America Smart Energy Devices Market, Revenue & Volume,By Application, 2023-2030 ($)
Table 50 North America Smart Energy Devices Market, Revenue & Volume,By End Use, 2023-2030 ($)
Table 51 South america Smart Energy Devices Market, Revenue & Volume,By Type, 2023-2030 ($)
Table 52 South america Smart Energy Devices Market, Revenue & Volume,By Component, 2023-2030 ($)
Table 53 South america Smart Energy Devices Market, Revenue & Volume,By Application, 2023-2030 ($)
Table 54 South america Smart Energy Devices Market, Revenue & Volume,By End Use, 2023-2030 ($)
Table 55 Europe Smart Energy Devices Market, Revenue & Volume,By Type, 2023-2030 ($)
Table 56 Europe Smart Energy Devices Market, Revenue & Volume,By Component, 2023-2030 ($)
Table 57 Europe Smart Energy Devices Market, Revenue & Volume,By Application, 2023-2030 ($)
Table 58 Europe Smart Energy Devices Market, Revenue & Volume,By End Use, 2023-2030 ($)
Table 59 APAC Smart Energy Devices Market, Revenue & Volume,By Type, 2023-2030 ($)
Table 60 APAC Smart Energy Devices Market, Revenue & Volume,By Component, 2023-2030 ($)
Table 61 APAC Smart Energy Devices Market, Revenue & Volume,By Application, 2023-2030 ($)
Table 62 APAC Smart Energy Devices Market, Revenue & Volume,By End Use, 2023-2030 ($)
Table 63 Middle East & Africa Smart Energy Devices Market, Revenue & Volume,By Type, 2023-2030 ($)
Table 64 Middle East & Africa Smart Energy Devices Market, Revenue & Volume,By Component, 2023-2030 ($)
Table 65 Middle East & Africa Smart Energy Devices Market, Revenue & Volume,By Application, 2023-2030 ($)
Table 66 Middle East & Africa Smart Energy Devices Market, Revenue & Volume,By End Use, 2023-2030 ($)
Table 67 Russia Smart Energy Devices Market, Revenue & Volume,By Type, 2023-2030 ($)
Table 68 Russia Smart Energy Devices Market, Revenue & Volume,By Component, 2023-2030 ($)
Table 69 Russia Smart Energy Devices Market, Revenue & Volume,By Application, 2023-2030 ($)
Table 70 Russia Smart Energy Devices Market, Revenue & Volume,By End Use, 2023-2030 ($)
Table 71 Israel Smart Energy Devices Market, Revenue & Volume,By Type, 2023-2030 ($)
Table 72 Israel Smart Energy Devices Market, Revenue & Volume,By Component, 2023-2030 ($)
Table 73 Israel Smart Energy Devices Market, Revenue & Volume,By Application, 2023-2030 ($)
Table 74 Israel Smart Energy Devices Market, Revenue & Volume,By End Use, 2023-2030 ($)
Table 75 Top Companies 2023 (US$)Smart Energy Devices Market, Revenue & Volume,,
Table 76 Product Launch 2023-2030Smart Energy Devices Market, Revenue & Volume,,
Table 77 Mergers & Acquistions 2023-2030Smart Energy Devices Market, Revenue & Volume,,
List of Figures
Figure 1 Overview of Smart Energy Devices Market 2023-2030
Figure 2 Market Share Analysis for Smart Energy Devices Market 2023 (US$)
Figure 3 Product Comparison in Smart Energy Devices Market 2023-2030 (US$)
Figure 4 End User Profile for Smart Energy Devices Market 2023-2030 (US$)
Figure 5 Patent Application and Grant in Smart Energy Devices Market 2013-2023* (US$)
Figure 6 Top 5 Companies Financial Analysis in Smart Energy Devices Market 2023-2030 (US$)
Figure 7 Market Entry Strategy in Smart Energy Devices Market 2023-2030
Figure 8 Ecosystem Analysis in Smart Energy Devices Market2023
Figure 9 Average Selling Price in Smart Energy Devices Market 2023-2030
Figure 10 Top Opportunites in Smart Energy Devices Market 2023-2030
Figure 11 Market Life Cycle Analysis in Smart Energy Devices Market
Figure 12 GlobalBy TypeSmart Energy Devices Market Revenue, 2023-2030 ($)
Figure 13 GlobalBy ComponentSmart Energy Devices Market Revenue, 2023-2030 ($)
Figure 14 GlobalBy ApplicationSmart Energy Devices Market Revenue, 2023-2030 ($)
Figure 15 GlobalBy End UseSmart Energy Devices Market Revenue, 2023-2030 ($)
Figure 16 Global Smart Energy Devices Market - By Geography
Figure 17 Global Smart Energy Devices Market Value & Volume, By Geography, 2023-2030 ($)
Figure 18 Global Smart Energy Devices Market CAGR, By Geography, 2023-2030 (%)
Figure 19 North America Smart Energy Devices Market Value & Volume, 2023-2030 ($)
Figure 20 US Smart Energy Devices Market Value & Volume, 2023-2030 ($)
Figure 21 US GDP and Population, 2023-2030 ($)
Figure 22 US GDP – Composition of 2023, By Sector of Origin
Figure 23 US Export and Import Value & Volume, 2023-2030 ($)
Figure 24 Canada Smart Energy Devices Market Value & Volume, 2023-2030 ($)
Figure 25 Canada GDP and Population, 2023-2030 ($)
Figure 26 Canada GDP – Composition of 2023, By Sector of Origin
Figure 27 Canada Export and Import Value & Volume, 2023-2030 ($)
Figure 28 Mexico Smart Energy Devices Market Value & Volume, 2023-2030 ($)
Figure 29 Mexico GDP and Population, 2023-2030 ($)
Figure 30 Mexico GDP – Composition of 2023, By Sector of Origin
Figure 31 Mexico Export and Import Value & Volume, 2023-2030 ($)
Figure 32 South America Smart Energy Devices MarketSouth America 3D Printing Market Value & Volume, 2023-2030 ($)
Figure 33 Brazil Smart Energy Devices Market Value & Volume, 2023-2030 ($)
Figure 34 Brazil GDP and Population, 2023-2030 ($)
Figure 35 Brazil GDP – Composition of 2023, By Sector of Origin
Figure 36 Brazil Export and Import Value & Volume, 2023-2030 ($)
Figure 37 Venezuela Smart Energy Devices Market Value & Volume, 2023-2030 ($)
Figure 38 Venezuela GDP and Population, 2023-2030 ($)
Figure 39 Venezuela GDP – Composition of 2023, By Sector of Origin
Figure 40 Venezuela Export and Import Value & Volume, 2023-2030 ($)
Figure 41 Argentina Smart Energy Devices Market Value & Volume, 2023-2030 ($)
Figure 42 Argentina GDP and Population, 2023-2030 ($)
Figure 43 Argentina GDP – Composition of 2023, By Sector of Origin
Figure 44 Argentina Export and Import Value & Volume, 2023-2030 ($)
Figure 45 Ecuador Smart Energy Devices Market Value & Volume, 2023-2030 ($)
Figure 46 Ecuador GDP and Population, 2023-2030 ($)
Figure 47 Ecuador GDP – Composition of 2023, By Sector of Origin
Figure 48 Ecuador Export and Import Value & Volume, 2023-2030 ($)
Figure 49 Peru Smart Energy Devices Market Value & Volume, 2023-2030 ($)
Figure 50 Peru GDP and Population, 2023-2030 ($)
Figure 51 Peru GDP – Composition of 2023, By Sector of Origin
Figure 52 Peru Export and Import Value & Volume, 2023-2030 ($)
Figure 53 Colombia Smart Energy Devices Market Value & Volume, 2023-2030 ($)
Figure 54 Colombia GDP and Population, 2023-2030 ($)
Figure 55 Colombia GDP – Composition of 2023, By Sector of Origin
Figure 56 Colombia Export and Import Value & Volume, 2023-2030 ($)
Figure 57 Costa Rica Smart Energy Devices MarketCosta Rica 3D Printing Market Value & Volume, 2023-2030 ($)
Figure 58 Costa Rica GDP and Population, 2023-2030 ($)
Figure 59 Costa Rica GDP – Composition of 2023, By Sector of Origin
Figure 60 Costa Rica Export and Import Value & Volume, 2023-2030 ($)
Figure 61 Europe Smart Energy Devices Market Value & Volume, 2023-2030 ($)
Figure 62 U.K Smart Energy Devices Market Value & Volume, 2023-2030 ($)
Figure 63 U.K GDP and Population, 2023-2030 ($)
Figure 64 U.K GDP – Composition of 2023, By Sector of Origin
Figure 65 U.K Export and Import Value & Volume, 2023-2030 ($)
Figure 66 Germany Smart Energy Devices Market Value & Volume, 2023-2030 ($)
Figure 67 Germany GDP and Population, 2023-2030 ($)
Figure 68 Germany GDP – Composition of 2023, By Sector of Origin
Figure 69 Germany Export and Import Value & Volume, 2023-2030 ($)
Figure 70 Italy Smart Energy Devices Market Value & Volume, 2023-2030 ($)
Figure 71 Italy GDP and Population, 2023-2030 ($)
Figure 72 Italy GDP – Composition of 2023, By Sector of Origin
Figure 73 Italy Export and Import Value & Volume, 2023-2030 ($)
Figure 74 France Smart Energy Devices Market Value & Volume, 2023-2030 ($)
Figure 75 France GDP and Population, 2023-2030 ($)
Figure 76 France GDP – Composition of 2023, By Sector of Origin
Figure 77 France Export and Import Value & Volume, 2023-2030 ($)
Figure 78 Netherlands Smart Energy Devices Market Value & Volume, 2023-2030 ($)
Figure 79 Netherlands GDP and Population, 2023-2030 ($)
Figure 80 Netherlands GDP – Composition of 2023, By Sector of Origin
Figure 81 Netherlands Export and Import Value & Volume, 2023-2030 ($)
Figure 82 Belgium Smart Energy Devices Market Value & Volume, 2023-2030 ($)
Figure 83 Belgium GDP and Population, 2023-2030 ($)
Figure 84 Belgium GDP – Composition of 2023, By Sector of Origin
Figure 85 Belgium Export and Import Value & Volume, 2023-2030 ($)
Figure 86 Spain Smart Energy Devices Market Value & Volume, 2023-2030 ($)
Figure 87 Spain GDP and Population, 2023-2030 ($)
Figure 88 Spain GDP – Composition of 2023, By Sector of Origin
Figure 89 Spain Export and Import Value & Volume, 2023-2030 ($)
Figure 90 Denmark Smart Energy Devices Market Value & Volume, 2023-2030 ($)
Figure 91 Denmark GDP and Population, 2023-2030 ($)
Figure 92 Denmark GDP – Composition of 2023, By Sector of Origin
Figure 93 Denmark Export and Import Value & Volume, 2023-2030 ($)
Figure 94 APAC Smart Energy Devices Market Value & Volume, 2023-2030 ($)
Figure 95 China Smart Energy Devices MarketValue & Volume, 2023-2030
Figure 96 China GDP and Population, 2023-2030 ($)
Figure 97 China GDP – Composition of 2023, By Sector of Origin
Figure 98 China Export and Import Value & Volume, 2023-2030 ($)Smart Energy Devices MarketChina Export and Import Value & Volume, 2023-2030 ($)
Figure 99 Australia Smart Energy Devices Market Value & Volume, 2023-2030 ($)
Figure 100 Australia GDP and Population, 2023-2030 ($)
Figure 101 Australia GDP – Composition of 2023, By Sector of Origin
Figure 102 Australia Export and Import Value & Volume, 2023-2030 ($)
Figure 103 South Korea Smart Energy Devices Market Value & Volume, 2023-2030 ($)
Figure 104 South Korea GDP and Population, 2023-2030 ($)
Figure 105 South Korea GDP – Composition of 2023, By Sector of Origin
Figure 106 South Korea Export and Import Value & Volume, 2023-2030 ($)
Figure 107 India Smart Energy Devices Market Value & Volume, 2023-2030 ($)
Figure 108 India GDP and Population, 2023-2030 ($)
Figure 109 India GDP – Composition of 2023, By Sector of Origin
Figure 110 India Export and Import Value & Volume, 2023-2030 ($)
Figure 111 Taiwan Smart Energy Devices MarketTaiwan 3D Printing Market Value & Volume, 2023-2030 ($)
Figure 112 Taiwan GDP and Population, 2023-2030 ($)
Figure 113 Taiwan GDP – Composition of 2023, By Sector of Origin
Figure 114 Taiwan Export and Import Value & Volume, 2023-2030 ($)
Figure 115 Malaysia Smart Energy Devices MarketMalaysia 3D Printing Market Value & Volume, 2023-2030 ($)
Figure 116 Malaysia GDP and Population, 2023-2030 ($)
Figure 117 Malaysia GDP – Composition of 2023, By Sector of Origin
Figure 118 Malaysia Export and Import Value & Volume, 2023-2030 ($)
Figure 119 Hong Kong Smart Energy Devices MarketHong Kong 3D Printing Market Value & Volume, 2023-2030 ($)
Figure 120 Hong Kong GDP and Population, 2023-2030 ($)
Figure 121 Hong Kong GDP – Composition of 2023, By Sector of Origin
Figure 122 Hong Kong Export and Import Value & Volume, 2023-2030 ($)
Figure 123 Middle East & Africa Smart Energy Devices MarketMiddle East & Africa 3D Printing Market Value & Volume, 2023-2030 ($)
Figure 124 Russia Smart Energy Devices MarketRussia 3D Printing Market Value & Volume, 2023-2030 ($)
Figure 125 Russia GDP and Population, 2023-2030 ($)
Figure 126 Russia GDP – Composition of 2023, By Sector of Origin
Figure 127 Russia Export and Import Value & Volume, 2023-2030 ($)
Figure 128 Israel Smart Energy Devices Market Value & Volume, 2023-2030 ($)
Figure 129 Israel GDP and Population, 2023-2030 ($)
Figure 130 Israel GDP – Composition of 2023, By Sector of Origin
Figure 131 Israel Export and Import Value & Volume, 2023-2030 ($)
Figure 132 Entropy Share, By Strategies, 2023-2030* (%)Smart Energy Devices Market
Figure 133 Developments, 2023-2030*Smart Energy Devices Market
Figure 134 Company 1 Smart Energy Devices Market Net Revenue, By Years, 2023-2030* ($)
Figure 135 Company 1 Smart Energy Devices Market Net Revenue Share, By Business segments, 2023 (%)
Figure 136 Company 1 Smart Energy Devices Market Net Sales Share, By Geography, 2023 (%)
Figure 137 Company 2 Smart Energy Devices Market Net Revenue, By Years, 2023-2030* ($)
Figure 138 Company 2 Smart Energy Devices Market Net Revenue Share, By Business segments, 2023 (%)
Figure 139 Company 2 Smart Energy Devices Market Net Sales Share, By Geography, 2023 (%)
Figure 140 Company 3Smart Energy Devices Market Net Revenue, By Years, 2023-2030* ($)
Figure 141 Company 3Smart Energy Devices Market Net Revenue Share, By Business segments, 2023 (%)
Figure 142 Company 3Smart Energy Devices Market Net Sales Share, By Geography, 2023 (%)
Figure 143 Company 4 Smart Energy Devices Market Net Revenue, By Years, 2023-2030* ($)
Figure 144 Company 4 Smart Energy Devices Market Net Revenue Share, By Business segments, 2023 (%)
Figure 145 Company 4 Smart Energy Devices Market Net Sales Share, By Geography, 2023 (%)
Figure 146 Company 5 Smart Energy Devices Market Net Revenue, By Years, 2023-2030* ($)
Figure 147 Company 5 Smart Energy Devices Market Net Revenue Share, By Business segments, 2023 (%)
Figure 148 Company 5 Smart Energy Devices Market Net Sales Share, By Geography, 2023 (%)
Figure 149 Company 6 Smart Energy Devices Market Net Revenue, By Years, 2023-2030* ($)
Figure 150 Company 6 Smart Energy Devices Market Net Revenue Share, By Business segments, 2023 (%)
Figure 151 Company 6 Smart Energy Devices Market Net Sales Share, By Geography, 2023 (%)
Figure 152 Company 7 Smart Energy Devices Market Net Revenue, By Years, 2023-2030* ($)
Figure 153 Company 7 Smart Energy Devices Market Net Revenue Share, By Business segments, 2023 (%)
Figure 154 Company 7 Smart Energy Devices Market Net Sales Share, By Geography, 2023 (%)
Figure 155 Company 8 Smart Energy Devices Market Net Revenue, By Years, 2023-2030* ($)
Figure 156 Company 8 Smart Energy Devices Market Net Revenue Share, By Business segments, 2023 (%)
Figure 157 Company 8 Smart Energy Devices Market Net Sales Share, By Geography, 2023 (%)
Figure 158 Company 9 Smart Energy Devices Market Net Revenue, By Years, 2023-2030* ($)
Figure 159 Company 9 Smart Energy Devices Market Net Revenue Share, By Business segments, 2023 (%)
Figure 160 Company 9 Smart Energy Devices Market Net Sales Share, By Geography, 2023 (%)
Figure 161 Company 10 Smart Energy Devices Market Net Revenue, By Years, 2023-2030* ($)
Figure 162 Company 10 Smart Energy Devices Market Net Revenue Share, By Business segments, 2023 (%)
Figure 163 Company 10 Smart Energy Devices Market Net Sales Share, By Geography, 2023 (%)
Figure 164 Company 11 Smart Energy Devices Market Net Revenue, By Years, 2023-2030* ($)
Figure 165 Company 11 Smart Energy Devices Market Net Revenue Share, By Business segments, 2023 (%)
Figure 166 Company 11 Smart Energy Devices Market Net Sales Share, By Geography, 2023 (%)
Figure 167 Company 12 Smart Energy Devices Market Net Revenue, By Years, 2023-2030* ($)
Figure 168 Company 12 Smart Energy Devices Market Net Revenue Share, By Business segments, 2023 (%)
Figure 169 Company 12 Smart Energy Devices Market Net Sales Share, By Geography, 2023 (%)
Figure 170 Company 13Smart Energy Devices Market Net Revenue, By Years, 2023-2030* ($)
Figure 171 Company 13Smart Energy Devices Market Net Revenue Share, By Business segments, 2023 (%)
Figure 172 Company 13Smart Energy Devices Market Net Sales Share, By Geography, 2023 (%)
Figure 173 Company 14 Smart Energy Devices Market Net Revenue, By Years, 2023-2030* ($)
Figure 174 Company 14 Smart Energy Devices Market Net Revenue Share, By Business segments, 2023 (%)
Figure 175 Company 14 Smart Energy Devices Market Net Sales Share, By Geography, 2023 (%)
Figure 176 Company 15 Smart Energy Devices Market Net Revenue, By Years, 2023-2030* ($)
Figure 177 Company 15 Smart Energy Devices Market Net Revenue Share, By Business segments, 2023 (%)
Figure 178 Company 15 Smart Energy Devices Market Net Sales Share, By Geography, 2023 (%)