 Email
Email Print
Print


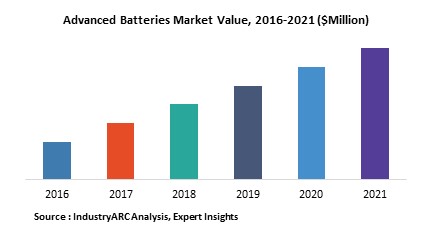
Advanced Batteries Market Size is estimated to reach $43,548 Million by 2030, growing at a CAGR of 7.90% during the forecast period 2024-2030. Advanced batteries are those which are able to have a higher density of energy stored within them whilst having as low an emission of GHGs as possible. Advanced batteries can still be either nickel or lithium based, however the power retention in these batteries is a lot higher than standard batteries. These batteries can be used in the same applications for which standard batteries are used in today, however, there are certain key applications which specifically would benefit from the use of advanced batteries. Communications is one area where advanced batteries have a key benefit. Advanced batteries can be integrated into any energy storage system and further enhance the capacity of the energy storage system.
With a number of governments around the word trying to cut down on carbon emissions, auto manufacturers are looking at electric vehicles as an answer to reduction in carbon emissions. There is already a large volume of electric vehicles on the road as of date now, however, very few in comparison to the sales of standard fuel combustion vehicles. One main reason for this is that individuals are worried as to how far these vehicles will go before the next recharge as the number of charging stations are still very few. Advanced batteries will be able to store more energy which would have these vehicles travelling a lot further than those vehicles using standard batteries.
The Advanced batteries market is segmented by the following battery types Lithium ion, Lithium ion polymer, Nickel-based, Nickel cadmium, Nickel metal hybrid, Smart nano. The Advanced batteries market has further been segmented by storage device type Electrical energy, Mechanical energy, Electrochemical, Others. The Advanced batteries market has been segmented based on the following geographies Americas, APAC, Europe, Middle East and Africa
As on date, the Americas accounts for the highest share for advanced batteries. The Americas has the highest concentration of electric vehicles and smart grids, both of which are employing advanced batteries today.
The competitive landscape of the advanced batteries market consists of the following key players
- BYD Company Limited
- China BAK Battery
- Ener Del Inc
- Ener1 Inc
- GS Yuasa Corporation
1. Advanced Batteries Market - Overview
1.1. Definitions and Scope
2. Advanced Batteries Market - Executive summary
2.1. Market Revenue, Market Size and Key Trends by Company
2.2. Key Trends by type of Application
2.3. Key Trends segmented by Geography
3. Advanced Batteries Market
3.1. Comparative analysis
3.1.1. Product Benchmarking - Top 10 companies
3.1.2. Top 5 Financials Analysis
3.1.3. Market Value split by Top 10 companies
3.1.4. Patent Analysis - Top 10 companies
3.1.5. Pricing Analysis
4. Advanced Batteries Market – Startup companies Scenario Premium
4.1. Top 10 startup company Analysis by
4.1.1. Investment
4.1.2. Revenue
4.1.3. Market Shares
4.1.4. Market Size and Application Analysis
4.1.5. Venture Capital and Funding Scenario
5. Advanced Batteries Market – Industry Market Entry Scenario Premium
5.1. Regulatory Framework Overview
5.2. New Business and Ease of Doing business index
5.3. Case studies of successful ventures
5.4. Customer Analysis – Top 10 companies
6. Advanced Batteries Market Forces
6.1. Drivers
6.2. Constraints
6.3. Challenges
6.4. Porters five force model
6.4.1. Bargaining power of suppliers
6.4.2. Bargaining powers of customers
6.4.3. Threat of new entrants
6.4.4. Rivalry among existing players
6.4.5. Threat of substitutes
7. Advanced Batteries Market -Strategic analysis
7.1. Value chain analysis
7.2. Opportunities analysis
7.3. Product life cycle
7.4. Suppliers and distributors Market Share
8. Advanced Batteries Market – By Chemistry (Market Size -$Million / $Billion)
8.1. Market Size and Market Share Analysis
8.2. Application Revenue and Trend Research
8.3. Product Segment Analysis
8.3.1. Advanced Lead Acid
8.3.2. Nickel Based
8.3.2.1. Nickel Cadmium
8.3.2.2. Nickel Hydrogen
8.3.2.3. Nickel Metal Hydride
8.3.2.4. Others
8.3.3. Lithium Based
8.3.3.1. Lithium Sulfur Dioxide (Li-SO2)
8.3.3.2. Lithium Manganese Oxide (Li-MnO2)
8.3.3.3. Lithium Thionyl Chloride (Li-SOCl2)
8.3.3.4. Lithium Cobalt Oxide (Li-CoO2)
8.3.3.5. Lithium Iron Phosphate (LiFePO4)
8.3.3.6. Lithium Nickel Manganese Cobalt Oxide (LiNiMnCoO2/NMC)
8.3.3.7. Others
8.3.4. Silver Based
8.3.5. Silver Zinc (Ag-Zn) Battery
8.3.6. Silver Chloride Magnesium (AgCl-Mg)
8.3.7. Others
9. Advanced Batteries Market – By Chargeability (Market Size -$Million / $Billion)
9.1. Non-Rechargeable
9.2. Rechargeable
10. Advanced Batteries – By End User(Market Size -$Million / $Billion)
10.1. Segment type Size and Market Share Analysis
10.2. Application Revenue and Trends by type of Application
10.3. Application Segment Analysis by Type
10.3.1. Automotive
10.3.1.1. Pure Electric Vehicles
10.3.1.2. Hybird
10.3.1.2.1. Pure Hybrid
10.3.1.2.2. Micro Hybrid
10.3.1.3. Plug-In Hybrid
10.3.1.4. Others
10.3.2. Aerospace and Defense
10.3.2.1. Unmanned Aerial Vehicles
10.3.2.2. Space
10.3.2.2.1. Launch Vehicles
10.3.2.2.2. Satellites
10.3.2.3. Unmanned Ground Vehicles
10.3.2.4. Armoured Vehicles
10.3.2.5. Commercial Aircrafts
10.3.2.6. Military Aircrafts
10.3.2.7. Others
10.3.3. Power and Energy
10.3.3.1. Generation
10.3.3.1.1. Conventional Power Plants
10.3.3.1.2. Wind Farms
10.3.3.1.3. Solar Farms
10.3.3.1.4. Microgrid and Offgrid
10.3.3.1.5. Others
10.3.3.2. Transmission
10.3.3.3. Distribution
10.3.4. Medical and Healthcare
10.3.4.1. Emergency Lighting
10.3.4.2. Wearable Devices
10.3.4.3. Others
10.3.5. Industrial
10.3.5.1. Automated Guided Vehicles (AGVs)
10.3.5.2. Electric Cranes and Hoists
10.3.5.3. Data Loggers
10.3.5.4. Smart Meters
10.3.5.5. Wireless Sensor Networks
10.3.5.6. Emergency Lighting, Safety and Security Systems
10.3.5.7. Others
10.3.6. Information and Communiation Technology
10.3.6.1. Telecommunication
10.3.6.2. Data Centers
10.3.6.3. Security Systems
10.3.6.4. Others
10.3.7. Transporation
10.3.7.1. Railway Locomotive and Passenger Cars
10.3.7.2. Marine
10.3.7.2.1. Ships, Vessels and Yatch
10.3.7.2.2. On Shore/Port Equipment
10.3.7.2.3. Unmanned Underwater and Surface Vehicles
10.3.7.2.4. Others
10.3.7.3. Transport Hubs
10.3.7.4. Others
10.3.8. Oil and Gas
10.3.8.1. Upstream
10.3.8.2. Midstream
10.3.8.3. Downstream
10.3.9. Water Treatment and Distribution Utilties
10.3.10. Others
11. Advanced Batteries - By Geography (Market Size -$Million / $Billion)
11.1. Advanced Batteries Market - North America Segment Research
11.2. North America Market Research (Million / $Billion)
11.2.1. Segment type Size and Market Size Analysis
11.2.2. Revenue and Trends
11.2.3. Application Revenue and Trends by type of Application
11.2.4. Company Revenue and Product Analysis
11.2.5. North America Product type and Application Market Size
11.2.5.1. U.S.
11.2.5.2. Canada
11.2.5.3. Mexico
11.2.5.4. Rest of North America
11.3. Advanced Batteries - South America Segment Research
11.4. South America Market Research (Market Size -$Million / $Billion)
11.4.1. Segment type Size and Market Size Analysis
11.4.2. Revenue and Trends
11.4.3. Application Revenue and Trends by type of Application
11.4.4. Company Revenue and Product Analysis
11.4.5. South America Product type and Application Market Size
11.4.5.1. Brazil
11.4.5.2. Venezuela
11.4.5.3. Argentina
11.4.5.4. Ecuador
11.4.5.5. Peru
11.4.5.6. Colombia
11.4.5.7. Costa Rica
11.4.5.8. Rest of South America
11.5. Advanced Batteries - Europe Segment Research
11.6. Europe Market Research (Market Size -$Million / $Billion)
11.6.1. Segment type Size and Market Size Analysis
11.6.2. Revenue and Trends
11.6.3. Application Revenue and Trends by type of Application
11.6.4. Company Revenue and Product Analysis
11.6.5. Europe Segment Product type and Application Market Size
11.6.5.1. U.K
11.6.5.2. Germany
11.6.5.3. Italy
11.6.5.4. France
11.6.5.5. Netherlands
11.6.5.6. Belgium
11.6.5.7. Spain
11.6.5.8. Denmark
11.6.5.9. Rest of Europe
11.7. Advanced Batteries – APAC Segment Research
11.8. APAC Market Research (Market Size -$Million / $Billion)
11.8.1. Segment type Size and Market Size Analysis
11.8.2. Revenue and Trends
11.8.3. Application Revenue and Trends by type of Application
11.8.4. Company Revenue and Product Analysis
11.8.5. APAC Segment – Product type and Application Market Size
11.8.5.1. China
11.8.5.2. Australia
11.8.5.3. Japan
11.8.5.4. South Korea
11.8.5.5. India
11.8.5.6. Taiwan
11.8.5.7. Malaysia
12. Advanced Batteries Market - Entropy
12.1. New product launches
12.2. M&A's, collaborations, JVs and partnerships
13. Advanced Batteries Market – Industry / Segment Competition landscape Premium
13.1. Market Share Analysis
13.1.1. Market Share by Country- Top companies
13.1.2. Market Share by Region- Top 10 companies
13.1.3. Market Share by type of Application – Top 10 companies
13.1.4. Market Share by type of Product / Product category- Top 10 companies
13.1.5. Market Share at global level- Top 10 companies
13.1.6. Best Practises for companies
14. Advanced Batteries Market – Key Company List by Country Premium
15. Advanced Batteries Market Company Analysis
15.1. Market Share, Company Revenue, Products, M&A, Developments
15.2. BYD Company Limited
15.3. China BAK Battery
15.4. Ener Del Inc
15.5. Ener1 Inc
15.6. GS Yuasa Corporation
15.7. Company 6
15.8. Company 7
15.9. Company 8
15.10. Company 9
15.11. Company 10 and more
"*Financials would be provided on a best efforts basis for private companies"
16. Advanced Batteries Market - Appendix
16.1. Abbreviations
16.2. Sources
17. Advanced Batteries Market - Methodology
17.1. Research Methodology
17.1.1. Company Expert Interviews
17.1.2. Industry Databases
17.1.3. Associations
17.1.4. Company News
17.1.5. Company Annual Reports
17.1.6. Application Trends
17.1.7. New Products and Product database
17.1.8. Company Transcripts
17.1.9. R&D Trends
17.1.10. Key Opinion Leaders Interviews
17.1.11. Supply and Demand Trends
List of Tables:
Table 1: Advanced Batteries Market Overview 2023-2030
Table 2: Advanced Batteries Market Leader Analysis 2023-2030 (US$)
Table 3: Advanced Batteries Market Product Analysis 2023-2030 (US$)
Table 4: Advanced Batteries Market End User Analysis 2023-2030 (US$)
Table 5: Advanced Batteries Market Patent Analysis 2013-2023* (US$)
Table 6: Advanced Batteries Market Financial Analysis 2023-2030 (US$)
Table 7: Advanced Batteries Market Driver Analysis 2023-2030 (US$)
Table 8: Advanced Batteries Market Challenges Analysis 2023-2030 (US$)
Table 9: Advanced Batteries Market Constraint Analysis 2023-2030 (US$)
Table 10: Advanced Batteries Market Supplier Bargaining Power Analysis 2023-2030 (US$)
Table 11: Advanced Batteries Market Buyer Bargaining Power Analysis 2023-2030 (US$)
Table 12: Advanced Batteries Market Threat of Substitutes Analysis 2023-2030 (US$)
Table 13: Advanced Batteries Market Threat of New Entrants Analysis 2023-2030 (US$)
Table 14: Advanced Batteries Market Degree of Competition Analysis 2023-2030 (US$)
Table 15: Advanced Batteries Market Value Chain Analysis 2023-2030 (US$)
Table 16: Advanced Batteries Market Pricing Analysis 2023-2030 (US$)
Table 17: Advanced Batteries Market Opportunities Analysis 2023-2030 (US$)
Table 18: Advanced Batteries Market Product Life Cycle Analysis 2023-2030 (US$)
Table 19: Advanced Batteries Market Supplier Analysis 2023-2030 (US$)
Table 20: Advanced Batteries Market Distributor Analysis 2023-2030 (US$)
Table 21: Advanced Batteries Market Trend Analysis 2023-2030 (US$)
Table 22: Advanced Batteries Market Size 2023 (US$)
Table 23: Advanced Batteries Market Forecast Analysis 2023-2030 (US$)
Table 24: Advanced Batteries Market Sales Forecast Analysis 2023-2030 (Units)
Table 25: Advanced Batteries Market, Revenue & Volume,By Battery Type, 2023-2030 ($)
Table 26: Advanced Batteries MarketBy Battery Type, Revenue & Volume,By Lithium ion, 2023-2030 ($)
Table 27: Advanced Batteries MarketBy Battery Type, Revenue & Volume,By Lithium ion polymer, 2023-2030 ($)
Table 28: Advanced Batteries MarketBy Battery Type, Revenue & Volume,By Nickel-based, 2023-2030 ($)
Table 29: Advanced Batteries MarketBy Battery Type, Revenue & Volume,By Nickel cadmium, 2023-2030 ($)
Table 30: Advanced Batteries MarketBy Battery Type, Revenue & Volume,By Nickel metal hybrid, 2023-2030 ($)
Table 31: Advanced Batteries Market, Revenue & Volume,By Application Segment, 2023-2030 ($)
Table 32: Advanced Batteries MarketBy Application Segment, Revenue & Volume,By Electrical energy, 2023-2030 ($)
Table 33: Advanced Batteries MarketBy Application Segment, Revenue & Volume,By Mechanical energy, 2023-2030 ($)
Table 34: Advanced Batteries MarketBy Application Segment, Revenue & Volume,By Electrochemical , 2023-2030 ($)
Table 35: North America Advanced Batteries Market, Revenue & Volume,By Battery Type, 2023-2030 ($)
Table 36: North America Advanced Batteries Market, Revenue & Volume,By Application Segment, 2023-2030 ($)
Table 37: South america Advanced Batteries Market, Revenue & Volume,By Battery Type, 2023-2030 ($)
Table 38: South america Advanced Batteries Market, Revenue & Volume,By Application Segment, 2023-2030 ($)
Table 39: Europe Advanced Batteries Market, Revenue & Volume,By Battery Type, 2023-2030 ($)
Table 40: Europe Advanced Batteries Market, Revenue & Volume,By Application Segment, 2023-2030 ($)
Table 41: APAC Advanced Batteries Market, Revenue & Volume,By Battery Type, 2023-2030 ($)
Table 42: APAC Advanced Batteries Market, Revenue & Volume,By Application Segment, 2023-2030 ($)
Table 43: Middle East & Africa Advanced Batteries Market, Revenue & Volume,By Battery Type, 2023-2030 ($)
Table 44: Middle East & Africa Advanced Batteries Market, Revenue & Volume,By Application Segment, 2023-2030 ($)
Table 45: Russia Advanced Batteries Market, Revenue & Volume,By Battery Type, 2023-2030 ($)
Table 46: Russia Advanced Batteries Market, Revenue & Volume,By Application Segment, 2023-2030 ($)
Table 47: Israel Advanced Batteries Market, Revenue & Volume,By Battery Type, 2023-2030 ($)
Table 48: Israel Advanced Batteries Market, Revenue & Volume,By Application Segment, 2023-2030 ($)
Table 49: Top Companies 2023 (US$)Advanced Batteries Market, Revenue & Volume
Table 50: Product Launch 2023-2030 Advanced Batteries Market, Revenue & Volume
Table 51: Mergers & Acquistions 2023-2030 Advanced Batteries Market, Revenue & Volume
List of Figures:
Figure 1: Overview of Advanced Batteries Market 2023-2030
Figure 2: Market Share Analysis for Advanced Batteries Market 2023 (US$)
Figure 3: Product Comparison in Advanced Batteries Market 2023-2030 (US$)
Figure 4: End User Profile for Advanced Batteries Market 2023-2030 (US$)
Figure 5: Patent Application and Grant in Advanced Batteries Market 2013-2023* (US$)
Figure 6: Top 5 Companies Financial Analysis in Advanced Batteries Market 2023-2030 (US$)
Figure 7: Market Entry Strategy in Advanced Batteries Market 2023-2030
Figure 8: Ecosystem Analysis in Advanced Batteries Market2023
Figure 9: Average Selling Price in Advanced Batteries Market 2023-2030
Figure 10: Top Opportunites in Advanced Batteries Market 2023-2030
Figure 11: Market Life Cycle Analysis in Advanced Batteries Market
Figure 12: GlobalBy Battery TypeAdvanced Batteries Market Revenue, 2023-2030 ($)
Figure 13: GlobalBy Application SegmentAdvanced Batteries Market Revenue, 2023-2030 ($)
Figure 14: Global Advanced Batteries Market - By Geography
Figure 15: Global Advanced Batteries Market Value & Volume, By Geography, 2023-2030 ($)
Figure 16: Global Advanced Batteries Market CAGR, By Geography, 2023-2030 (%)
Figure 17: North America Advanced Batteries Market Value & Volume, 2023-2030 ($)
Figure 18: US Advanced Batteries Market Value & Volume, 2023-2030 ($)
Figure 19: US GDP and Population, 2023-2030 ($)
Figure 20: US GDP – Composition of 2023, By Sector of Origin
Figure 21: US Export and Import Value & Volume, 2023-2030 ($)
Figure 22: Canada Advanced Batteries Market Value & Volume, 2023-2030 ($)
Figure 23: Canada GDP and Population, 2023-2030 ($)
Figure 24: Canada GDP – Composition of 2023, By Sector of Origin
Figure 25: Canada Export and Import Value & Volume, 2023-2030 ($)
Figure 26: Mexico Advanced Batteries Market Value & Volume, 2023-2030 ($)
Figure 27: Mexico GDP and Population, 2023-2030 ($)
Figure 28: Mexico GDP – Composition of 2023, By Sector of Origin
Figure 29: Mexico Export and Import Value & Volume, 2023-2030 ($)
Figure 30: South America Advanced Batteries MarketSouth America 3D Printing Market Value & Volume, 2023-2030 ($)
Figure 31: Brazil Advanced Batteries Market Value & Volume, 2023-2030 ($)
Figure 32: Brazil GDP and Population, 2023-2030 ($)
Figure 33: Brazil GDP – Composition of 2023, By Sector of Origin
Figure 34: Brazil Export and Import Value & Volume, 2023-2030 ($)
Figure 35: Venezuela Advanced Batteries Market Value & Volume, 2023-2030 ($)
Figure 36: Venezuela GDP and Population, 2023-2030 ($)
Figure 37: Venezuela GDP – Composition of 2023, By Sector of Origin
Figure 38: Venezuela Export and Import Value & Volume, 2023-2030 ($)
Figure 39: Argentina Advanced Batteries Market Value & Volume, 2023-2030 ($)
Figure 40: Argentina GDP and Population, 2023-2030 ($)
Figure 41: Argentina GDP – Composition of 2023, By Sector of Origin
Figure 42: Argentina Export and Import Value & Volume, 2023-2030 ($)
Figure 43: Ecuador Advanced Batteries Market Value & Volume, 2023-2030 ($)
Figure 44: Ecuador GDP and Population, 2023-2030 ($)
Figure 45: Ecuador GDP – Composition of 2023, By Sector of Origin
Figure 46: Ecuador Export and Import Value & Volume, 2023-2030 ($)
Figure 47: Peru Advanced Batteries Market Value & Volume, 2023-2030 ($)
Figure 48: Peru GDP and Population, 2023-2030 ($)
Figure 49: Peru GDP – Composition of 2023, By Sector of Origin
Figure 50: Peru Export and Import Value & Volume, 2023-2030 ($)
Figure 51: Colombia Advanced Batteries Market Value & Volume, 2023-2030 ($)
Figure 52: Colombia GDP and Population, 2023-2030 ($)
Figure 53: Colombia GDP – Composition of 2023, By Sector of Origin
Figure 54: Colombia Export and Import Value & Volume, 2023-2030 ($)
Figure 55: Costa Rica Advanced Batteries MarketCosta Rica 3D Printing Market Value & Volume, 2023-2030 ($)
Figure 56: Costa Rica GDP and Population, 2023-2030 ($)
Figure 57: Costa Rica GDP – Composition of 2023, By Sector of Origin
Figure 58: Costa Rica Export and Import Value & Volume, 2023-2030 ($)
Figure 59: Europe Advanced Batteries Market Value & Volume, 2023-2030 ($)
Figure 60: U.K Advanced Batteries Market Value & Volume, 2023-2030 ($)
Figure 61: U.K GDP and Population, 2023-2030 ($)
Figure 62: U.K GDP – Composition of 2023, By Sector of Origin
Figure 63: U.K Export and Import Value & Volume, 2023-2030 ($)
Figure 64: Germany Advanced Batteries Market Value & Volume, 2023-2030 ($)
Figure 65: Germany GDP and Population, 2023-2030 ($)
Figure 66: Germany GDP – Composition of 2023, By Sector of Origin
Figure 67: Germany Export and Import Value & Volume, 2023-2030 ($)
Figure 68: Italy Advanced Batteries Market Value & Volume, 2023-2030 ($)
Figure 69: Italy GDP and Population, 2023-2030 ($)
Figure 70: Italy GDP – Composition of 2023, By Sector of Origin
Figure 71: Italy Export and Import Value & Volume, 2023-2030 ($)
Figure 72: France Advanced Batteries Market Value & Volume, 2023-2030 ($)
Figure 73: France GDP and Population, 2023-2030 ($)
Figure 74: France GDP – Composition of 2023, By Sector of Origin
Figure 75: France Export and Import Value & Volume, 2023-2030 ($)
Figure 76: Netherlands Advanced Batteries Market Value & Volume, 2023-2030 ($)
Figure 77: Netherlands GDP and Population, 2023-2030 ($)
Figure 78: Netherlands GDP – Composition of 2023, By Sector of Origin
Figure 79: Netherlands Export and Import Value & Volume, 2023-2030 ($)
Figure 80: Belgium Advanced Batteries Market Value & Volume, 2023-2030 ($)
Figure 81: Belgium GDP and Population, 2023-2030 ($)
Figure 82: Belgium GDP – Composition of 2023, By Sector of Origin
Figure 83: Belgium Export and Import Value & Volume, 2023-2030 ($)
Figure 84: Spain Advanced Batteries Market Value & Volume, 2023-2030 ($)
Figure 85: Spain GDP and Population, 2023-2030 ($)
Figure 86: Spain GDP – Composition of 2023, By Sector of Origin
Figure 87: Spain Export and Import Value & Volume, 2023-2030 ($)
Figure 88: Denmark Advanced Batteries Market Value & Volume, 2023-2030 ($)
Figure 89: Denmark GDP and Population, 2023-2030 ($)
Figure 90: Denmark GDP – Composition of 2023, By Sector of Origin
Figure 91: Denmark Export and Import Value & Volume, 2023-2030 ($)
Figure 92: APAC Advanced Batteries Market Value & Volume, 2023-2030 ($)
Figure 93: China Advanced Batteries MarketValue & Volume, 2023-2030
Figure 94: China GDP and Population, 2023-2030 ($)
Figure 95: China GDP – Composition of 2023, By Sector of Origin
Figure 96: China Export and Import Value & Volume, 2023-2030 ($)Advanced Batteries MarketChina Export and Import Value & Volume, 2023-2030 ($)
Figure 97: Australia Advanced Batteries Market Value & Volume, 2023-2030 ($)
Figure 98: Australia GDP and Population, 2023-2030 ($)
Figure 99: Australia GDP – Composition of 2023, By Sector of Origin
Figure 100: Australia Export and Import Value & Volume, 2023-2030 ($)
Figure 101: South Korea Advanced Batteries Market Value & Volume, 2023-2030 ($)
Figure 102: South Korea GDP and Population, 2023-2030 ($)
Figure 103: South Korea GDP – Composition of 2023, By Sector of Origin
Figure 104: South Korea Export and Import Value & Volume, 2023-2030 ($)
Figure 105: India Advanced Batteries Market Value & Volume, 2023-2030 ($)
Figure 106: India GDP and Population, 2023-2030 ($)
Figure 107: India GDP – Composition of 2023, By Sector of Origin
Figure 108: India Export and Import Value & Volume, 2023-2030 ($)
Figure 109: Taiwan Advanced Batteries MarketTaiwan 3D Printing Market Value & Volume, 2023-2030 ($)
Figure 110: Taiwan GDP and Population, 2023-2030 ($)
Figure 111: Taiwan GDP – Composition of 2023, By Sector of Origin
Figure 112: Taiwan Export and Import Value & Volume, 2023-2030 ($)
Figure 113: Malaysia Advanced Batteries MarketMalaysia 3D Printing Market Value & Volume, 2023-2030 ($)
Figure 114: Malaysia GDP and Population, 2023-2030 ($)
Figure 115: Malaysia GDP – Composition of 2023, By Sector of Origin
Figure 116: Malaysia Export and Import Value & Volume, 2023-2030 ($)
Figure 117: Hong Kong Advanced Batteries MarketHong Kong 3D Printing Market Value & Volume, 2023-2030 ($)
Figure 118: Hong Kong GDP and Population, 2023-2030 ($)
Figure 119: Hong Kong GDP – Composition of 2023, By Sector of Origin
Figure 120: Hong Kong Export and Import Value & Volume, 2023-2030 ($)
Figure 121: Middle East & Africa Advanced Batteries MarketMiddle East & Africa 3D Printing Market Value & Volume, 2023-2030 ($)
Figure 122: Russia Advanced Batteries MarketRussia 3D Printing Market Value & Volume, 2023-2030 ($)
Figure 123: Russia GDP and Population, 2023-2030 ($)
Figure 124: Russia GDP – Composition of 2023, By Sector of Origin
Figure 125: Russia Export and Import Value & Volume, 2023-2030 ($)
Figure 126: Israel Advanced Batteries Market Value & Volume, 2023-2030 ($)
Figure 127: Israel GDP and Population, 2023-2030 ($)
Figure 128: Israel GDP – Composition of 2023, By Sector of Origin
Figure 129: Israel Export and Import Value & Volume, 2023-2030 ($)
Figure 130: Entropy Share, By Strategies, 2023-2030* (%)Advanced Batteries Market
Figure 131: Developments, 2023-2030*Advanced Batteries Market
Figure 132: Company 1 Advanced Batteries Market Net Revenue, By Years, 2023-2030* ($)
Figure 133: Company 1 Advanced Batteries Market Net Revenue Share, By Business segments, 2023 (%)
Figure 134: Company 1 Advanced Batteries Market Net Sales Share, By Geography, 2023 (%)
Figure 135: Company 2 Advanced Batteries Market Net Revenue, By Years, 2023-2030* ($)
Figure 136: Company 2 Advanced Batteries Market Net Revenue Share, By Business segments, 2023 (%)
Figure 137: Company 2 Advanced Batteries Market Net Sales Share, By Geography, 2023 (%)
Figure 138: Company 3Advanced Batteries Market Net Revenue, By Years, 2023-2030* ($)
Figure 139: Company 3Advanced Batteries Market Net Revenue Share, By Business segments, 2023 (%)
Figure 140: Company 3Advanced Batteries Market Net Sales Share, By Geography, 2023 (%)
Figure 141: Company 4 Advanced Batteries Market Net Revenue, By Years, 2023-2030* ($)
Figure 142: Company 4 Advanced Batteries Market Net Revenue Share, By Business segments, 2023 (%)
Figure 143: Company 4 Advanced Batteries Market Net Sales Share, By Geography, 2023 (%)
Figure 144: Company 5 Advanced Batteries Market Net Revenue, By Years, 2023-2030* ($)
Figure 145: Company 5 Advanced Batteries Market Net Revenue Share, By Business segments, 2023 (%)
Figure 146: Company 5 Advanced Batteries Market Net Sales Share, By Geography, 2023 (%)
Figure 147: Company 6 Advanced Batteries Market Net Revenue, By Years, 2023-2030* ($)
Figure 148: Company 6 Advanced Batteries Market Net Revenue Share, By Business segments, 2023 (%)
Figure 149: Company 6 Advanced Batteries Market Net Sales Share, By Geography, 2023 (%)
Figure 150: Company 7 Advanced Batteries Market Net Revenue, By Years, 2023-2030* ($)
Figure 151: Company 7 Advanced Batteries Market Net Revenue Share, By Business segments, 2023 (%)
Figure 152: Company 7 Advanced Batteries Market Net Sales Share, By Geography, 2023 (%)
Figure 153: Company 8 Advanced Batteries Market Net Revenue, By Years, 2023-2030* ($)
Figure 154: Company 8 Advanced Batteries Market Net Revenue Share, By Business segments, 2023 (%)
Figure 155: Company 8 Advanced Batteries Market Net Sales Share, By Geography, 2023 (%)
Figure 156: Company 9 Advanced Batteries Market Net Revenue, By Years, 2023-2030* ($)
Figure 157: Company 9 Advanced Batteries Market Net Revenue Share, By Business segments, 2023 (%)
Figure 158: Company 9 Advanced Batteries Market Net Sales Share, By Geography, 2023 (%)
Figure 159: Company 10 Advanced Batteries Market Net Revenue, By Years, 2023-2030* ($)
Figure 160: Company 10 Advanced Batteries Market Net Revenue Share, By Business segments, 2023 (%)
Figure 161: Company 10 Advanced Batteries Market Net Sales Share, By Geography, 2023 (%)
Figure 162: Company 11 Advanced Batteries Market Net Revenue, By Years, 2023-2030* ($)
Figure 163: Company 11 Advanced Batteries Market Net Revenue Share, By Business segments, 2023 (%)
Figure 164: Company 11 Advanced Batteries Market Net Sales Share, By Geography, 2023 (%)
Figure 165: Company 12 Advanced Batteries Market Net Revenue, By Years, 2023-2030* ($)
Figure 166: Company 12 Advanced Batteries Market Net Revenue Share, By Business segments, 2023 (%)
Figure 167: Company 12 Advanced Batteries Market Net Sales Share, By Geography, 2023 (%)
Figure 168: Company 13 Advanced Batteries Market Net Revenue, By Years, 2023-2030* ($)
Figure 169: Company 13 Advanced Batteries Market Net Revenue Share, By Business segments, 2023 (%)
Figure 170: Company 13 Advanced Batteries Market Net Sales Share, By Geography, 2023 (%)
Figure 171: Company 14 Advanced Batteries Market Net Revenue, By Years, 2023-2030* ($)
Figure 172: Company 14 Advanced Batteries Market Net Revenue Share, By Business segments, 2023 (%)
Figure 173: Company 14 Advanced Batteries Market Net Sales Share, By Geography, 2023 (%)
Figure 174: Company 15 Advanced Batteries Market Net Revenue, By Years, 2023-2030* ($)
Figure 175: Company 15 Advanced Batteries Market Net Revenue Share, By Business segments, 2023 (%)
Figure 176: Company 15 Advanced Batteries Market Net Sales Share, By Geography, 2023 (%)